Air Pollution in Mādipur: Real-time Air Quality Index and smog alert.
Pollution and air quality forecast for Mādipur. Today is Wednesday, May 13, 2026. The following air pollution values have been recorded for Mādipur:- particulate matter (PM2.5) dust - 107 (Very Unhealthy)
- carbon monoxide (CO) - 200 (Good)
- nitrogen dioxide (NO2) - 23 (Good)
- particulate matter (PM10) suspended dust - 240 (Very bad Hazardous)
- ozone (O3) - 51 (Good)
- sulfur dioxide (SO2) - 15 (Good)

What is the air quality in Mādipur today? Is the air polluted in Mādipur?. Is there smog?
What is the current level of PM2.5 in Mādipur? (particulate matter (PM2.5) dust)
Today's PM2.5 level is:
107 (Very Unhealthy)
For comparison, the highest level of PM2.5 in Mādipur in the last 7 days was: 104 (Friday, October 14, 2022) and the lowest: 25 (Monday, October 10, 2022).
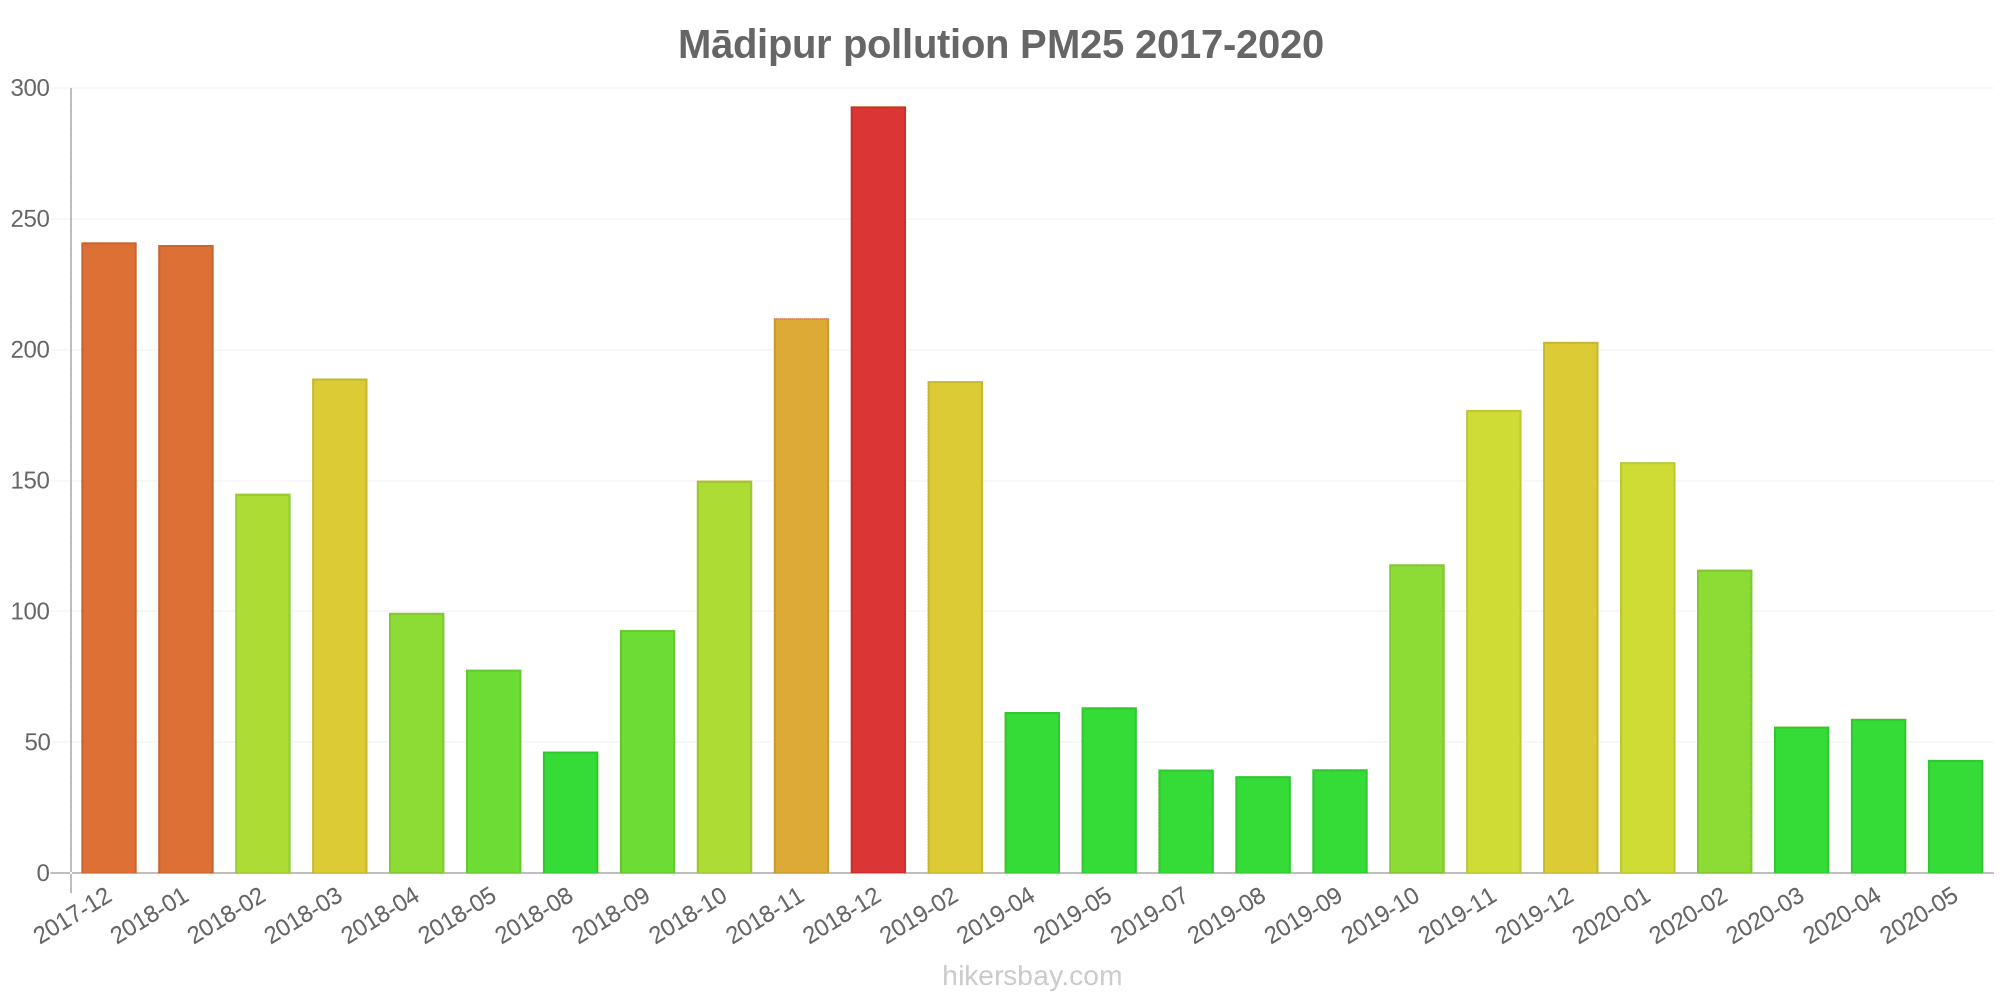
The highest PM2.5 values were recorded: 293 (December 2018).
The lowest level of particulate matter PM2.5 pollution occurs in month: August (37).
How high is the CO level? (carbon monoxide (CO))
200 (Good)
How high is the level of NO2? (nitrogen dioxide (NO2))
23 (Good)
What is the level of PM10 today in Mādipur? (particulate matter (PM10) suspended dust)
The current level of particulate matter PM10 in Mādipur is:
240 (Very bad Hazardous)
The highest PM10 values usually occur in month: 418 (December 2018).
The lowest value of particulate matter PM10 pollution in Mādipur is usually recorded in: August (79).
How is the O3 level today in Mādipur? (ozone (O3))
51 (Good)
What is the level of SO2 pollution? (sulfur dioxide (SO2))
15 (Good)
Current data Friday, October 14, 2022, 5:15 AM
PM2,5 107 (Very Unhealthy)
CO 200 (Good)
NO2 23 (Good)
PM10 240 (Very bad Hazardous)
O3 51 (Good)
SO2 15 (Good)
Data on air pollution from recent days in Mādipur
index
2022-10-07
2022-10-08
2022-10-09
2022-10-10
2022-10-11
2022-10-12
2022-10-13
2022-10-14
no2
22
Good
22
Good
19
Good
21
Good
28
Good
27
Good
25
Good
23
Good
o3
8
Good
10
Good
14
Good
10
Good
18
Good
16
Good
22
Good
26
Good
pm25
31
Moderate
33
Moderate
31
Moderate
25
Moderate
57
Unhealthy
81
Very Unhealthy
59
Unhealthy
104
Very Unhealthy
pm10
82
Unhealthy
43
Moderate
34
Moderate
62
Unhealthy for Sensitive Groups
131
Very Unhealthy
164
Very bad Hazardous
147
Very Unhealthy
195
Very bad Hazardous
co
650
Good
518
Good
600
Good
563
Good
620
Good
505
Good
426
Good
350
Good
so2
11
Good
13
Good
14
Good
12
Good
14
Good
15
Good
15
Good
14
Good
data source »
Air pollution in Mādipur from December 2017 to May 2020

index
2020-05
2020-04
2020-03
2020-02
2020-01
2019-12
2019-11
2019-10
2019-09
2019-08
2019-07
2019-05
2019-04
2019-02
2018-12
2018-11
2018-10
2018-09
2018-08
2018-05
2018-04
2018-03
2018-02
2018-01
2017-12
pm25
43 (Unhealthy for Sensitive Groups)
59 (Unhealthy)
56 (Unhealthy)
116 (Very bad Hazardous)
157 (Very bad Hazardous)
203 (Very bad Hazardous)
177 (Very bad Hazardous)
118 (Very bad Hazardous)
40 (Unhealthy for Sensitive Groups)
37 (Unhealthy for Sensitive Groups)
40 (Unhealthy for Sensitive Groups)
63 (Unhealthy)
62 (Unhealthy)
188 (Very bad Hazardous)
293 (Very bad Hazardous)
212 (Very bad Hazardous)
150 (Very bad Hazardous)
93 (Very Unhealthy)
47 (Unhealthy for Sensitive Groups)
78 (Very Unhealthy)
100 (Very Unhealthy)
189 (Very bad Hazardous)
145 (Very bad Hazardous)
240 (Very bad Hazardous)
241 (Very bad Hazardous)
pm10
99 (Unhealthy)
115 (Very Unhealthy)
123 (Very Unhealthy)
196 (Very bad Hazardous)
227 (Very bad Hazardous)
294 (Very bad Hazardous)
274 (Very bad Hazardous)
238 (Very bad Hazardous)
87 (Unhealthy)
79 (Unhealthy for Sensitive Groups)
139 (Very Unhealthy)
232 (Very bad Hazardous)
274 (Very bad Hazardous)
309 (Very bad Hazardous)
418 (Very bad Hazardous)
344 (Very bad Hazardous)
332 (Very bad Hazardous)
110 (Very Unhealthy)
90 (Unhealthy)
274 (Very bad Hazardous)
169 (Very bad Hazardous)
186 (Very bad Hazardous)
278 (Very bad Hazardous)
399 (Very bad Hazardous)
382 (Very bad Hazardous)
no2
26 (Good)
31 (Good)
58 (Moderate)
49 (Moderate)
52 (Moderate)
56 (Moderate)
53 (Moderate)
56 (Moderate)
46 (Moderate)
38 (Good)
43 (Moderate)
84 (Moderate)
79 (Moderate)
109 (Unhealthy for Sensitive Groups)
132 (Unhealthy for Sensitive Groups)
125 (Unhealthy for Sensitive Groups)
102 (Unhealthy for Sensitive Groups)
36 (Good)
35 (Good)
97 (Moderate)
88 (Moderate)
85 (Moderate)
115 (Unhealthy for Sensitive Groups)
113 (Unhealthy for Sensitive Groups)
121 (Unhealthy for Sensitive Groups)
so2
61 (Moderate)
64 (Moderate)
14 (Good)
14 (Good)
12 (Good)
9.2 (Good)
14 (Good)
16 (Good)
15 (Good)
15 (Good)
15 (Good)
25 (Good)
28 (Good)
31 (Good)
23 (Good)
17 (Good)
15 (Good)
14 (Good)
17 (Good)
37 (Good)
27 (Good)
35 (Good)
21 (Good)
23 (Good)
22 (Good)
co
818 (Good)
758 (Good)
910 (Good)
1 (Good)
1 (Good)
1 (Good)
2 (Good)
1 (Good)
1 (Good)
1 (Good)
1 (Good)
1 (Good)
1 (Good)
1 (Good)
2 (Good)
1 (Good)
2 (Good)
827 (Good)
818 (Good)
1 (Good)
59 (Good)
56 (Good)
3.3 (Good)
2.3 (Good)
2.8 (Good)
o3
28 (Good)
39 (Good)
26 (Good)
19 (Good)
10 (Good)
12 (Good)
17 (Good)
23 (Good)
18 (Good)
13 (Good)
14 (Good)
40 (Good)
32 (Good)
23 (Good)
20 (Good)
53 (Good)
43 (Good)
24 (Good)
29 (Good)
122 (Unhealthy for Sensitive Groups)
42 (Good)
51 (Good)
- (Good)
41 (Good)
47 (Good)
data source »
Punjabi Bagh, New Delhi - DPCC
Friday, October 14, 2022, 5:15 AM
PM2,5 107 (Very Unhealthy)
particulate matter (PM2.5) dust
CO 200 (Good)
carbon monoxide (CO)
NO2 23 (Good)
nitrogen dioxide (NO2)
PM10 240 (Very bad Hazardous)
particulate matter (PM10) suspended dust
O3 51 (Good)
ozone (O3)
SO2 15 (Good)
sulfur dioxide (SO2)
Punjabi Bagh, New Delhi - DPCC
index
2022-10-14
2022-10-13
2022-10-12
2022-10-11
2022-10-10
2022-10-09
2022-10-08
2022-10-07
no2
23
25
27
28
21
19
22
22
o3
26
22
16
18
9.7
14
10
8.1
pm25
104
59
81
57
25
31
33
31
pm10
195
147
164
131
62
34
43
82
co
350
426
505
620
563
600
518
650
so2
14
15
15
14
12
14
13
11
Punjabi Bagh, Delhi - DPCC
2017-12 2020-05

index
2020-05
2020-04
2020-03
2020-02
2020-01
2019-12
2019-11
2019-10
2019-09
2019-08
2019-07
2019-05
2019-04
2019-02
2018-12
2018-11
2018-10
2018-09
2018-08
2018-05
2018-04
2018-03
2018-02
2018-01
2017-12
pm25
43
59
56
116
157
203
177
118
40
37
40
63
62
188
293
212
150
93
47
78
100
189
145
240
241
pm10
99
115
123
196
227
294
274
238
87
79
139
232
274
309
418
344
332
110
90
274
169
186
278
399
382
no2
26
31
58
49
52
56
53
56
46
38
43
84
79
109
132
125
102
36
35
97
88
85
115
113
121
so2
61
64
14
14
12
9.2
14
16
15
15
15
25
28
31
23
17
15
14
17
37
27
35
21
23
22
co
818
758
910
1
1
1
2
1
1
1
1
1
1
1
2
1
2
827
818
1
59
56
3.3
2.3
2.8
o3
28
39
26
19
10
12
17
23
18
13
14
40
32
23
20
53
43
24
29
122
42
51
-
41
47
* Pollution data source:
https://openaq.org
(caaqm)
The data is licensed under CC-By 4.0
PM2,5 107 (Very Unhealthy)
CO 200 (Good)
NO2 23 (Good)
PM10 240 (Very bad Hazardous)
O3 51 (Good)
SO2 15 (Good)
Data on air pollution from recent days in Mādipur
| index | 2022-10-07 | 2022-10-08 | 2022-10-09 | 2022-10-10 | 2022-10-11 | 2022-10-12 | 2022-10-13 | 2022-10-14 |
|---|---|---|---|---|---|---|---|---|
| no2 | 22 Good |
22 Good |
19 Good |
21 Good |
28 Good |
27 Good |
25 Good |
23 Good |
| o3 | 8 Good |
10 Good |
14 Good |
10 Good |
18 Good |
16 Good |
22 Good |
26 Good |
| pm25 | 31 Moderate |
33 Moderate |
31 Moderate |
25 Moderate |
57 Unhealthy |
81 Very Unhealthy |
59 Unhealthy |
104 Very Unhealthy |
| pm10 | 82 Unhealthy |
43 Moderate |
34 Moderate |
62 Unhealthy for Sensitive Groups |
131 Very Unhealthy |
164 Very bad Hazardous |
147 Very Unhealthy |
195 Very bad Hazardous |
| co | 650 Good |
518 Good |
600 Good |
563 Good |
620 Good |
505 Good |
426 Good |
350 Good |
| so2 | 11 Good |
13 Good |
14 Good |
12 Good |
14 Good |
15 Good |
15 Good |
14 Good |
| index | 2020-05 | 2020-04 | 2020-03 | 2020-02 | 2020-01 | 2019-12 | 2019-11 | 2019-10 | 2019-09 | 2019-08 | 2019-07 | 2019-05 | 2019-04 | 2019-02 | 2018-12 | 2018-11 | 2018-10 | 2018-09 | 2018-08 | 2018-05 | 2018-04 | 2018-03 | 2018-02 | 2018-01 | 2017-12 |
|---|---|---|---|---|---|---|---|---|---|---|---|---|---|---|---|---|---|---|---|---|---|---|---|---|---|
| pm25 | 43 (Unhealthy for Sensitive Groups) | 59 (Unhealthy) | 56 (Unhealthy) | 116 (Very bad Hazardous) | 157 (Very bad Hazardous) | 203 (Very bad Hazardous) | 177 (Very bad Hazardous) | 118 (Very bad Hazardous) | 40 (Unhealthy for Sensitive Groups) | 37 (Unhealthy for Sensitive Groups) | 40 (Unhealthy for Sensitive Groups) | 63 (Unhealthy) | 62 (Unhealthy) | 188 (Very bad Hazardous) | 293 (Very bad Hazardous) | 212 (Very bad Hazardous) | 150 (Very bad Hazardous) | 93 (Very Unhealthy) | 47 (Unhealthy for Sensitive Groups) | 78 (Very Unhealthy) | 100 (Very Unhealthy) | 189 (Very bad Hazardous) | 145 (Very bad Hazardous) | 240 (Very bad Hazardous) | 241 (Very bad Hazardous) |
| pm10 | 99 (Unhealthy) | 115 (Very Unhealthy) | 123 (Very Unhealthy) | 196 (Very bad Hazardous) | 227 (Very bad Hazardous) | 294 (Very bad Hazardous) | 274 (Very bad Hazardous) | 238 (Very bad Hazardous) | 87 (Unhealthy) | 79 (Unhealthy for Sensitive Groups) | 139 (Very Unhealthy) | 232 (Very bad Hazardous) | 274 (Very bad Hazardous) | 309 (Very bad Hazardous) | 418 (Very bad Hazardous) | 344 (Very bad Hazardous) | 332 (Very bad Hazardous) | 110 (Very Unhealthy) | 90 (Unhealthy) | 274 (Very bad Hazardous) | 169 (Very bad Hazardous) | 186 (Very bad Hazardous) | 278 (Very bad Hazardous) | 399 (Very bad Hazardous) | 382 (Very bad Hazardous) |
| no2 | 26 (Good) | 31 (Good) | 58 (Moderate) | 49 (Moderate) | 52 (Moderate) | 56 (Moderate) | 53 (Moderate) | 56 (Moderate) | 46 (Moderate) | 38 (Good) | 43 (Moderate) | 84 (Moderate) | 79 (Moderate) | 109 (Unhealthy for Sensitive Groups) | 132 (Unhealthy for Sensitive Groups) | 125 (Unhealthy for Sensitive Groups) | 102 (Unhealthy for Sensitive Groups) | 36 (Good) | 35 (Good) | 97 (Moderate) | 88 (Moderate) | 85 (Moderate) | 115 (Unhealthy for Sensitive Groups) | 113 (Unhealthy for Sensitive Groups) | 121 (Unhealthy for Sensitive Groups) |
| so2 | 61 (Moderate) | 64 (Moderate) | 14 (Good) | 14 (Good) | 12 (Good) | 9.2 (Good) | 14 (Good) | 16 (Good) | 15 (Good) | 15 (Good) | 15 (Good) | 25 (Good) | 28 (Good) | 31 (Good) | 23 (Good) | 17 (Good) | 15 (Good) | 14 (Good) | 17 (Good) | 37 (Good) | 27 (Good) | 35 (Good) | 21 (Good) | 23 (Good) | 22 (Good) |
| co | 818 (Good) | 758 (Good) | 910 (Good) | 1 (Good) | 1 (Good) | 1 (Good) | 2 (Good) | 1 (Good) | 1 (Good) | 1 (Good) | 1 (Good) | 1 (Good) | 1 (Good) | 1 (Good) | 2 (Good) | 1 (Good) | 2 (Good) | 827 (Good) | 818 (Good) | 1 (Good) | 59 (Good) | 56 (Good) | 3.3 (Good) | 2.3 (Good) | 2.8 (Good) |
| o3 | 28 (Good) | 39 (Good) | 26 (Good) | 19 (Good) | 10 (Good) | 12 (Good) | 17 (Good) | 23 (Good) | 18 (Good) | 13 (Good) | 14 (Good) | 40 (Good) | 32 (Good) | 23 (Good) | 20 (Good) | 53 (Good) | 43 (Good) | 24 (Good) | 29 (Good) | 122 (Unhealthy for Sensitive Groups) | 42 (Good) | 51 (Good) | - (Good) | 41 (Good) | 47 (Good) |
PM2,5 107 (Very Unhealthy)
particulate matter (PM2.5) dustCO 200 (Good)
carbon monoxide (CO)NO2 23 (Good)
nitrogen dioxide (NO2)PM10 240 (Very bad Hazardous)
particulate matter (PM10) suspended dustO3 51 (Good)
ozone (O3)SO2 15 (Good)
sulfur dioxide (SO2)Punjabi Bagh, New Delhi - DPCC
| index | 2022-10-14 | 2022-10-13 | 2022-10-12 | 2022-10-11 | 2022-10-10 | 2022-10-09 | 2022-10-08 | 2022-10-07 |
|---|---|---|---|---|---|---|---|---|
| no2 | 23 | 25 | 27 | 28 | 21 | 19 | 22 | 22 |
| o3 | 26 | 22 | 16 | 18 | 9.7 | 14 | 10 | 8.1 |
| pm25 | 104 | 59 | 81 | 57 | 25 | 31 | 33 | 31 |
| pm10 | 195 | 147 | 164 | 131 | 62 | 34 | 43 | 82 |
| co | 350 | 426 | 505 | 620 | 563 | 600 | 518 | 650 |
| so2 | 14 | 15 | 15 | 14 | 12 | 14 | 13 | 11 |
Punjabi Bagh, Delhi - DPCC

| index | 2020-05 | 2020-04 | 2020-03 | 2020-02 | 2020-01 | 2019-12 | 2019-11 | 2019-10 | 2019-09 | 2019-08 | 2019-07 | 2019-05 | 2019-04 | 2019-02 | 2018-12 | 2018-11 | 2018-10 | 2018-09 | 2018-08 | 2018-05 | 2018-04 | 2018-03 | 2018-02 | 2018-01 | 2017-12 |
|---|---|---|---|---|---|---|---|---|---|---|---|---|---|---|---|---|---|---|---|---|---|---|---|---|---|
| pm25 | 43 | 59 | 56 | 116 | 157 | 203 | 177 | 118 | 40 | 37 | 40 | 63 | 62 | 188 | 293 | 212 | 150 | 93 | 47 | 78 | 100 | 189 | 145 | 240 | 241 |
| pm10 | 99 | 115 | 123 | 196 | 227 | 294 | 274 | 238 | 87 | 79 | 139 | 232 | 274 | 309 | 418 | 344 | 332 | 110 | 90 | 274 | 169 | 186 | 278 | 399 | 382 |
| no2 | 26 | 31 | 58 | 49 | 52 | 56 | 53 | 56 | 46 | 38 | 43 | 84 | 79 | 109 | 132 | 125 | 102 | 36 | 35 | 97 | 88 | 85 | 115 | 113 | 121 |
| so2 | 61 | 64 | 14 | 14 | 12 | 9.2 | 14 | 16 | 15 | 15 | 15 | 25 | 28 | 31 | 23 | 17 | 15 | 14 | 17 | 37 | 27 | 35 | 21 | 23 | 22 |
| co | 818 | 758 | 910 | 1 | 1 | 1 | 2 | 1 | 1 | 1 | 1 | 1 | 1 | 1 | 2 | 1 | 2 | 827 | 818 | 1 | 59 | 56 | 3.3 | 2.3 | 2.8 |
| o3 | 28 | 39 | 26 | 19 | 10 | 12 | 17 | 23 | 18 | 13 | 14 | 40 | 32 | 23 | 20 | 53 | 43 | 24 | 29 | 122 | 42 | 51 | - | 41 | 47 |