Air Pollution in Bānkoli: Real-time Air Quality Index and smog alert.
Pollution and air quality forecast for Bānkoli. Today is Wednesday, May 13, 2026. The following air pollution values have been recorded for Bānkoli:- particulate matter (PM2.5) dust - 290 (Very bad Hazardous)
- particulate matter (PM10) suspended dust - 449 (Very bad Hazardous)
- nitrogen dioxide (NO2) - 45 (Moderate)
- carbon monoxide (CO) - 1300 (Good)
- ozone (O3) - 8 (Good)

What is the air quality in Bānkoli today? Is the air polluted in Bānkoli?. Is there smog?
What is the current level of PM2.5 in Bānkoli? (particulate matter (PM2.5) dust)
Today's PM2.5 level is:
290 (Very bad Hazardous)
For comparison, the highest level of PM2.5 in Bānkoli in the last 7 days was: 290 (Monday, October 31, 2022) and the lowest: 290 (Monday, October 31, 2022).
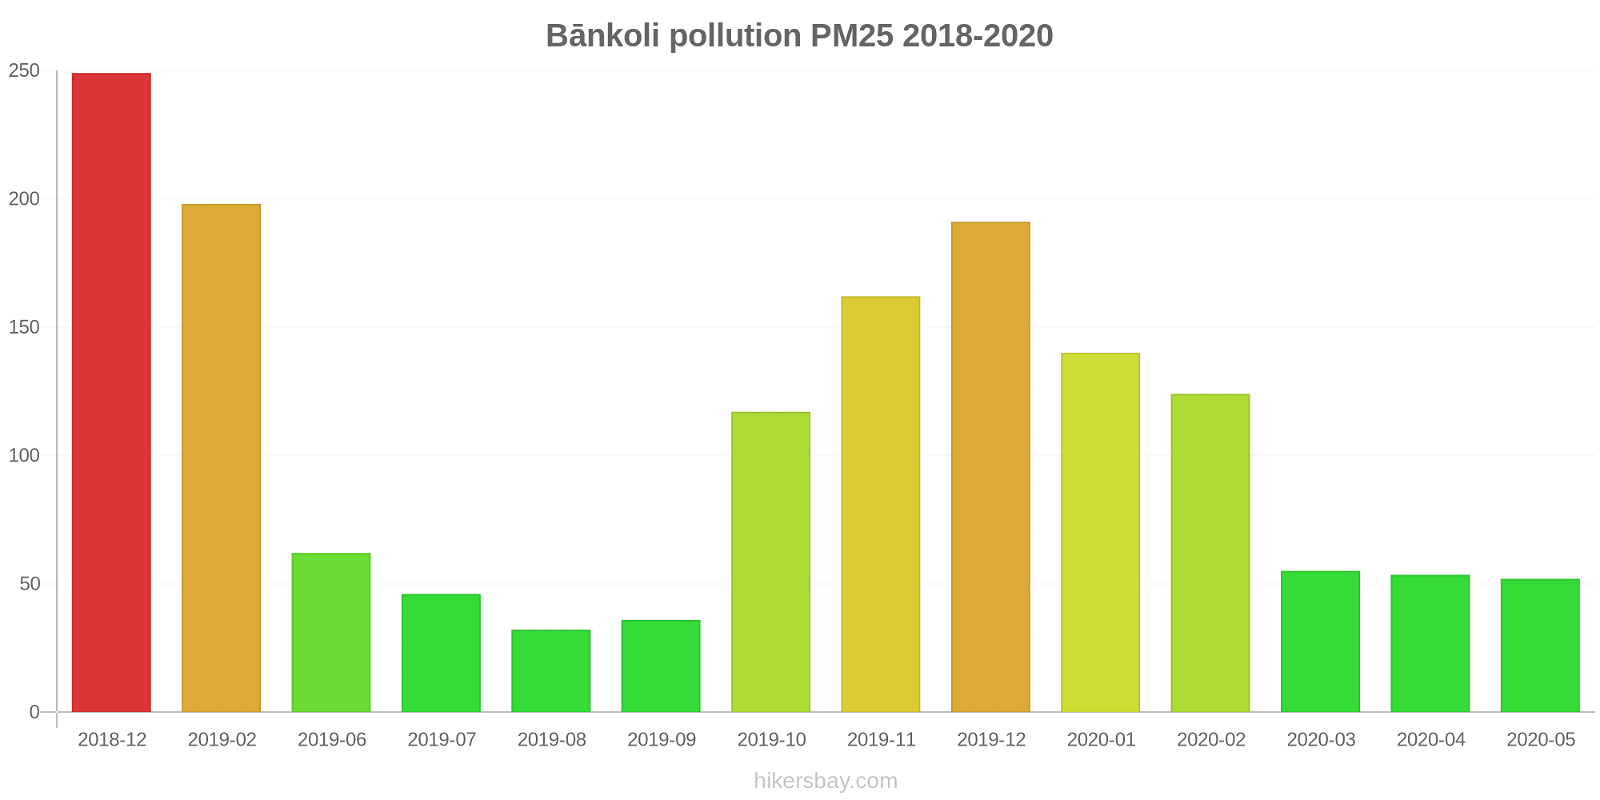
The highest PM2.5 values were recorded: 249 (December 2018).
The lowest level of particulate matter PM2.5 pollution occurs in month: August (32).
What is the level of PM10 today in Bānkoli? (particulate matter (PM10) suspended dust)
The current level of particulate matter PM10 in Bānkoli is:
449 (Very bad Hazardous)
The highest PM10 values usually occur in month: 348 (December 2018).
The lowest value of particulate matter PM10 pollution in Bānkoli is usually recorded in: August (57).
How high is the level of NO2? (nitrogen dioxide (NO2))
45 (Moderate)
How high is the CO level? (carbon monoxide (CO))
1300 (Good)
How is the O3 level today in Bānkoli? (ozone (O3))
8 (Good)
Current data Monday, October 31, 2022, 12:30 AM
PM2,5 290 (Very bad Hazardous)
PM10 449 (Very bad Hazardous)
NO2 45 (Moderate)
CO 1300 (Good)
O3 8 (Good)
Data on air pollution from recent days in Bānkoli
index
2022-10-31
pm25
290
Very bad Hazardous
pm10
449
Very bad Hazardous
no2
45
Moderate
co
1300
Good
o3
8
Good
data source »
Air pollution in Bānkoli from December 2018 to May 2020
index
2020-05
2020-04
2020-03
2020-02
2020-01
2019-12
2019-11
2019-10
2019-09
2019-08
2019-07
2019-06
2019-02
2018-12
pm25
52 (Unhealthy for Sensitive Groups)
54 (Unhealthy for Sensitive Groups)
55 (Unhealthy)
124 (Very bad Hazardous)
140 (Very bad Hazardous)
191 (Very bad Hazardous)
162 (Very bad Hazardous)
117 (Very bad Hazardous)
36 (Unhealthy for Sensitive Groups)
32 (Moderate)
46 (Unhealthy for Sensitive Groups)
62 (Unhealthy)
198 (Very bad Hazardous)
249 (Very bad Hazardous)
pm10
118 (Very Unhealthy)
145 (Very Unhealthy)
111 (Very Unhealthy)
205 (Very bad Hazardous)
200 (Very bad Hazardous)
275 (Very bad Hazardous)
269 (Very bad Hazardous)
206 (Very bad Hazardous)
71 (Unhealthy for Sensitive Groups)
57 (Unhealthy for Sensitive Groups)
131 (Very Unhealthy)
178 (Very bad Hazardous)
311 (Very bad Hazardous)
348 (Very bad Hazardous)
no2
21 (Good)
28 (Good)
35 (Good)
48 (Moderate)
38 (Good)
72 (Moderate)
65 (Moderate)
53 (Moderate)
34 (Good)
41 (Moderate)
40 (Good)
43 (Moderate)
96 (Moderate)
91 (Moderate)
so2
18 (Good)
16 (Good)
14 (Good)
16 (Good)
12 (Good)
14 (Good)
19 (Good)
16 (Good)
12 (Good)
11 (Good)
14 (Good)
11 (Good)
30 (Good)
21 (Good)
co
796 (Good)
824 (Good)
810 (Good)
1 (Good)
1 (Good)
1 (Good)
499 (Good)
1 (Good)
728 (Good)
908 (Good)
773 (Good)
787 (Good)
1 (Good)
1 (Good)
o3
70 (Moderate)
43 (Good)
26 (Good)
29 (Good)
17 (Good)
26 (Good)
26 (Good)
41 (Good)
29 (Good)
24 (Good)
31 (Good)
40 (Good)
31 (Good)
21 (Good)
data source »
Alipur, Delhi - DPCC
Monday, October 31, 2022, 12:30 AM
PM2,5 290 (Very bad Hazardous)
particulate matter (PM2.5) dust
PM10 449 (Very bad Hazardous)
particulate matter (PM10) suspended dust
NO2 45 (Moderate)
nitrogen dioxide (NO2)
CO 1300 (Good)
carbon monoxide (CO)
O3 7.5 (Good)
ozone (O3)
Alipur, Delhi - DPCC
index
2022-10-31
pm25
290
pm10
449
no2
45
co
1300
o3
7.5
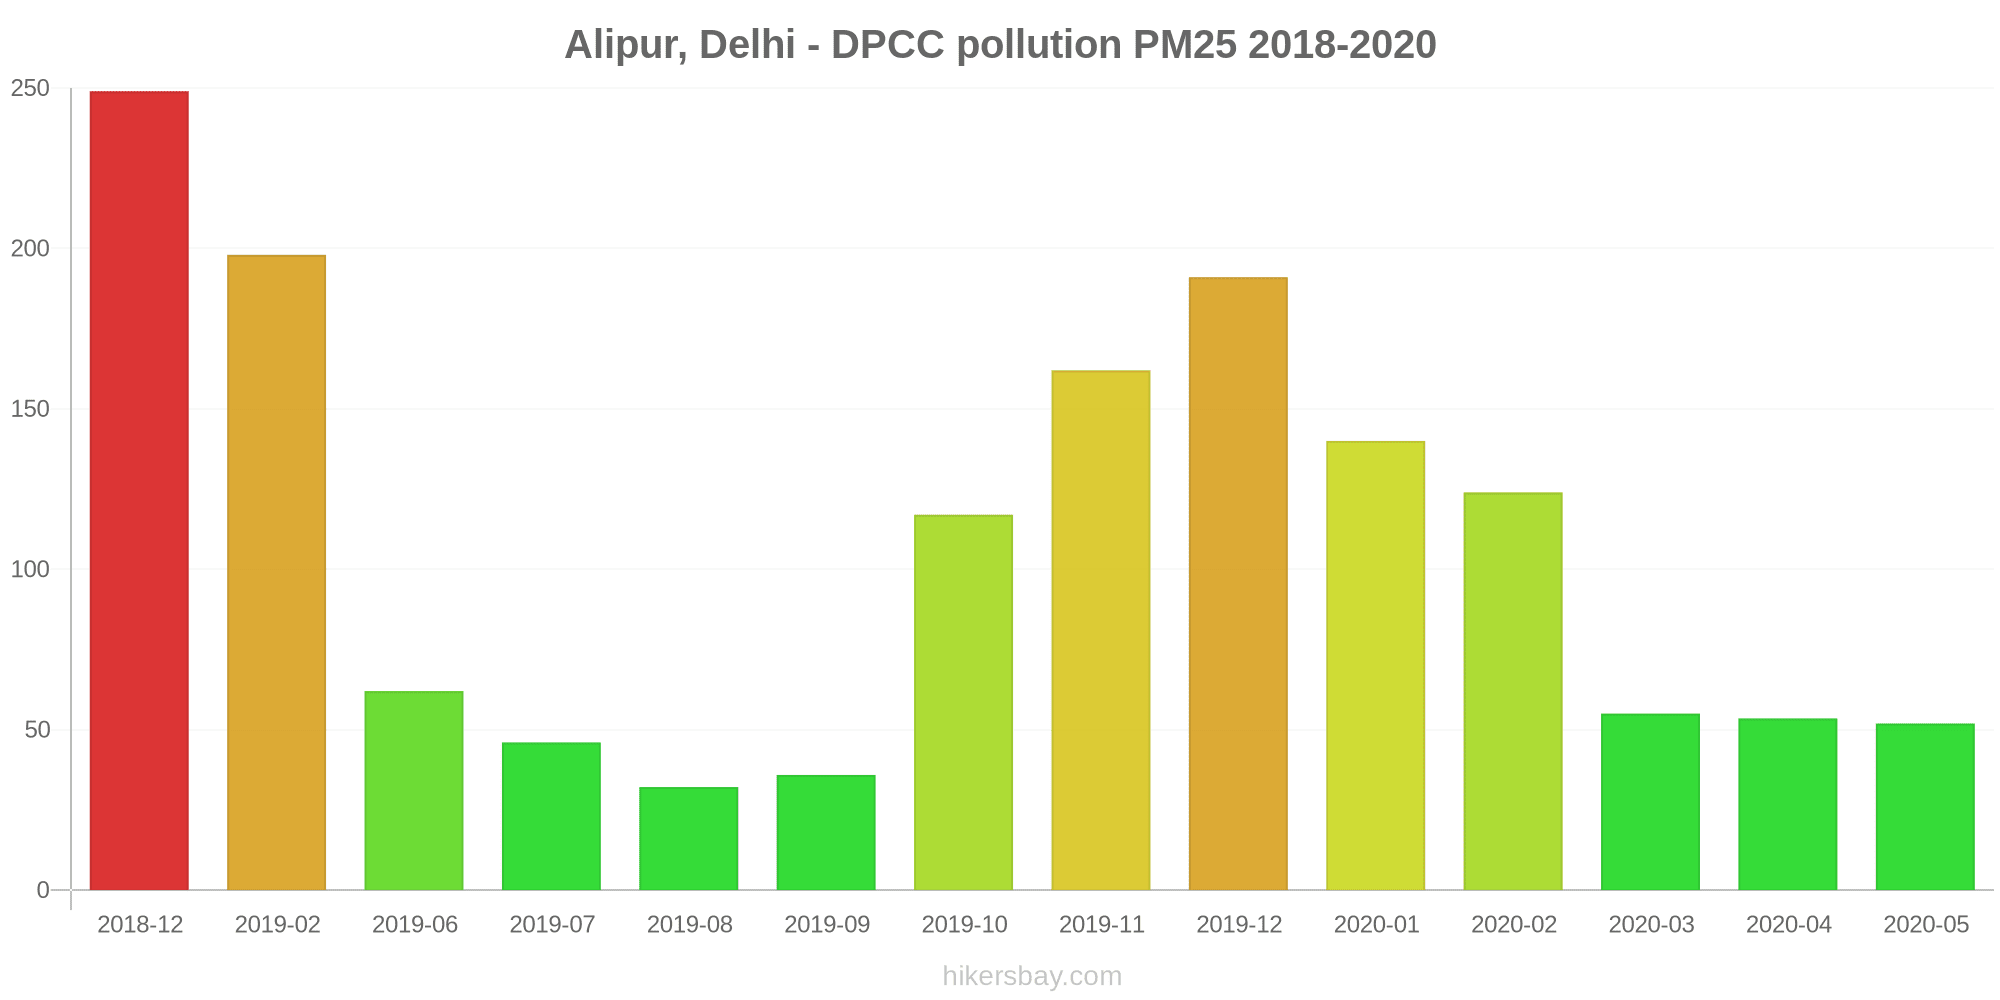
Alipur, Delhi - DPCC
2018-12 2020-05

index
2020-05
2020-04
2020-03
2020-02
2020-01
2019-12
2019-11
2019-10
2019-09
2019-08
2019-07
2019-06
2019-02
2018-12
pm25
52
54
55
124
140
191
162
117
36
32
46
62
198
249
pm10
118
145
111
205
200
275
269
206
71
57
131
178
311
348
no2
21
28
35
48
38
72
65
53
34
41
40
43
96
91
so2
18
16
14
16
12
14
19
16
12
11
14
11
30
21
co
796
824
810
1
1
1
499
1
728
908
773
787
1
1
o3
70
43
26
29
17
26
26
41
29
24
31
40
31
21
* Pollution data source:
https://openaq.org
(caaqm)
The data is licensed under CC-By 4.0
PM2,5 290 (Very bad Hazardous)
PM10 449 (Very bad Hazardous)
NO2 45 (Moderate)
CO 1300 (Good)
O3 8 (Good)
Data on air pollution from recent days in Bānkoli
| index | 2022-10-31 |
|---|---|
| pm25 | 290 Very bad Hazardous |
| pm10 | 449 Very bad Hazardous |
| no2 | 45 Moderate |
| co | 1300 Good |
| o3 | 8 Good |

| index | 2020-05 | 2020-04 | 2020-03 | 2020-02 | 2020-01 | 2019-12 | 2019-11 | 2019-10 | 2019-09 | 2019-08 | 2019-07 | 2019-06 | 2019-02 | 2018-12 |
|---|---|---|---|---|---|---|---|---|---|---|---|---|---|---|
| pm25 | 52 (Unhealthy for Sensitive Groups) | 54 (Unhealthy for Sensitive Groups) | 55 (Unhealthy) | 124 (Very bad Hazardous) | 140 (Very bad Hazardous) | 191 (Very bad Hazardous) | 162 (Very bad Hazardous) | 117 (Very bad Hazardous) | 36 (Unhealthy for Sensitive Groups) | 32 (Moderate) | 46 (Unhealthy for Sensitive Groups) | 62 (Unhealthy) | 198 (Very bad Hazardous) | 249 (Very bad Hazardous) |
| pm10 | 118 (Very Unhealthy) | 145 (Very Unhealthy) | 111 (Very Unhealthy) | 205 (Very bad Hazardous) | 200 (Very bad Hazardous) | 275 (Very bad Hazardous) | 269 (Very bad Hazardous) | 206 (Very bad Hazardous) | 71 (Unhealthy for Sensitive Groups) | 57 (Unhealthy for Sensitive Groups) | 131 (Very Unhealthy) | 178 (Very bad Hazardous) | 311 (Very bad Hazardous) | 348 (Very bad Hazardous) |
| no2 | 21 (Good) | 28 (Good) | 35 (Good) | 48 (Moderate) | 38 (Good) | 72 (Moderate) | 65 (Moderate) | 53 (Moderate) | 34 (Good) | 41 (Moderate) | 40 (Good) | 43 (Moderate) | 96 (Moderate) | 91 (Moderate) |
| so2 | 18 (Good) | 16 (Good) | 14 (Good) | 16 (Good) | 12 (Good) | 14 (Good) | 19 (Good) | 16 (Good) | 12 (Good) | 11 (Good) | 14 (Good) | 11 (Good) | 30 (Good) | 21 (Good) |
| co | 796 (Good) | 824 (Good) | 810 (Good) | 1 (Good) | 1 (Good) | 1 (Good) | 499 (Good) | 1 (Good) | 728 (Good) | 908 (Good) | 773 (Good) | 787 (Good) | 1 (Good) | 1 (Good) |
| o3 | 70 (Moderate) | 43 (Good) | 26 (Good) | 29 (Good) | 17 (Good) | 26 (Good) | 26 (Good) | 41 (Good) | 29 (Good) | 24 (Good) | 31 (Good) | 40 (Good) | 31 (Good) | 21 (Good) |
PM2,5 290 (Very bad Hazardous)
particulate matter (PM2.5) dustPM10 449 (Very bad Hazardous)
particulate matter (PM10) suspended dustNO2 45 (Moderate)
nitrogen dioxide (NO2)CO 1300 (Good)
carbon monoxide (CO)O3 7.5 (Good)
ozone (O3)Alipur, Delhi - DPCC
| index | 2022-10-31 |
|---|---|
| pm25 | 290 |
| pm10 | 449 |
| no2 | 45 |
| co | 1300 |
| o3 | 7.5 |
Alipur, Delhi - DPCC
| index | 2020-05 | 2020-04 | 2020-03 | 2020-02 | 2020-01 | 2019-12 | 2019-11 | 2019-10 | 2019-09 | 2019-08 | 2019-07 | 2019-06 | 2019-02 | 2018-12 |
|---|---|---|---|---|---|---|---|---|---|---|---|---|---|---|
| pm25 | 52 | 54 | 55 | 124 | 140 | 191 | 162 | 117 | 36 | 32 | 46 | 62 | 198 | 249 |
| pm10 | 118 | 145 | 111 | 205 | 200 | 275 | 269 | 206 | 71 | 57 | 131 | 178 | 311 | 348 |
| no2 | 21 | 28 | 35 | 48 | 38 | 72 | 65 | 53 | 34 | 41 | 40 | 43 | 96 | 91 |
| so2 | 18 | 16 | 14 | 16 | 12 | 14 | 19 | 16 | 12 | 11 | 14 | 11 | 30 | 21 |
| co | 796 | 824 | 810 | 1 | 1 | 1 | 499 | 1 | 728 | 908 | 773 | 787 | 1 | 1 |
| o3 | 70 | 43 | 26 | 29 | 17 | 26 | 26 | 41 | 29 | 24 | 31 | 40 | 31 | 21 |