Air Pollution in Pūth Khurd: Real-time Air Quality Index and smog alert.
Pollution and air quality forecast for Pūth Khurd. Today is Wednesday, May 13, 2026. The following air pollution values have been recorded for Pūth Khurd:- particulate matter (PM2.5) dust - 296 (Very bad Hazardous)
- particulate matter (PM10) suspended dust - 493 (Very bad Hazardous)
- nitrogen dioxide (NO2) - 23 (Good)
- carbon monoxide (CO) - 1300 (Good)
- ozone (O3) - 5 (Good)

What is the air quality in Pūth Khurd today? Is the air polluted in Pūth Khurd?. Is there smog?
What is the current level of PM2.5 in Pūth Khurd? (particulate matter (PM2.5) dust)
Today's PM2.5 level is:
296 (Very bad Hazardous)
For comparison, the highest level of PM2.5 in Pūth Khurd in the last 7 days was: 296 (Monday, October 31, 2022) and the lowest: 296 (Monday, October 31, 2022).
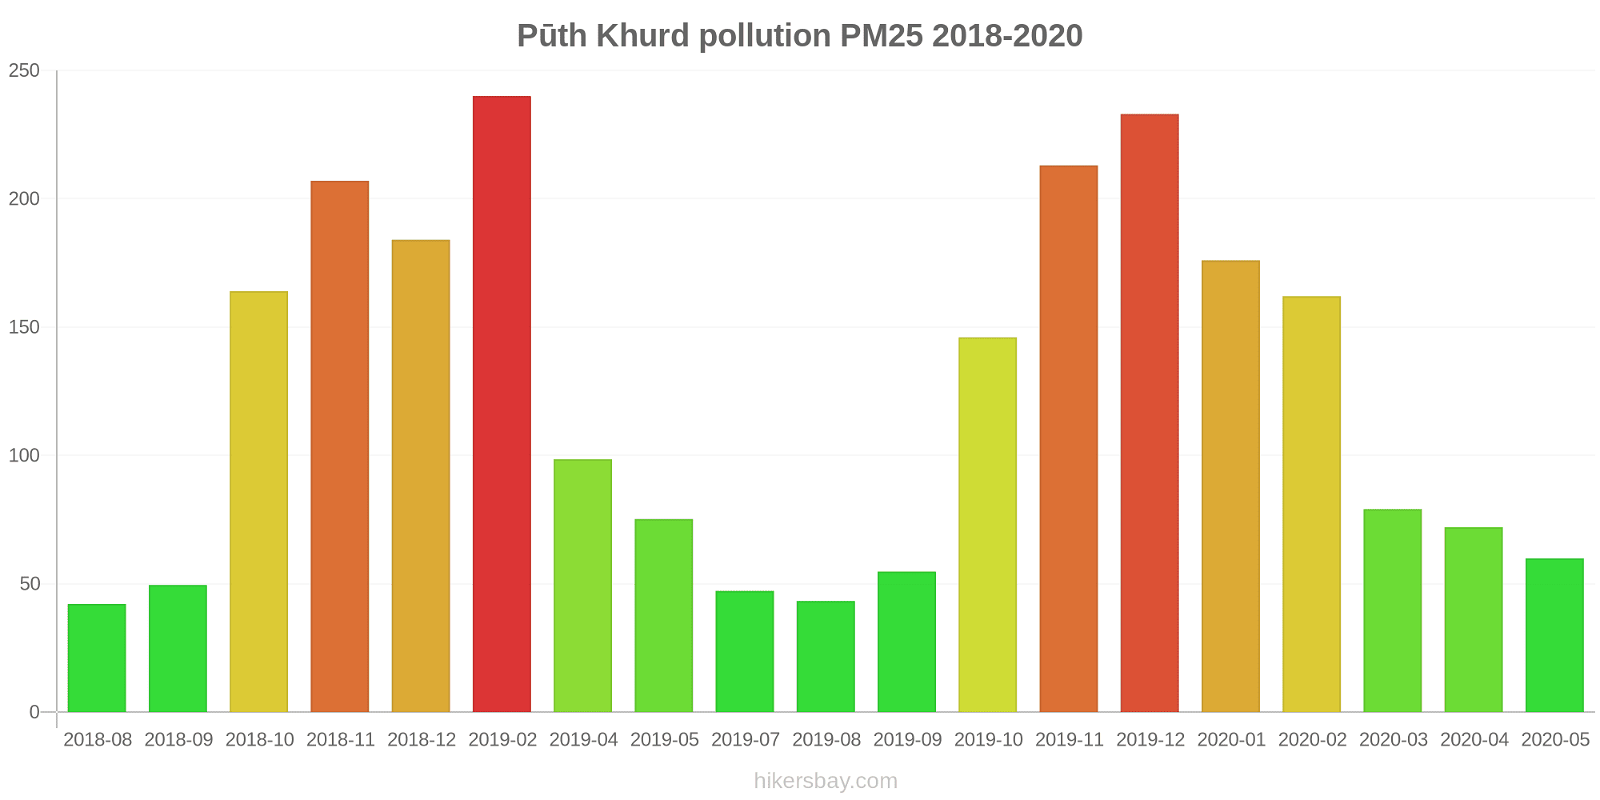
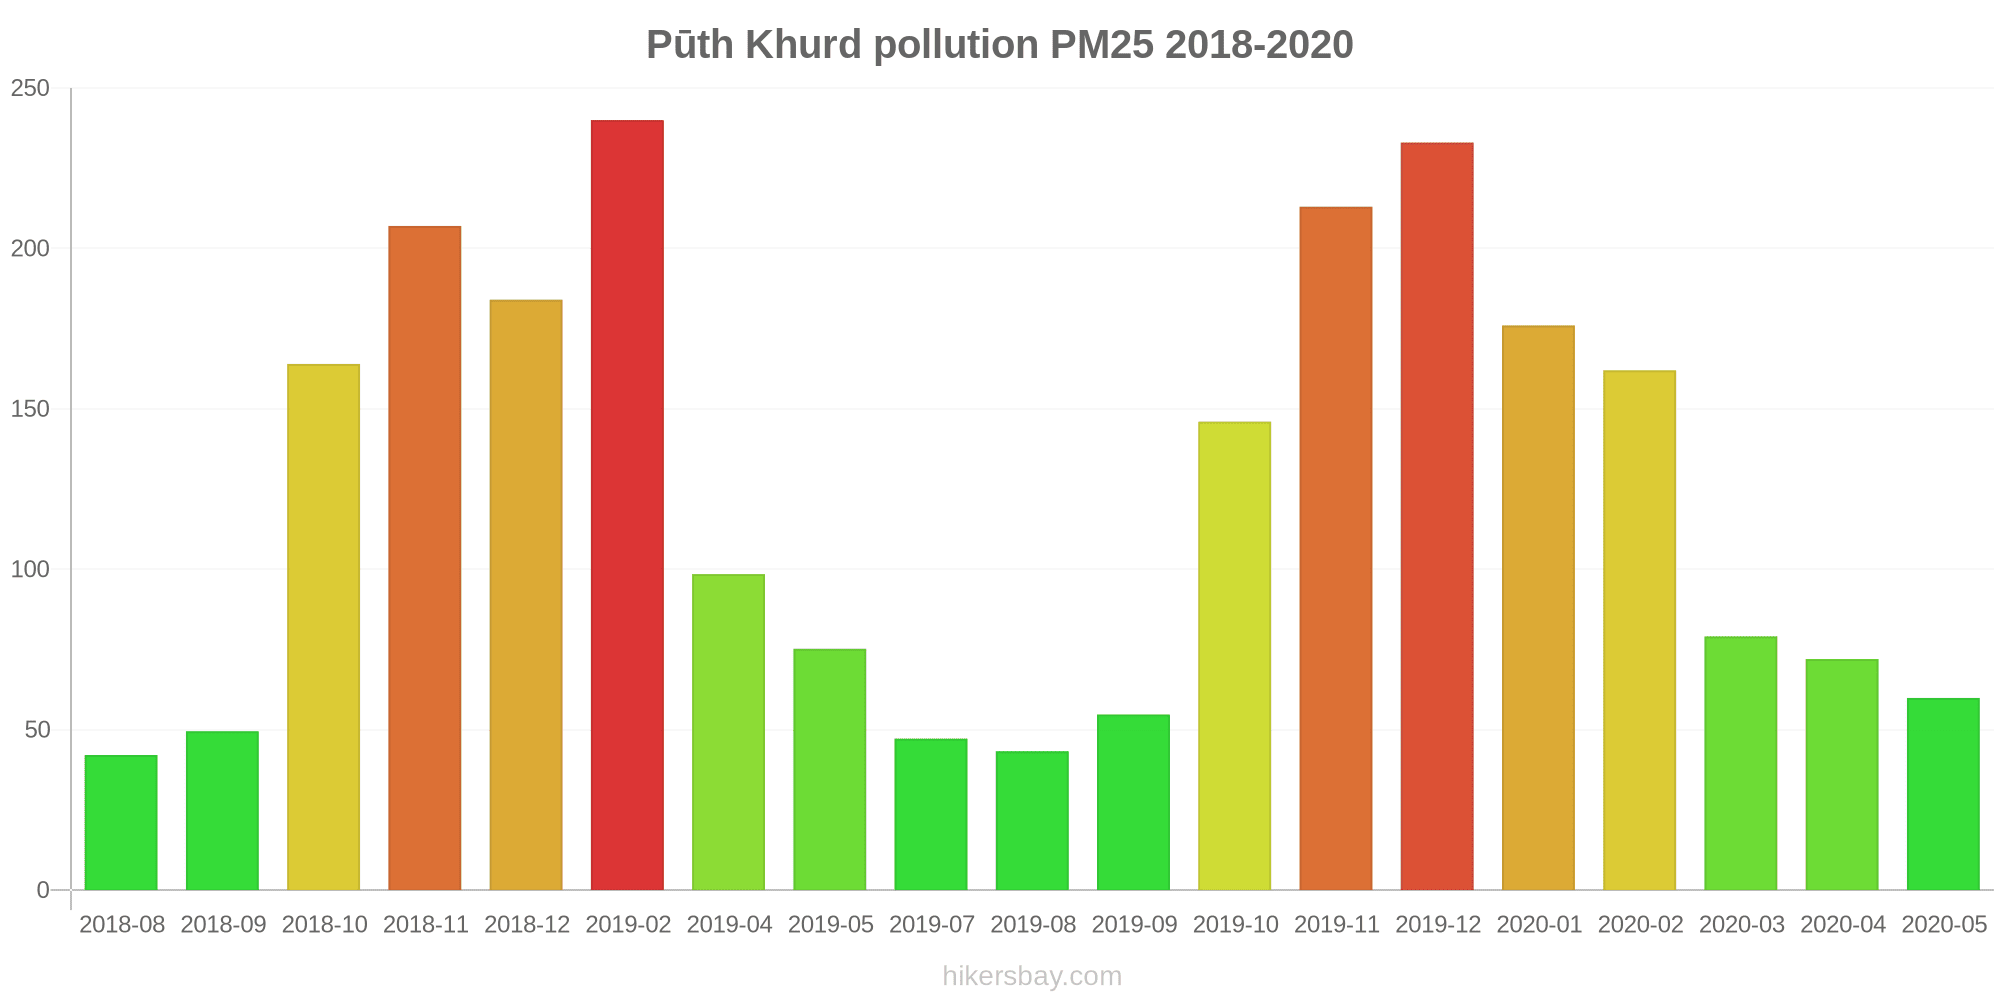
The highest PM2.5 values were recorded: 240 (February 2019).
The lowest level of particulate matter PM2.5 pollution occurs in month: August (42).
What is the level of PM10 today in Pūth Khurd? (particulate matter (PM10) suspended dust)
The current level of particulate matter PM10 in Pūth Khurd is:
493 (Very bad Hazardous)
The highest PM10 values usually occur in month: 479 (December 2018).
The lowest value of particulate matter PM10 pollution in Pūth Khurd is usually recorded in: August (84).
How high is the level of NO2? (nitrogen dioxide (NO2))
23 (Good)
How high is the CO level? (carbon monoxide (CO))
1300 (Good)
How is the O3 level today in Pūth Khurd? (ozone (O3))
5 (Good)
Current data Monday, October 31, 2022, 12:45 AM
PM2,5 296 (Very bad Hazardous)
PM10 493 (Very bad Hazardous)
NO2 23 (Good)
CO 1300 (Good)
O3 5 (Good)
Data on air pollution from recent days in Pūth Khurd
index
2022-10-31
pm25
296
Very bad Hazardous
pm10
493
Very bad Hazardous
no2
23
Good
co
1300
Good
o3
5
Good
data source »
Air pollution in Pūth Khurd from August 2018 to May 2020
index
2020-05
2020-04
2020-03
2020-02
2020-01
2019-12
2019-11
2019-10
2019-09
2019-08
2019-07
2019-05
2019-04
2019-02
2018-12
2018-11
2018-10
2018-09
2018-08
pm25
60 (Unhealthy)
72 (Unhealthy)
79 (Very Unhealthy)
162 (Very bad Hazardous)
176 (Very bad Hazardous)
233 (Very bad Hazardous)
213 (Very bad Hazardous)
146 (Very bad Hazardous)
55 (Unhealthy for Sensitive Groups)
43 (Unhealthy for Sensitive Groups)
47 (Unhealthy for Sensitive Groups)
75 (Very Unhealthy)
99 (Very Unhealthy)
240 (Very bad Hazardous)
184 (Very bad Hazardous)
207 (Very bad Hazardous)
164 (Very bad Hazardous)
50 (Unhealthy for Sensitive Groups)
42 (Unhealthy for Sensitive Groups)
pm10
146 (Very Unhealthy)
167 (Very bad Hazardous)
152 (Very bad Hazardous)
271 (Very bad Hazardous)
253 (Very bad Hazardous)
343 (Very bad Hazardous)
412 (Very bad Hazardous)
258 (Very bad Hazardous)
113 (Very Unhealthy)
84 (Unhealthy)
141 (Very Unhealthy)
253 (Very bad Hazardous)
359 (Very bad Hazardous)
390 (Very bad Hazardous)
479 (Very bad Hazardous)
400 (Very bad Hazardous)
380 (Very bad Hazardous)
113 (Very Unhealthy)
102 (Unhealthy)
co
404 (Good)
511 (Good)
772 (Good)
1 (Good)
1 (Good)
1 (Good)
1 (Good)
1 (Good)
1 (Good)
1 (Good)
1 (Good)
809 (Good)
878 (Good)
1 (Good)
1 (Good)
1 (Good)
1 (Good)
947 (Good)
919 (Good)
o3
94 (Moderate)
66 (Good)
48 (Good)
52 (Good)
28 (Good)
30 (Good)
49 (Good)
61 (Good)
47 (Good)
20 (Good)
44 (Good)
91 (Moderate)
74 (Moderate)
49 (Good)
25 (Good)
46 (Good)
64 (Good)
35 (Good)
27 (Good)
no2
20 (Good)
20 (Good)
28 (Good)
41 (Moderate)
41 (Moderate)
50 (Moderate)
60 (Moderate)
59 (Moderate)
73 (Moderate)
62 (Moderate)
23 (Good)
32 (Good)
42 (Moderate)
75 (Moderate)
50 (Moderate)
56 (Moderate)
27 (Good)
8.7 (Good)
9.1 (Good)
data source »
Bawana, Delhi - DPCC
Monday, October 31, 2022, 12:45 AM
PM2,5 296 (Very bad Hazardous)
particulate matter (PM2.5) dust
PM10 493 (Very bad Hazardous)
particulate matter (PM10) suspended dust
NO2 23 (Good)
nitrogen dioxide (NO2)
CO 1300 (Good)
carbon monoxide (CO)
O3 4.6 (Good)
ozone (O3)
Bawana, Delhi - DPCC
index
2022-10-31
pm25
296
pm10
493
no2
23
co
1300
o3
4.6
Bawana, Delhi - DPCC
2018-08 2020-05

index
2020-05
2020-04
2020-03
2020-02
2020-01
2019-12
2019-11
2019-10
2019-09
2019-08
2019-07
2019-05
2019-04
2019-02
2018-12
2018-11
2018-10
2018-09
2018-08
pm25
60
72
79
162
176
233
213
146
55
43
47
75
99
240
184
207
164
50
42
pm10
146
167
152
271
253
343
412
258
113
84
141
253
359
390
479
400
380
113
102
no2
20
20
28
41
41
50
60
59
73
62
23
32
42
75
50
56
27
8.7
9.1
co
404
511
772
1
1
1
1
1
1
1
1
809
878
1
1
1
1
947
919
o3
94
66
48
52
28
30
49
61
47
20
44
91
74
49
25
46
64
35
27
* Pollution data source:
https://openaq.org
(caaqm)
The data is licensed under CC-By 4.0
PM2,5 296 (Very bad Hazardous)
PM10 493 (Very bad Hazardous)
NO2 23 (Good)
CO 1300 (Good)
O3 5 (Good)
Data on air pollution from recent days in Pūth Khurd
| index | 2022-10-31 |
|---|---|
| pm25 | 296 Very bad Hazardous |
| pm10 | 493 Very bad Hazardous |
| no2 | 23 Good |
| co | 1300 Good |
| o3 | 5 Good |
| index | 2020-05 | 2020-04 | 2020-03 | 2020-02 | 2020-01 | 2019-12 | 2019-11 | 2019-10 | 2019-09 | 2019-08 | 2019-07 | 2019-05 | 2019-04 | 2019-02 | 2018-12 | 2018-11 | 2018-10 | 2018-09 | 2018-08 |
|---|---|---|---|---|---|---|---|---|---|---|---|---|---|---|---|---|---|---|---|
| pm25 | 60 (Unhealthy) | 72 (Unhealthy) | 79 (Very Unhealthy) | 162 (Very bad Hazardous) | 176 (Very bad Hazardous) | 233 (Very bad Hazardous) | 213 (Very bad Hazardous) | 146 (Very bad Hazardous) | 55 (Unhealthy for Sensitive Groups) | 43 (Unhealthy for Sensitive Groups) | 47 (Unhealthy for Sensitive Groups) | 75 (Very Unhealthy) | 99 (Very Unhealthy) | 240 (Very bad Hazardous) | 184 (Very bad Hazardous) | 207 (Very bad Hazardous) | 164 (Very bad Hazardous) | 50 (Unhealthy for Sensitive Groups) | 42 (Unhealthy for Sensitive Groups) |
| pm10 | 146 (Very Unhealthy) | 167 (Very bad Hazardous) | 152 (Very bad Hazardous) | 271 (Very bad Hazardous) | 253 (Very bad Hazardous) | 343 (Very bad Hazardous) | 412 (Very bad Hazardous) | 258 (Very bad Hazardous) | 113 (Very Unhealthy) | 84 (Unhealthy) | 141 (Very Unhealthy) | 253 (Very bad Hazardous) | 359 (Very bad Hazardous) | 390 (Very bad Hazardous) | 479 (Very bad Hazardous) | 400 (Very bad Hazardous) | 380 (Very bad Hazardous) | 113 (Very Unhealthy) | 102 (Unhealthy) |
| co | 404 (Good) | 511 (Good) | 772 (Good) | 1 (Good) | 1 (Good) | 1 (Good) | 1 (Good) | 1 (Good) | 1 (Good) | 1 (Good) | 1 (Good) | 809 (Good) | 878 (Good) | 1 (Good) | 1 (Good) | 1 (Good) | 1 (Good) | 947 (Good) | 919 (Good) |
| o3 | 94 (Moderate) | 66 (Good) | 48 (Good) | 52 (Good) | 28 (Good) | 30 (Good) | 49 (Good) | 61 (Good) | 47 (Good) | 20 (Good) | 44 (Good) | 91 (Moderate) | 74 (Moderate) | 49 (Good) | 25 (Good) | 46 (Good) | 64 (Good) | 35 (Good) | 27 (Good) |
| no2 | 20 (Good) | 20 (Good) | 28 (Good) | 41 (Moderate) | 41 (Moderate) | 50 (Moderate) | 60 (Moderate) | 59 (Moderate) | 73 (Moderate) | 62 (Moderate) | 23 (Good) | 32 (Good) | 42 (Moderate) | 75 (Moderate) | 50 (Moderate) | 56 (Moderate) | 27 (Good) | 8.7 (Good) | 9.1 (Good) |
PM2,5 296 (Very bad Hazardous)
particulate matter (PM2.5) dustPM10 493 (Very bad Hazardous)
particulate matter (PM10) suspended dustNO2 23 (Good)
nitrogen dioxide (NO2)CO 1300 (Good)
carbon monoxide (CO)O3 4.6 (Good)
ozone (O3)Bawana, Delhi - DPCC
| index | 2022-10-31 |
|---|---|
| pm25 | 296 |
| pm10 | 493 |
| no2 | 23 |
| co | 1300 |
| o3 | 4.6 |
Bawana, Delhi - DPCC

| index | 2020-05 | 2020-04 | 2020-03 | 2020-02 | 2020-01 | 2019-12 | 2019-11 | 2019-10 | 2019-09 | 2019-08 | 2019-07 | 2019-05 | 2019-04 | 2019-02 | 2018-12 | 2018-11 | 2018-10 | 2018-09 | 2018-08 |
|---|---|---|---|---|---|---|---|---|---|---|---|---|---|---|---|---|---|---|---|
| pm25 | 60 | 72 | 79 | 162 | 176 | 233 | 213 | 146 | 55 | 43 | 47 | 75 | 99 | 240 | 184 | 207 | 164 | 50 | 42 |
| pm10 | 146 | 167 | 152 | 271 | 253 | 343 | 412 | 258 | 113 | 84 | 141 | 253 | 359 | 390 | 479 | 400 | 380 | 113 | 102 |
| no2 | 20 | 20 | 28 | 41 | 41 | 50 | 60 | 59 | 73 | 62 | 23 | 32 | 42 | 75 | 50 | 56 | 27 | 8.7 | 9.1 |
| co | 404 | 511 | 772 | 1 | 1 | 1 | 1 | 1 | 1 | 1 | 1 | 809 | 878 | 1 | 1 | 1 | 1 | 947 | 919 |
| o3 | 94 | 66 | 48 | 52 | 28 | 30 | 49 | 61 | 47 | 20 | 44 | 91 | 74 | 49 | 25 | 46 | 64 | 35 | 27 |