Air Pollution in Landkreis Neustadt an der Aisch-Bad Windsheim: Real-time Air Quality Index and smog alert.
Pollution and air quality forecast for Landkreis Neustadt an der Aisch-Bad Windsheim. Today is Sunday, June 21, 2026. The following air pollution values have been recorded for Landkreis Neustadt an der Aisch-Bad Windsheim:- particulate matter (PM2.5) dust - 19 (Moderate)
- ozone (O3) - 35 (Good)
- nitrogen dioxide (NO2) - 19 (Good)

What is the air quality in Landkreis Neustadt an der Aisch-Bad Windsheim today? Is the air polluted in Landkreis Neustadt an der Aisch-Bad Windsheim?. Is there smog?
What is the current level of PM2.5 in Landkreis Neustadt an der Aisch-Bad Windsheim? (particulate matter (PM2.5) dust)
Today's PM2.5 level is:
19 (Moderate)
For comparison, the highest level of PM2.5 in Landkreis Neustadt an der Aisch-Bad Windsheim in the last 7 days was: 31 (Thursday, January 11, 2024) and the lowest: 8 (Tuesday, January 16, 2024).
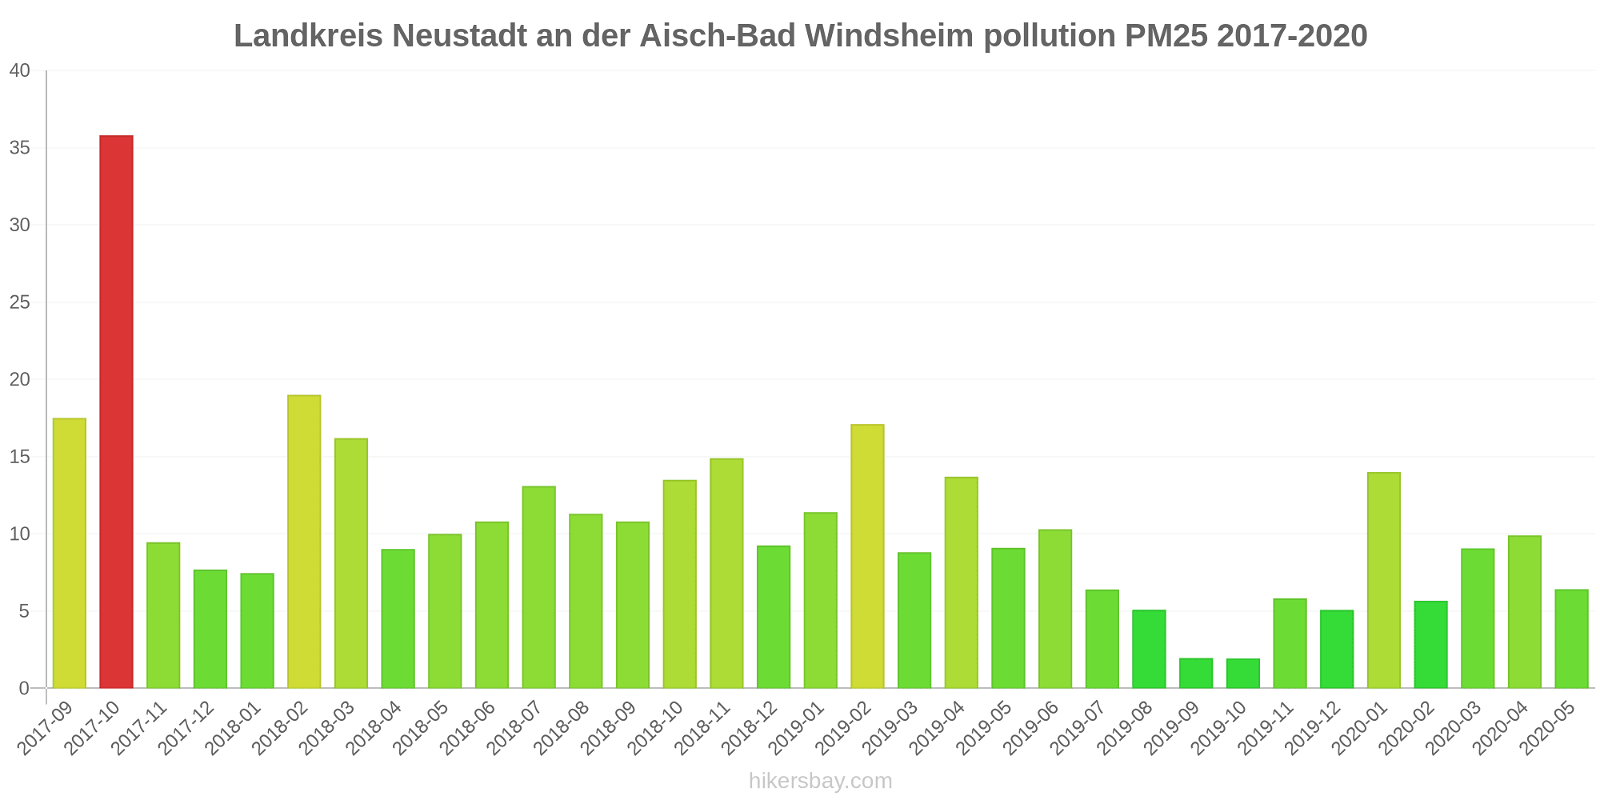
The highest PM2.5 values were recorded: 36 (October 2017).
The lowest level of particulate matter PM2.5 pollution occurs in month: October (1.9).
How is the O3 level today in Landkreis Neustadt an der Aisch-Bad Windsheim? (ozone (O3))
35 (Good)
How high is the level of NO2? (nitrogen dioxide (NO2))
19 (Good)
Current data Wednesday, January 17, 2024, 9:00 AM
PM2,5 19 (Moderate)
O3 35 (Good)
2 (Good)
NO2 19 (Good)
Data on air pollution from recent days in Landkreis Neustadt an der Aisch-Bad Windsheim
index
2024-01-10
2024-01-11
2024-01-12
2024-01-13
2024-01-14
2024-01-15
2024-01-16
2024-01-17
no
2
Good
4
Good
2
Good
1
Good
1
Good
2
Good
1
Good
1
Good
no2
17
Good
28
Good
16
Good
10
Good
12
Good
10
Good
11
Good
23
Good
pm25
22
Moderate
31
Moderate
16
Moderate
10
Good
20
Moderate
11
Good
8
Good
18
Moderate
o3
30
Good
20
Good
36
Good
43
Good
37
Good
46
Good
54
Good
31
Good
data source »
Air pollution in Landkreis Neustadt an der Aisch-Bad Windsheim from September 2017 to May 2020
index
2020-05
2020-04
2020-03
2020-02
2020-01
2019-12
2019-11
2019-10
2019-09
2019-08
2019-07
2019-06
2019-05
2019-04
2019-03
2019-02
2019-01
2018-12
2018-11
2018-10
2018-09
2018-08
2018-07
2018-06
2018-05
2018-04
2018-03
2018-02
2018-01
2017-12
2017-11
2017-10
2017-09
o3
60 (Good)
73 (Moderate)
61 (Good)
61 (Good)
32 (Good)
19 (Good)
15 (Good)
13 (Good)
17 (Good)
32 (Good)
48 (Good)
61 (Good)
62 (Good)
66 (Good)
60 (Good)
33 (Good)
47 (Good)
35 (Good)
19 (Good)
33 (Good)
51 (Good)
69 (Good)
70 (Good)
60 (Good)
58 (Good)
74 (Moderate)
63 (Good)
45 (Good)
46 (Good)
42 (Good)
36 (Good)
44 (Good)
30 (Good)
pm25
6.4 (Good)
9.9 (Good)
9.1 (Good)
5.7 (Good)
14 (Moderate)
5.1 (Good)
5.8 (Good)
1.9 (Good)
2 (Good)
5.1 (Good)
6.4 (Good)
10 (Good)
9.1 (Good)
14 (Moderate)
8.8 (Good)
17 (Moderate)
11 (Good)
9.3 (Good)
15 (Moderate)
14 (Moderate)
11 (Good)
11 (Good)
13 (Moderate)
11 (Good)
10 (Good)
9 (Good)
16 (Moderate)
19 (Moderate)
7.5 (Good)
7.7 (Good)
9.5 (Good)
36 (Unhealthy for Sensitive Groups)
18 (Moderate)
no2
8.9 (Good)
10 (Good)
7.9 (Good)
7.8 (Good)
17 (Good)
9.2 (Good)
8.3 (Good)
3.2 (Good)
3 (Good)
5.6 (Good)
5.1 (Good)
8.5 (Good)
8.5 (Good)
11 (Good)
12 (Good)
24 (Good)
13 (Good)
14 (Good)
19 (Good)
16 (Good)
15 (Good)
10 (Good)
9.8 (Good)
8.2 (Good)
10 (Good)
11 (Good)
14 (Good)
17 (Good)
13 (Good)
14 (Good)
14 (Good)
11 (Good)
14 (Good)
data source »
Burgbernheim/Grüne Au
Wednesday, January 17, 2024, 9:00 AM
PM2,5 19 (Moderate)
particulate matter (PM2.5) dust
O3 35 (Good)
ozone (O3)
1.9 (Good)
index_name_no
NO2 19 (Good)
nitrogen dioxide (NO2)
Burgbernheim/Grüne Au
index
2024-01-17
2024-01-16
2024-01-15
2024-01-14
2024-01-13
2024-01-12
2024-01-11
2024-01-10
no
0.93
1.2
1.5
1.4
1.4
1.7
4.5
1.8
no2
23
11
9.8
12
9.9
16
28
17
pm25
18
8
11
20
10
16
31
22
o3
31
54
46
37
43
36
20
30
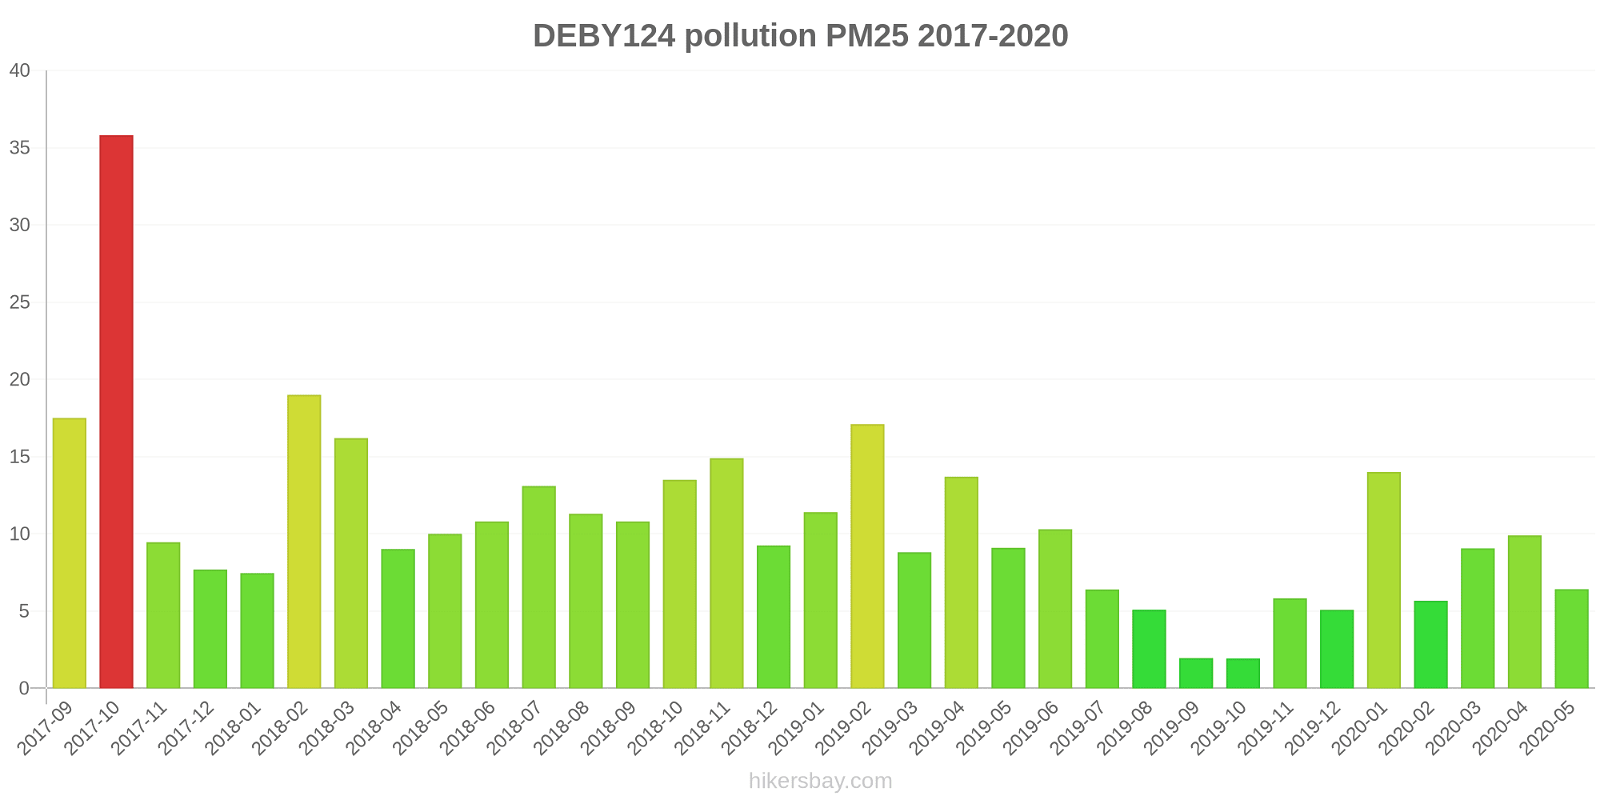
DEBY124
2017-09 2020-05
index
2020-05
2020-04
2020-03
2020-02
2020-01
2019-12
2019-11
2019-10
2019-09
2019-08
2019-07
2019-06
2019-05
2019-04
2019-03
2019-02
2019-01
2018-12
2018-11
2018-10
2018-09
2018-08
2018-07
2018-06
2018-05
2018-04
2018-03
2018-02
2018-01
2017-12
2017-11
2017-10
2017-09
pm25
6.4
9.9
9.1
5.7
14
5.1
5.8
1.9
2
5.1
6.4
10
9.1
14
8.8
17
11
9.3
15
14
11
11
13
11
10
9
16
19
7.5
7.7
9.5
36
18
no2
8.9
10
7.9
7.8
17
9.2
8.3
3.2
3
5.6
5.1
8.5
8.5
11
12
24
13
14
19
16
15
10
9.8
8.2
10
11
14
17
13
14
14
11
14
o3
60
73
61
61
32
19
15
13
17
32
48
61
62
66
60
33
47
35
19
33
51
69
70
60
58
74
63
45
46
42
36
44
30
* Pollution data source:
https://openaq.org
(EEA Germany)
The data is licensed under CC-By 4.0
PM2,5 19 (Moderate)
O3 35 (Good)
2 (Good)
NO2 19 (Good)
Data on air pollution from recent days in Landkreis Neustadt an der Aisch-Bad Windsheim
| index | 2024-01-10 | 2024-01-11 | 2024-01-12 | 2024-01-13 | 2024-01-14 | 2024-01-15 | 2024-01-16 | 2024-01-17 |
|---|---|---|---|---|---|---|---|---|
| no | 2 Good |
4 Good |
2 Good |
1 Good |
1 Good |
2 Good |
1 Good |
1 Good |
| no2 | 17 Good |
28 Good |
16 Good |
10 Good |
12 Good |
10 Good |
11 Good |
23 Good |
| pm25 | 22 Moderate |
31 Moderate |
16 Moderate |
10 Good |
20 Moderate |
11 Good |
8 Good |
18 Moderate |
| o3 | 30 Good |
20 Good |
36 Good |
43 Good |
37 Good |
46 Good |
54 Good |
31 Good |

| index | 2020-05 | 2020-04 | 2020-03 | 2020-02 | 2020-01 | 2019-12 | 2019-11 | 2019-10 | 2019-09 | 2019-08 | 2019-07 | 2019-06 | 2019-05 | 2019-04 | 2019-03 | 2019-02 | 2019-01 | 2018-12 | 2018-11 | 2018-10 | 2018-09 | 2018-08 | 2018-07 | 2018-06 | 2018-05 | 2018-04 | 2018-03 | 2018-02 | 2018-01 | 2017-12 | 2017-11 | 2017-10 | 2017-09 |
|---|---|---|---|---|---|---|---|---|---|---|---|---|---|---|---|---|---|---|---|---|---|---|---|---|---|---|---|---|---|---|---|---|---|
| o3 | 60 (Good) | 73 (Moderate) | 61 (Good) | 61 (Good) | 32 (Good) | 19 (Good) | 15 (Good) | 13 (Good) | 17 (Good) | 32 (Good) | 48 (Good) | 61 (Good) | 62 (Good) | 66 (Good) | 60 (Good) | 33 (Good) | 47 (Good) | 35 (Good) | 19 (Good) | 33 (Good) | 51 (Good) | 69 (Good) | 70 (Good) | 60 (Good) | 58 (Good) | 74 (Moderate) | 63 (Good) | 45 (Good) | 46 (Good) | 42 (Good) | 36 (Good) | 44 (Good) | 30 (Good) |
| pm25 | 6.4 (Good) | 9.9 (Good) | 9.1 (Good) | 5.7 (Good) | 14 (Moderate) | 5.1 (Good) | 5.8 (Good) | 1.9 (Good) | 2 (Good) | 5.1 (Good) | 6.4 (Good) | 10 (Good) | 9.1 (Good) | 14 (Moderate) | 8.8 (Good) | 17 (Moderate) | 11 (Good) | 9.3 (Good) | 15 (Moderate) | 14 (Moderate) | 11 (Good) | 11 (Good) | 13 (Moderate) | 11 (Good) | 10 (Good) | 9 (Good) | 16 (Moderate) | 19 (Moderate) | 7.5 (Good) | 7.7 (Good) | 9.5 (Good) | 36 (Unhealthy for Sensitive Groups) | 18 (Moderate) |
| no2 | 8.9 (Good) | 10 (Good) | 7.9 (Good) | 7.8 (Good) | 17 (Good) | 9.2 (Good) | 8.3 (Good) | 3.2 (Good) | 3 (Good) | 5.6 (Good) | 5.1 (Good) | 8.5 (Good) | 8.5 (Good) | 11 (Good) | 12 (Good) | 24 (Good) | 13 (Good) | 14 (Good) | 19 (Good) | 16 (Good) | 15 (Good) | 10 (Good) | 9.8 (Good) | 8.2 (Good) | 10 (Good) | 11 (Good) | 14 (Good) | 17 (Good) | 13 (Good) | 14 (Good) | 14 (Good) | 11 (Good) | 14 (Good) |
PM2,5 19 (Moderate)
particulate matter (PM2.5) dustO3 35 (Good)
ozone (O3)1.9 (Good)
index_name_noNO2 19 (Good)
nitrogen dioxide (NO2)Burgbernheim/Grüne Au
| index | 2024-01-17 | 2024-01-16 | 2024-01-15 | 2024-01-14 | 2024-01-13 | 2024-01-12 | 2024-01-11 | 2024-01-10 |
|---|---|---|---|---|---|---|---|---|
| no | 0.93 | 1.2 | 1.5 | 1.4 | 1.4 | 1.7 | 4.5 | 1.8 |
| no2 | 23 | 11 | 9.8 | 12 | 9.9 | 16 | 28 | 17 |
| pm25 | 18 | 8 | 11 | 20 | 10 | 16 | 31 | 22 |
| o3 | 31 | 54 | 46 | 37 | 43 | 36 | 20 | 30 |
DEBY124

| index | 2020-05 | 2020-04 | 2020-03 | 2020-02 | 2020-01 | 2019-12 | 2019-11 | 2019-10 | 2019-09 | 2019-08 | 2019-07 | 2019-06 | 2019-05 | 2019-04 | 2019-03 | 2019-02 | 2019-01 | 2018-12 | 2018-11 | 2018-10 | 2018-09 | 2018-08 | 2018-07 | 2018-06 | 2018-05 | 2018-04 | 2018-03 | 2018-02 | 2018-01 | 2017-12 | 2017-11 | 2017-10 | 2017-09 |
|---|---|---|---|---|---|---|---|---|---|---|---|---|---|---|---|---|---|---|---|---|---|---|---|---|---|---|---|---|---|---|---|---|---|
| pm25 | 6.4 | 9.9 | 9.1 | 5.7 | 14 | 5.1 | 5.8 | 1.9 | 2 | 5.1 | 6.4 | 10 | 9.1 | 14 | 8.8 | 17 | 11 | 9.3 | 15 | 14 | 11 | 11 | 13 | 11 | 10 | 9 | 16 | 19 | 7.5 | 7.7 | 9.5 | 36 | 18 |
| no2 | 8.9 | 10 | 7.9 | 7.8 | 17 | 9.2 | 8.3 | 3.2 | 3 | 5.6 | 5.1 | 8.5 | 8.5 | 11 | 12 | 24 | 13 | 14 | 19 | 16 | 15 | 10 | 9.8 | 8.2 | 10 | 11 | 14 | 17 | 13 | 14 | 14 | 11 | 14 |
| o3 | 60 | 73 | 61 | 61 | 32 | 19 | 15 | 13 | 17 | 32 | 48 | 61 | 62 | 66 | 60 | 33 | 47 | 35 | 19 | 33 | 51 | 69 | 70 | 60 | 58 | 74 | 63 | 45 | 46 | 42 | 36 | 44 | 30 |