Air Pollution in Larrey: Real-time Air Quality Index and smog alert.
Pollution and air quality forecast for Larrey. Today is Wednesday, June 24, 2026. The following air pollution values have been recorded for Larrey:- particulate matter (PM2.5) dust - 6 (Good)

What is the air quality in Larrey today? Is the air polluted in Larrey?. Is there smog?
What is the current level of PM2.5 in Larrey? (particulate matter (PM2.5) dust)
Today's PM2.5 level is:
6 (Good)
For comparison, the highest level of PM2.5 in Larrey in the last 7 days was: 11 (Wednesday, December 28, 2022) and the lowest: 6 (Thursday, December 29, 2022).
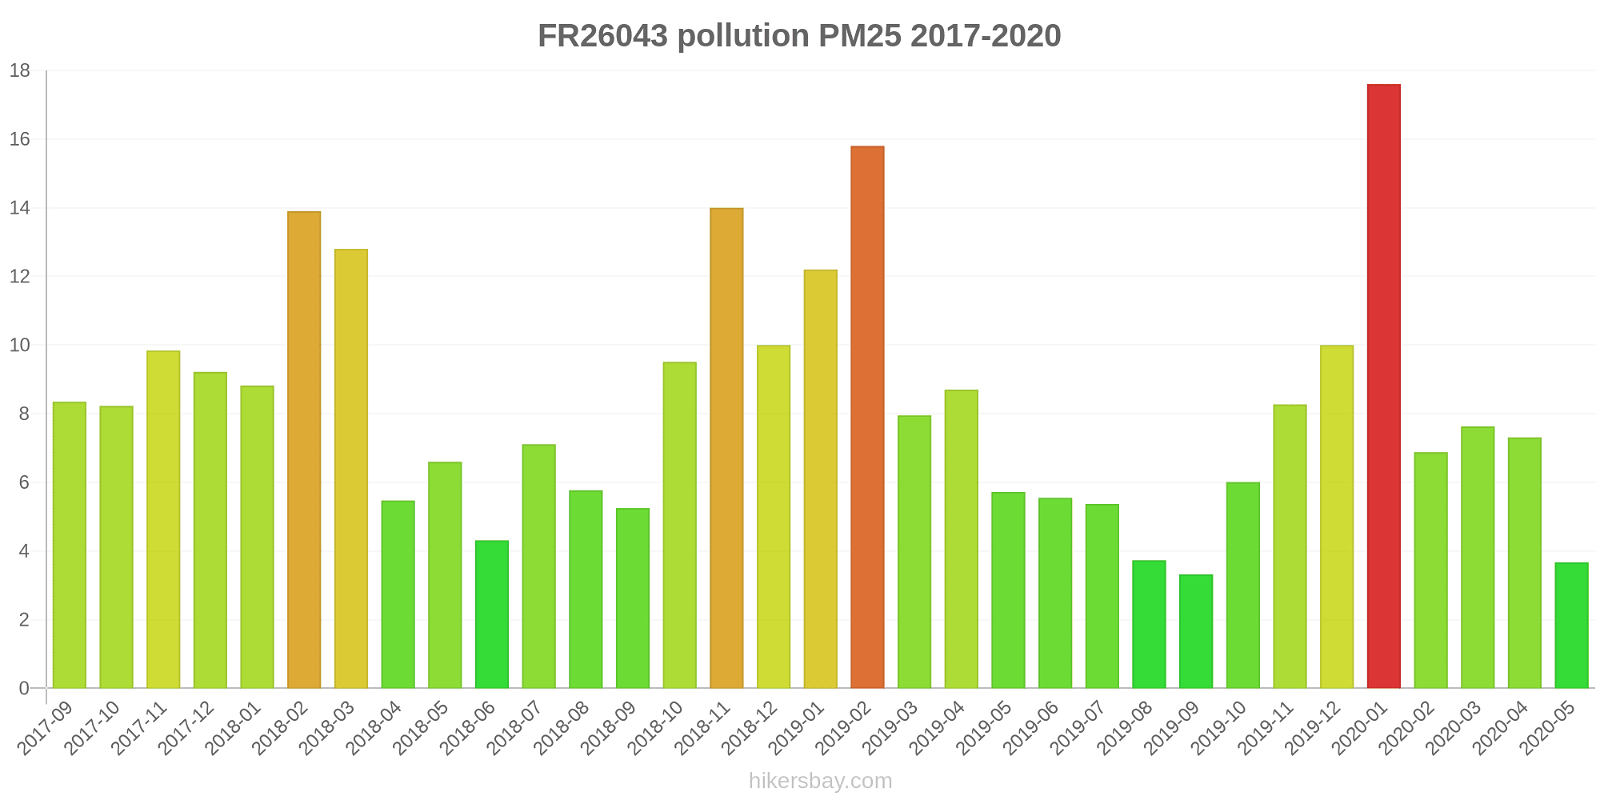
The highest PM2.5 values were recorded: 18 (January 2020).
The lowest level of particulate matter PM2.5 pollution occurs in month: September (3.3).
Current data Sunday, January 1, 2023, 12:00 AM
PM2,5 6 (Good)
Data on air pollution from recent days in Larrey
index
2022-12-28
2022-12-29
2022-12-30
2022-12-31
2023-01-01
pm25
11
Good
6
Good
6
Good
6
Good
6
Good
data source »
Air pollution in Larrey from September 2017 to May 2020

index
2020-05
2020-04
2020-03
2020-02
2020-01
2019-12
2019-11
2019-10
2019-09
2019-08
2019-07
2019-06
2019-05
2019-04
2019-03
2019-02
2019-01
2018-12
2018-11
2018-10
2018-09
2018-08
2018-07
2018-06
2018-05
2018-04
2018-03
2018-02
2018-01
2017-12
2017-11
2017-10
2017-09
no2
5.1 (Good)
7.8 (Good)
16 (Good)
21 (Good)
29 (Good)
24 (Good)
26 (Good)
34 (Good)
15 (Good)
14 (Good)
12 (Good)
13 (Good)
10 (Good)
17 (Good)
20 (Good)
35 (Good)
24 (Good)
27 (Good)
28 (Good)
22 (Good)
22 (Good)
14 (Good)
14 (Good)
9.7 (Good)
12 (Good)
20 (Good)
30 (Good)
23 (Good)
27 (Good)
24 (Good)
27 (Good)
28 (Good)
28 (Good)
pm25
3.7 (Good)
7.3 (Good)
7.6 (Good)
6.9 (Good)
18 (Moderate)
10 (Good)
8.3 (Good)
6 (Good)
3.3 (Good)
3.7 (Good)
5.4 (Good)
5.5 (Good)
5.7 (Good)
8.7 (Good)
8 (Good)
16 (Moderate)
12 (Good)
10 (Good)
14 (Moderate)
9.5 (Good)
5.3 (Good)
5.8 (Good)
7.1 (Good)
4.3 (Good)
6.6 (Good)
5.5 (Good)
13 (Good)
14 (Moderate)
8.8 (Good)
9.2 (Good)
9.8 (Good)
8.2 (Good)
8.3 (Good)
data source »
Quality of life in Larrey
Green and Parks in the City
Larrey
60%
Andorra: 69%
Switzerland: 76%
Luxembourg: 83%
Belgium: 64%
Liechtenstein: 88%
particulate matter PM2.5
Larrey
12 (Good)
Pleasure of spending time in the city
Larrey
75%
Andorra: 84%
Switzerland: 84%
Luxembourg: 85%
Belgium: 64%
Liechtenstein: 94%
particulate matter PM10
Larrey
15 (Good)
Air Pollution
Larrey
28%
Andorra: 29%
Switzerland: 20%
Luxembourg: 19%
Belgium: 45%
Liechtenstein: 6.3%
Garbage Disposal
Larrey
60%
Andorra: 89%
Switzerland: 82%
Luxembourg: 84%
Belgium: 54%
Liechtenstein: 100%
Availability and quality of drinking water
Larrey
65%
Andorra: 100%
Switzerland: 90%
Luxembourg: 83%
Belgium: 70%
Liechtenstein: 100%
Cleanliness and tidiness
Larrey
60%
Andorra: 75%
Switzerland: 82%
Luxembourg: 82%
Belgium: 46%
Liechtenstein: 94%
Noise and Light pollution
Larrey
60%
Andorra: 29%
Switzerland: 38%
Luxembourg: 29%
Belgium: 54%
Liechtenstein: 19%
Water Pollution
Larrey
45%
Andorra: 19%
Switzerland: 19%
Luxembourg: 19%
Belgium: 42%
Liechtenstein: 0%
Source: Numbeo
Dijon-Transvaal
Sunday, January 1, 2023, 12:00 AM
PM2,5 5.6 (Good)
particulate matter (PM2.5) dust
Dijon-Transvaal
index
2023-01-01
2022-12-31
2022-12-30
2022-12-29
2022-12-28
pm25
5.6
5.6
5.9
5.6
11
FR26043
2017-09 2020-05
index
2020-05
2020-04
2020-03
2020-02
2020-01
2019-12
2019-11
2019-10
2019-09
2019-08
2019-07
2019-06
2019-05
2019-04
2019-03
2019-02
2019-01
2018-12
2018-11
2018-10
2018-09
2018-08
2018-07
2018-06
2018-05
2018-04
2018-03
2018-02
2018-01
2017-12
2017-11
2017-10
2017-09
pm25
3.7
7.3
7.6
6.9
18
10
8.3
6
3.3
3.7
5.4
5.5
5.7
8.7
8
16
12
10
14
9.5
5.3
5.8
7.1
4.3
6.6
5.5
13
14
8.8
9.2
9.8
8.2
8.3
no2
5.1
7.8
16
21
29
24
26
34
15
14
12
13
10
17
20
35
24
27
28
22
22
14
14
9.7
12
20
30
23
27
24
27
28
28
* Pollution data source:
https://openaq.org
(EEA France)
The data is licensed under CC-By 4.0
PM2,5 6 (Good)
Data on air pollution from recent days in Larrey
| index | 2022-12-28 | 2022-12-29 | 2022-12-30 | 2022-12-31 | 2023-01-01 |
|---|---|---|---|---|---|
| pm25 | 11 Good |
6 Good |
6 Good |
6 Good |
6 Good |

| index | 2020-05 | 2020-04 | 2020-03 | 2020-02 | 2020-01 | 2019-12 | 2019-11 | 2019-10 | 2019-09 | 2019-08 | 2019-07 | 2019-06 | 2019-05 | 2019-04 | 2019-03 | 2019-02 | 2019-01 | 2018-12 | 2018-11 | 2018-10 | 2018-09 | 2018-08 | 2018-07 | 2018-06 | 2018-05 | 2018-04 | 2018-03 | 2018-02 | 2018-01 | 2017-12 | 2017-11 | 2017-10 | 2017-09 |
|---|---|---|---|---|---|---|---|---|---|---|---|---|---|---|---|---|---|---|---|---|---|---|---|---|---|---|---|---|---|---|---|---|---|
| no2 | 5.1 (Good) | 7.8 (Good) | 16 (Good) | 21 (Good) | 29 (Good) | 24 (Good) | 26 (Good) | 34 (Good) | 15 (Good) | 14 (Good) | 12 (Good) | 13 (Good) | 10 (Good) | 17 (Good) | 20 (Good) | 35 (Good) | 24 (Good) | 27 (Good) | 28 (Good) | 22 (Good) | 22 (Good) | 14 (Good) | 14 (Good) | 9.7 (Good) | 12 (Good) | 20 (Good) | 30 (Good) | 23 (Good) | 27 (Good) | 24 (Good) | 27 (Good) | 28 (Good) | 28 (Good) |
| pm25 | 3.7 (Good) | 7.3 (Good) | 7.6 (Good) | 6.9 (Good) | 18 (Moderate) | 10 (Good) | 8.3 (Good) | 6 (Good) | 3.3 (Good) | 3.7 (Good) | 5.4 (Good) | 5.5 (Good) | 5.7 (Good) | 8.7 (Good) | 8 (Good) | 16 (Moderate) | 12 (Good) | 10 (Good) | 14 (Moderate) | 9.5 (Good) | 5.3 (Good) | 5.8 (Good) | 7.1 (Good) | 4.3 (Good) | 6.6 (Good) | 5.5 (Good) | 13 (Good) | 14 (Moderate) | 8.8 (Good) | 9.2 (Good) | 9.8 (Good) | 8.2 (Good) | 8.3 (Good) |
Green and Parks in the City
Larrey 60%
Andorra: 69% Switzerland: 76% Luxembourg: 83% Belgium: 64% Liechtenstein: 88%particulate matter PM2.5
Larrey 12 (Good)
Pleasure of spending time in the city
Larrey 75%
Andorra: 84% Switzerland: 84% Luxembourg: 85% Belgium: 64% Liechtenstein: 94%particulate matter PM10
Larrey 15 (Good)
Air Pollution
Larrey 28%
Andorra: 29% Switzerland: 20% Luxembourg: 19% Belgium: 45% Liechtenstein: 6.3%Garbage Disposal
Larrey 60%
Andorra: 89% Switzerland: 82% Luxembourg: 84% Belgium: 54% Liechtenstein: 100%Availability and quality of drinking water
Larrey 65%
Andorra: 100% Switzerland: 90% Luxembourg: 83% Belgium: 70% Liechtenstein: 100%Cleanliness and tidiness
Larrey 60%
Andorra: 75% Switzerland: 82% Luxembourg: 82% Belgium: 46% Liechtenstein: 94%Noise and Light pollution
Larrey 60%
Andorra: 29% Switzerland: 38% Luxembourg: 29% Belgium: 54% Liechtenstein: 19%Water Pollution
Larrey 45%
Andorra: 19% Switzerland: 19% Luxembourg: 19% Belgium: 42% Liechtenstein: 0%PM2,5 5.6 (Good)
particulate matter (PM2.5) dustDijon-Transvaal
| index | 2023-01-01 | 2022-12-31 | 2022-12-30 | 2022-12-29 | 2022-12-28 |
|---|---|---|---|---|---|
| pm25 | 5.6 | 5.6 | 5.9 | 5.6 | 11 |
FR26043

| index | 2020-05 | 2020-04 | 2020-03 | 2020-02 | 2020-01 | 2019-12 | 2019-11 | 2019-10 | 2019-09 | 2019-08 | 2019-07 | 2019-06 | 2019-05 | 2019-04 | 2019-03 | 2019-02 | 2019-01 | 2018-12 | 2018-11 | 2018-10 | 2018-09 | 2018-08 | 2018-07 | 2018-06 | 2018-05 | 2018-04 | 2018-03 | 2018-02 | 2018-01 | 2017-12 | 2017-11 | 2017-10 | 2017-09 |
|---|---|---|---|---|---|---|---|---|---|---|---|---|---|---|---|---|---|---|---|---|---|---|---|---|---|---|---|---|---|---|---|---|---|
| pm25 | 3.7 | 7.3 | 7.6 | 6.9 | 18 | 10 | 8.3 | 6 | 3.3 | 3.7 | 5.4 | 5.5 | 5.7 | 8.7 | 8 | 16 | 12 | 10 | 14 | 9.5 | 5.3 | 5.8 | 7.1 | 4.3 | 6.6 | 5.5 | 13 | 14 | 8.8 | 9.2 | 9.8 | 8.2 | 8.3 |
| no2 | 5.1 | 7.8 | 16 | 21 | 29 | 24 | 26 | 34 | 15 | 14 | 12 | 13 | 10 | 17 | 20 | 35 | 24 | 27 | 28 | 22 | 22 | 14 | 14 | 9.7 | 12 | 20 | 30 | 23 | 27 | 24 | 27 | 28 | 28 |