Air Pollution in Pirkanmaa: Real-time Air Quality Index and smog alert.
Pollution and air quality forecast for Pirkanmaa. Today is Thursday, May 14, 2026. The following air pollution values have been recorded for Pirkanmaa:- particulate matter (PM10) suspended dust - 6 (Good)
- nitrogen dioxide (NO2) - 24 (Good)
- ozone (O3) - 41 (Good)
- particulate matter (PM2.5) dust - 4 (Good)

What is the air quality in Pirkanmaa today? Is the air polluted in Pirkanmaa?. Is there smog?
What is the level of PM10 today in Pirkanmaa? (particulate matter (PM10) suspended dust)
The current level of particulate matter PM10 in Pirkanmaa is:
6 (Good)
The highest PM10 values usually occur in month: 31 (April 2018).
The lowest value of particulate matter PM10 pollution in Pirkanmaa is usually recorded in: December (5.2).
How high is the level of NO2? (nitrogen dioxide (NO2))
24 (Good)
How is the O3 level today in Pirkanmaa? (ozone (O3))
41 (Good)
What is the current level of PM2.5 in Pirkanmaa? (particulate matter (PM2.5) dust)
Today's PM2.5 level is:
4 (Good)
For comparison, the highest level of PM2.5 in Pirkanmaa in the last 7 days was: 6 (Tuesday, January 16, 2024) and the lowest: 1 (Wednesday, January 10, 2024).
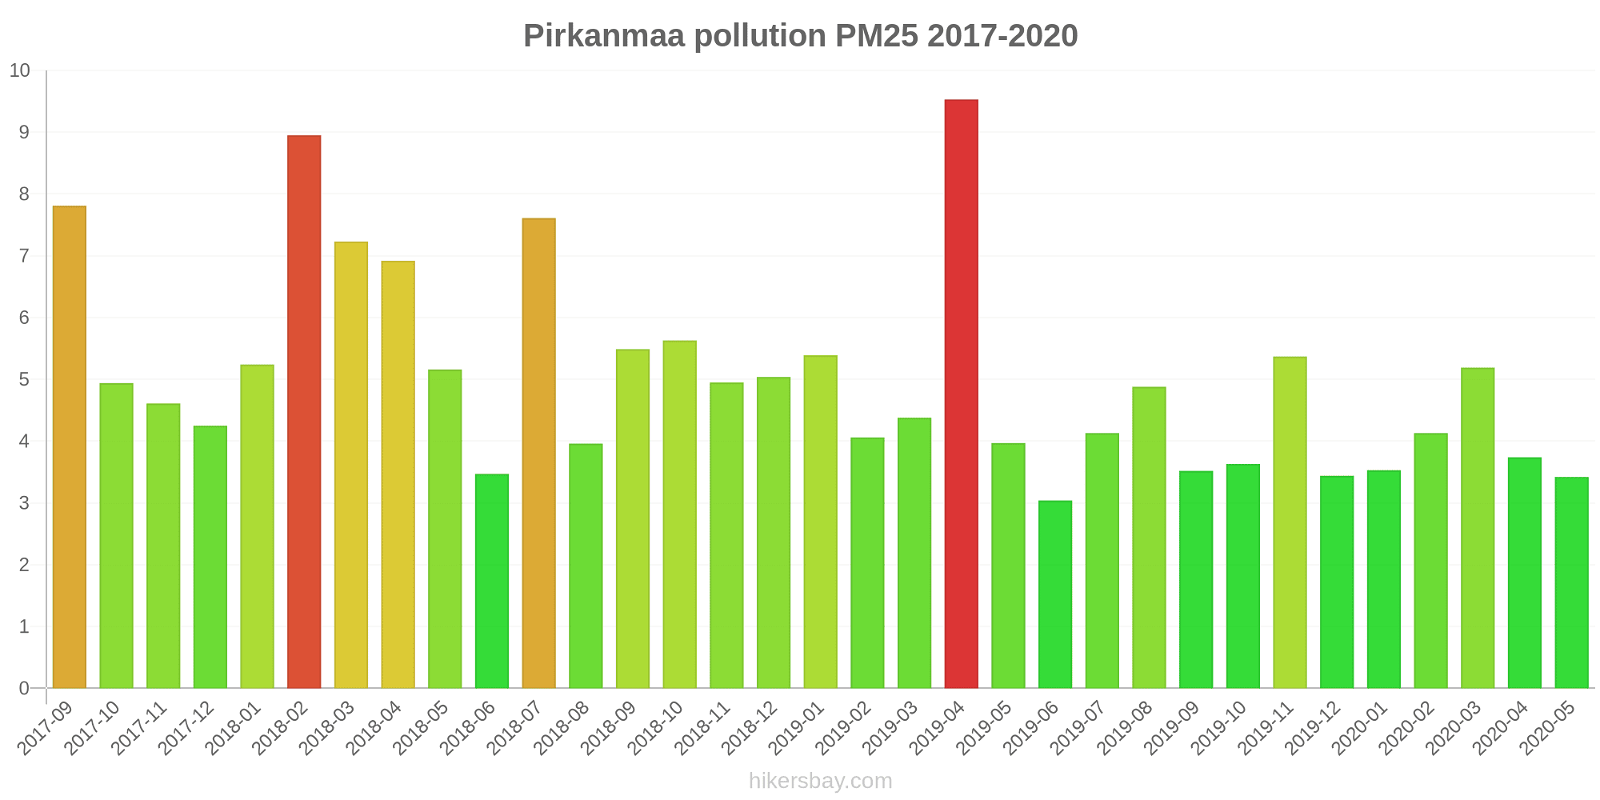
The highest PM2.5 values were recorded: 9.5 (April 2019).
The lowest level of particulate matter PM2.5 pollution occurs in month: June (3).
Current data Wednesday, January 17, 2024, 6:00 AM
PM10 6 (Good)
NO2 24 (Good)
O3 41 (Good)
PM2,5 4 (Good)
Data on air pollution from recent days in Pirkanmaa
index
2024-01-10
2024-01-11
2024-01-12
2024-01-13
2024-01-14
2024-01-15
2024-01-16
2024-01-17
pm10
2
Good
4
Good
5
Good
4
Good
5
Good
3
Good
8
Good
7
Good
no2
10
Good
7
Good
15
Good
7
Good
7
Good
6
Good
19
Good
17
Good
o3
62
Good
66
Good
54
Good
58
Good
49
Good
59
Good
53
Good
44
Good
pm25
1
Good
2
Good
3
Good
3
Good
5
Good
3
Good
6
Good
5
Good
data source »
Air pollution in Pirkanmaa from September 2017 to May 2020
index
2020-05
2020-04
2020-03
2020-02
2020-01
2019-12
2019-11
2019-10
2019-09
2019-08
2019-07
2019-06
2019-05
2019-04
2019-03
2019-02
2019-01
2018-12
2018-11
2018-10
2018-09
2018-08
2018-07
2018-06
2018-05
2018-04
2018-03
2018-02
2018-01
2017-12
2017-11
2017-10
2017-09
no2
7.2 (Good)
7.6 (Good)
10 (Good)
13 (Good)
9.9 (Good)
11 (Good)
13 (Good)
11 (Good)
10 (Good)
9 (Good)
6.8 (Good)
6.9 (Good)
10 (Good)
14 (Good)
12 (Good)
15 (Good)
22 (Good)
15 (Good)
15 (Good)
12 (Good)
10 (Good)
10 (Good)
9.5 (Good)
7.5 (Good)
12 (Good)
18 (Good)
23 (Good)
19 (Good)
11 (Good)
10 (Good)
15 (Good)
14 (Good)
12 (Good)
pm10
10 (Good)
16 (Good)
16 (Good)
14 (Good)
6.3 (Good)
5.2 (Good)
9.7 (Good)
7.3 (Good)
6.8 (Good)
11 (Good)
8.6 (Good)
7 (Good)
10 (Good)
31 (Moderate)
13 (Good)
9.2 (Good)
7.2 (Good)
7.5 (Good)
9.7 (Good)
9 (Good)
9.1 (Good)
7.8 (Good)
12 (Good)
11 (Good)
25 (Moderate)
31 (Moderate)
21 (Moderate)
14 (Good)
6.6 (Good)
5.3 (Good)
6.7 (Good)
8.2 (Good)
13 (Good)
pm25
3.4 (Good)
3.7 (Good)
5.2 (Good)
4.1 (Good)
3.5 (Good)
3.4 (Good)
5.4 (Good)
3.6 (Good)
3.5 (Good)
4.9 (Good)
4.1 (Good)
3 (Good)
4 (Good)
9.5 (Good)
4.4 (Good)
4.1 (Good)
5.4 (Good)
5 (Good)
5 (Good)
5.6 (Good)
5.5 (Good)
4 (Good)
7.6 (Good)
3.5 (Good)
5.2 (Good)
6.9 (Good)
7.2 (Good)
8.9 (Good)
5.2 (Good)
4.3 (Good)
4.6 (Good)
4.9 (Good)
7.8 (Good)
data source »
Quality of life in Pirkanmaa
Green and Parks in the City
Pirkanmaa
79%
Estonia: 82%
Aland Islands: 75%
Sweden: 84%
Latvia: 88%
Lithuania: 86%
particulate matter PM2.5
Pirkanmaa
5 (Good)
Pleasure of spending time in the city
Pirkanmaa
93%
Estonia: 90%
Aland Islands: 92%
Sweden: 88%
Latvia: 82%
Lithuania: 83%
particulate matter PM10
Pirkanmaa
11 (Good)
Air Pollution
Pirkanmaa
13%
Estonia: 12%
Aland Islands: 17%
Sweden: 15%
Latvia: 29%
Lithuania: 26%
Garbage Disposal
Pirkanmaa
88%
Estonia: 79%
Aland Islands: 88%
Sweden: 83%
Latvia: 70%
Lithuania: 71%
Availability and quality of drinking water
Pirkanmaa
95%
Estonia: 90%
Aland Islands: 96%
Sweden: 92%
Latvia: 79%
Lithuania: 91%
Cleanliness and tidiness
Pirkanmaa
84%
Estonia: 82%
Aland Islands: 83%
Sweden: 76%
Latvia: 72%
Lithuania: 78%
Noise and Light pollution
Pirkanmaa
27%
Estonia: 31%
Aland Islands: 46%
Sweden: 26%
Latvia: 37%
Lithuania: 30%
Water Pollution
Pirkanmaa
13%
Estonia: 16%
Aland Islands: 10%
Sweden: 15%
Latvia: 28%
Lithuania: 24%
Source: Numbeo
Pirkankatu
Wednesday, January 17, 2024, 6:00 AM
PM10 5.9 (Good)
particulate matter (PM10) suspended dust
NO2 33 (Good)
nitrogen dioxide (NO2)
FI00621
Wednesday, January 17, 2024, 6:00 AM
O3 49 (Good)
ozone (O3)
NO2 7.5 (Good)
nitrogen dioxide (NO2)
Kaleva
Wednesday, January 17, 2024, 6:00 AM
PM2,5 3.5 (Good)
particulate matter (PM2.5) dust
O3 34 (Good)
ozone (O3)
NO2 30 (Good)
nitrogen dioxide (NO2)
Epila 2
Wednesday, January 17, 2024, 6:00 AM
PM10 5.8 (Good)
particulate matter (PM10) suspended dust
PM2,5 5 (Good)
particulate matter (PM2.5) dust
Pirkankatu
index
2024-01-17
2024-01-16
2024-01-15
2024-01-14
2024-01-13
2024-01-12
2024-01-11
2024-01-10
pm10
6.7
7.2
2.5
5.4
4.7
4.8
3.5
1.7
no2
24
31
8.8
9.1
10
27
15
17
FI00621
index
2024-01-17
2024-01-16
2024-01-15
2024-01-14
2024-01-13
2024-01-12
2024-01-11
2024-01-10
no2
6.3
2.7
2.1
3.6
3
2.7
1.4
1.3
o3
51
62
62
51
60
60
69
67
Kaleva
index
2024-01-17
2024-01-16
2024-01-15
2024-01-14
2024-01-13
2024-01-12
2024-01-11
2024-01-10
pm25
4.8
4.6
2.2
5.2
2.9
2.7
1.4
0.68
o3
37
44
55
46
56
48
64
58
no2
22
22
5.9
7.4
7.1
17
5.7
11
Epila 2
index
2024-01-17
2024-01-16
2024-01-15
2024-01-14
2024-01-13
2024-01-12
2024-01-11
2024-01-10
pm10
7
9.1
3.8
4.7
3.5
4.3
4.7
3.2
pm25
5.4
7.1
3.1
4.3
2.4
3.2
3.3
1.2
FI00549
index
2020-05
2020-04
2020-03
2020-02
2020-01
2019-12
2019-11
2019-10
2019-09
2019-08
2019-07
2019-06
2019-05
2019-04
2019-03
2019-02
2019-01
2018-12
2018-11
2018-10
2018-09
2018-08
2018-07
2018-06
2018-05
2018-04
2018-03
2018-02
2018-01
2017-12
2017-11
2017-10
2017-09
pm10
13
15
13
9.5
6.8
5.8
11
8.5
7.2
12
8.4
10
14
29
12
9.9
7.2
8.4
12
10
9.6
9.3
12
13
25
31
19
13
6.5
6.3
8.6
10
15
no2
8.2
8.9
12
16
11
12
15
13
12
11
8.6
8.1
12
15
13
16
23
14
15
14
12
11
9.9
7.3
13
20
25
19
12
11
17
16
16
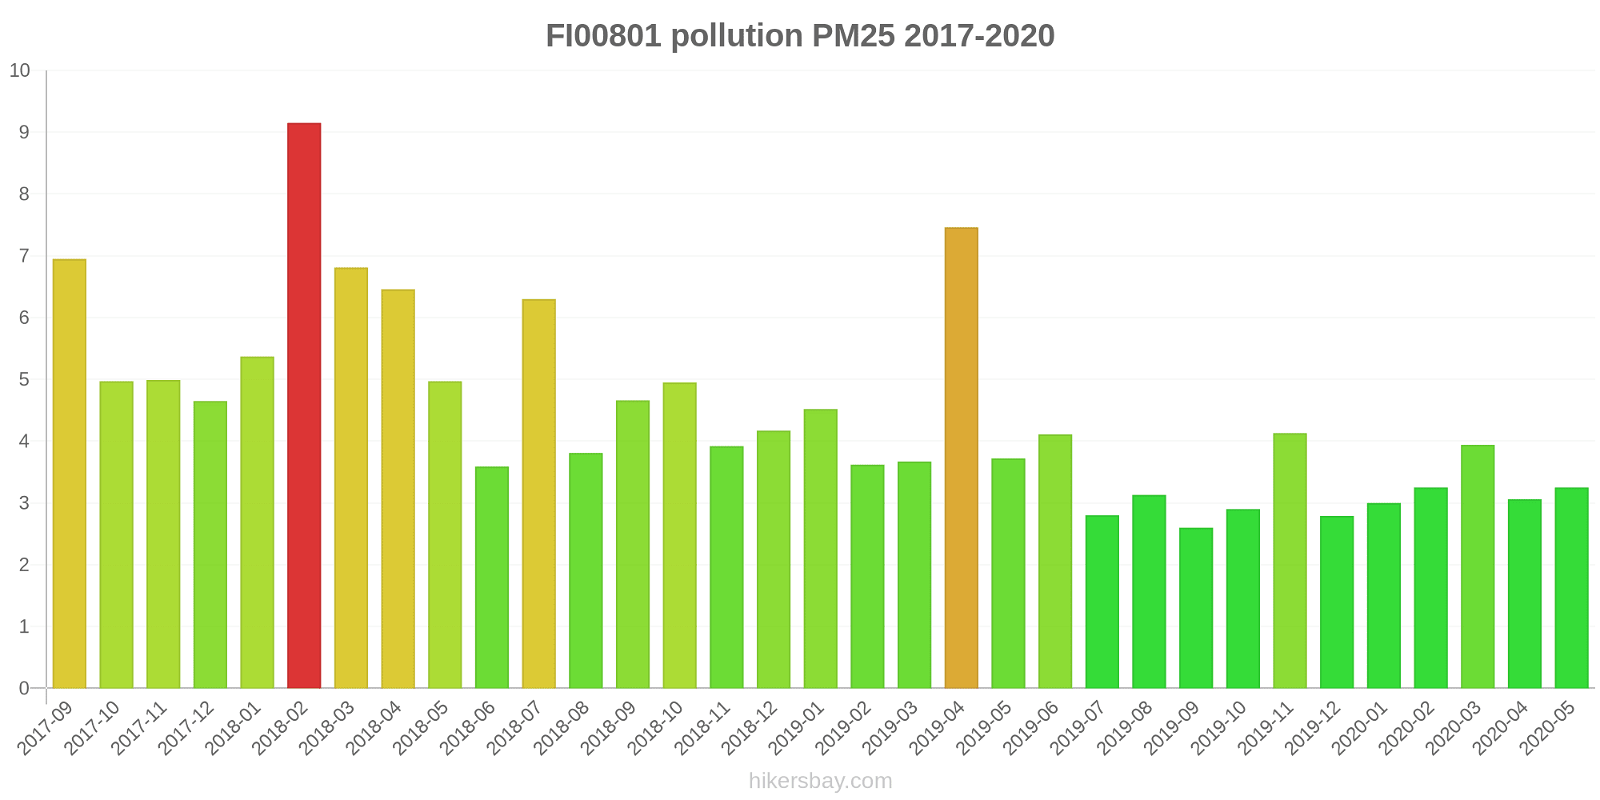
FI00801
2017-09 2020-05
index
2020-05
2020-04
2020-03
2020-02
2020-01
2019-12
2019-11
2019-10
2019-09
2019-08
2019-07
2019-06
2019-05
2019-04
2019-03
2019-02
2019-01
2018-12
2018-11
2018-10
2018-09
2018-08
2018-07
2018-06
2018-05
2018-04
2018-03
2018-02
2018-01
2017-12
2017-11
2017-10
2017-09
pm25
3.3
3.1
3.9
3.3
3
2.8
4.1
2.9
2.6
3.1
2.8
4.1
3.7
7.5
3.7
3.6
4.5
4.2
3.9
5
4.7
3.8
6.3
3.6
5
6.5
6.8
9.2
5.4
4.7
5
5
7
no2
6.1
6.3
9.3
9.9
8.6
9
11
9.2
8.6
6.9
4.9
5.7
8.8
13
10
13
22
15
14
11
9.2
9.1
9
7.8
10
16
22
18
10
9.2
14
11
8.4
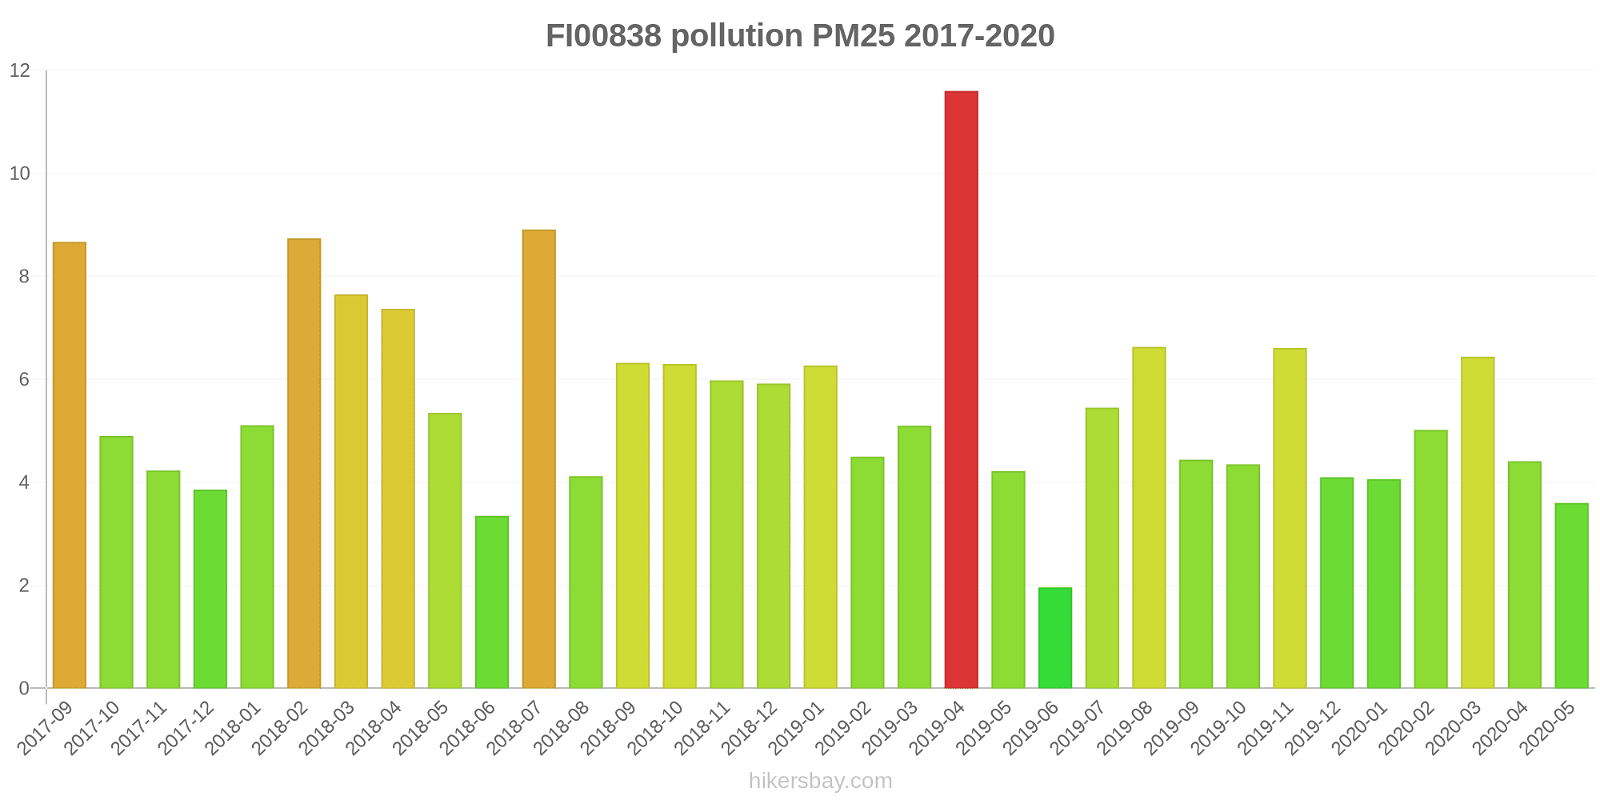
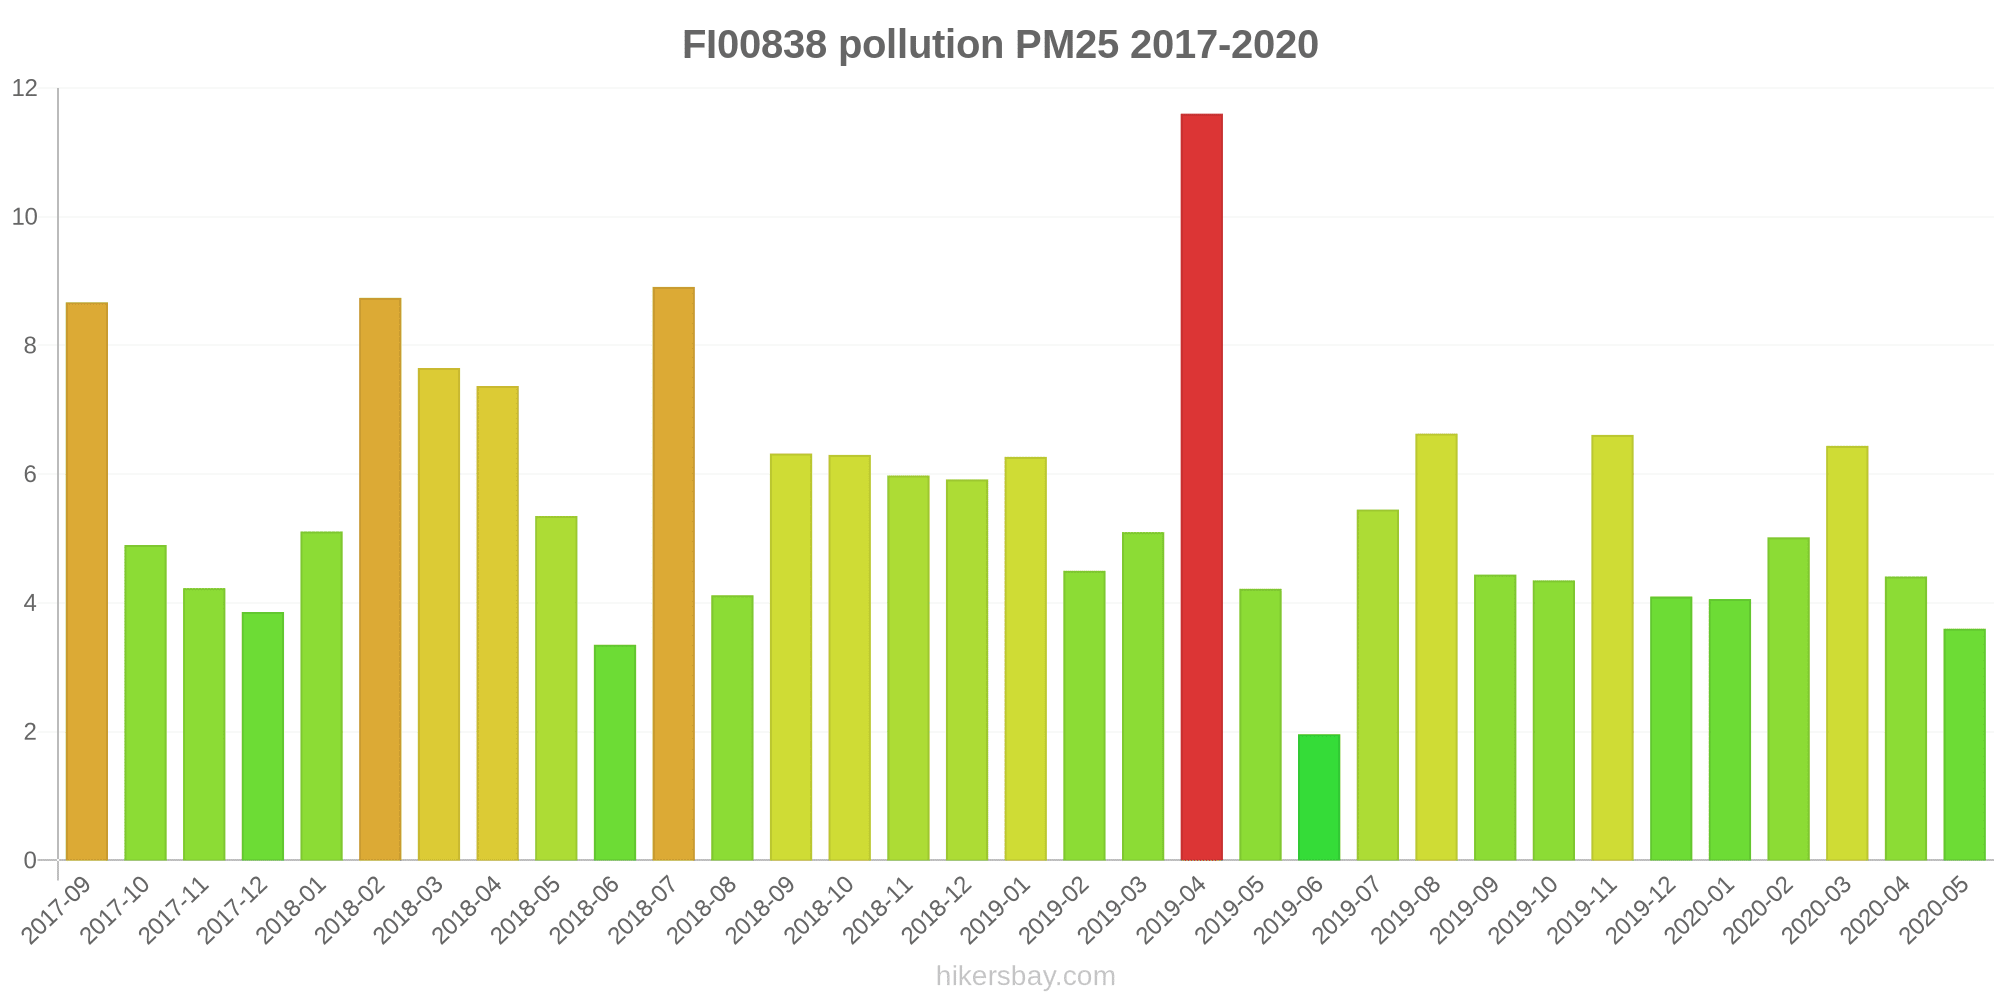
FI00838
2017-09 2020-05
index
2020-05
2020-04
2020-03
2020-02
2020-01
2019-12
2019-11
2019-10
2019-09
2019-08
2019-07
2019-06
2019-05
2019-04
2019-03
2019-02
2019-01
2018-12
2018-11
2018-10
2018-09
2018-08
2018-07
2018-06
2018-05
2018-04
2018-03
2018-02
2018-01
2017-12
2017-11
2017-10
2017-09
pm25
3.6
4.4
6.4
5
4.1
4.1
6.6
4.3
4.4
6.6
5.5
2
4.2
12
5.1
4.5
6.3
5.9
6
6.3
6.3
4.1
8.9
3.4
5.3
7.4
7.7
8.7
5.1
3.9
4.2
4.9
8.7
pm10
8.1
16
19
18
5.7
4.5
8.3
6.1
6.5
10
8.9
4.1
7
32
14
8.5
7.1
6.5
7.5
7.9
8.6
6.3
13
8.8
25
31
23
14
6.7
4.2
4.8
6.1
12
* Pollution data source:
https://openaq.org
(EEA Finland)
The data is licensed under CC-By 4.0
PM10 6 (Good)
NO2 24 (Good)
O3 41 (Good)
PM2,5 4 (Good)
Data on air pollution from recent days in Pirkanmaa
| index | 2024-01-10 | 2024-01-11 | 2024-01-12 | 2024-01-13 | 2024-01-14 | 2024-01-15 | 2024-01-16 | 2024-01-17 |
|---|---|---|---|---|---|---|---|---|
| pm10 | 2 Good |
4 Good |
5 Good |
4 Good |
5 Good |
3 Good |
8 Good |
7 Good |
| no2 | 10 Good |
7 Good |
15 Good |
7 Good |
7 Good |
6 Good |
19 Good |
17 Good |
| o3 | 62 Good |
66 Good |
54 Good |
58 Good |
49 Good |
59 Good |
53 Good |
44 Good |
| pm25 | 1 Good |
2 Good |
3 Good |
3 Good |
5 Good |
3 Good |
6 Good |
5 Good |

| index | 2020-05 | 2020-04 | 2020-03 | 2020-02 | 2020-01 | 2019-12 | 2019-11 | 2019-10 | 2019-09 | 2019-08 | 2019-07 | 2019-06 | 2019-05 | 2019-04 | 2019-03 | 2019-02 | 2019-01 | 2018-12 | 2018-11 | 2018-10 | 2018-09 | 2018-08 | 2018-07 | 2018-06 | 2018-05 | 2018-04 | 2018-03 | 2018-02 | 2018-01 | 2017-12 | 2017-11 | 2017-10 | 2017-09 |
|---|---|---|---|---|---|---|---|---|---|---|---|---|---|---|---|---|---|---|---|---|---|---|---|---|---|---|---|---|---|---|---|---|---|
| no2 | 7.2 (Good) | 7.6 (Good) | 10 (Good) | 13 (Good) | 9.9 (Good) | 11 (Good) | 13 (Good) | 11 (Good) | 10 (Good) | 9 (Good) | 6.8 (Good) | 6.9 (Good) | 10 (Good) | 14 (Good) | 12 (Good) | 15 (Good) | 22 (Good) | 15 (Good) | 15 (Good) | 12 (Good) | 10 (Good) | 10 (Good) | 9.5 (Good) | 7.5 (Good) | 12 (Good) | 18 (Good) | 23 (Good) | 19 (Good) | 11 (Good) | 10 (Good) | 15 (Good) | 14 (Good) | 12 (Good) |
| pm10 | 10 (Good) | 16 (Good) | 16 (Good) | 14 (Good) | 6.3 (Good) | 5.2 (Good) | 9.7 (Good) | 7.3 (Good) | 6.8 (Good) | 11 (Good) | 8.6 (Good) | 7 (Good) | 10 (Good) | 31 (Moderate) | 13 (Good) | 9.2 (Good) | 7.2 (Good) | 7.5 (Good) | 9.7 (Good) | 9 (Good) | 9.1 (Good) | 7.8 (Good) | 12 (Good) | 11 (Good) | 25 (Moderate) | 31 (Moderate) | 21 (Moderate) | 14 (Good) | 6.6 (Good) | 5.3 (Good) | 6.7 (Good) | 8.2 (Good) | 13 (Good) |
| pm25 | 3.4 (Good) | 3.7 (Good) | 5.2 (Good) | 4.1 (Good) | 3.5 (Good) | 3.4 (Good) | 5.4 (Good) | 3.6 (Good) | 3.5 (Good) | 4.9 (Good) | 4.1 (Good) | 3 (Good) | 4 (Good) | 9.5 (Good) | 4.4 (Good) | 4.1 (Good) | 5.4 (Good) | 5 (Good) | 5 (Good) | 5.6 (Good) | 5.5 (Good) | 4 (Good) | 7.6 (Good) | 3.5 (Good) | 5.2 (Good) | 6.9 (Good) | 7.2 (Good) | 8.9 (Good) | 5.2 (Good) | 4.3 (Good) | 4.6 (Good) | 4.9 (Good) | 7.8 (Good) |
Green and Parks in the City
Pirkanmaa 79%
Estonia: 82% Aland Islands: 75% Sweden: 84% Latvia: 88% Lithuania: 86%particulate matter PM2.5
Pirkanmaa 5 (Good)
Pleasure of spending time in the city
Pirkanmaa 93%
Estonia: 90% Aland Islands: 92% Sweden: 88% Latvia: 82% Lithuania: 83%particulate matter PM10
Pirkanmaa 11 (Good)
Air Pollution
Pirkanmaa 13%
Estonia: 12% Aland Islands: 17% Sweden: 15% Latvia: 29% Lithuania: 26%Garbage Disposal
Pirkanmaa 88%
Estonia: 79% Aland Islands: 88% Sweden: 83% Latvia: 70% Lithuania: 71%Availability and quality of drinking water
Pirkanmaa 95%
Estonia: 90% Aland Islands: 96% Sweden: 92% Latvia: 79% Lithuania: 91%Cleanliness and tidiness
Pirkanmaa 84%
Estonia: 82% Aland Islands: 83% Sweden: 76% Latvia: 72% Lithuania: 78%Noise and Light pollution
Pirkanmaa 27%
Estonia: 31% Aland Islands: 46% Sweden: 26% Latvia: 37% Lithuania: 30%Water Pollution
Pirkanmaa 13%
Estonia: 16% Aland Islands: 10% Sweden: 15% Latvia: 28% Lithuania: 24%PM10 5.9 (Good)
particulate matter (PM10) suspended dustNO2 33 (Good)
nitrogen dioxide (NO2)O3 49 (Good)
ozone (O3)NO2 7.5 (Good)
nitrogen dioxide (NO2)PM2,5 3.5 (Good)
particulate matter (PM2.5) dustO3 34 (Good)
ozone (O3)NO2 30 (Good)
nitrogen dioxide (NO2)PM10 5.8 (Good)
particulate matter (PM10) suspended dustPM2,5 5 (Good)
particulate matter (PM2.5) dustPirkankatu
| index | 2024-01-17 | 2024-01-16 | 2024-01-15 | 2024-01-14 | 2024-01-13 | 2024-01-12 | 2024-01-11 | 2024-01-10 |
|---|---|---|---|---|---|---|---|---|
| pm10 | 6.7 | 7.2 | 2.5 | 5.4 | 4.7 | 4.8 | 3.5 | 1.7 |
| no2 | 24 | 31 | 8.8 | 9.1 | 10 | 27 | 15 | 17 |
FI00621
| index | 2024-01-17 | 2024-01-16 | 2024-01-15 | 2024-01-14 | 2024-01-13 | 2024-01-12 | 2024-01-11 | 2024-01-10 |
|---|---|---|---|---|---|---|---|---|
| no2 | 6.3 | 2.7 | 2.1 | 3.6 | 3 | 2.7 | 1.4 | 1.3 |
| o3 | 51 | 62 | 62 | 51 | 60 | 60 | 69 | 67 |
Kaleva
| index | 2024-01-17 | 2024-01-16 | 2024-01-15 | 2024-01-14 | 2024-01-13 | 2024-01-12 | 2024-01-11 | 2024-01-10 |
|---|---|---|---|---|---|---|---|---|
| pm25 | 4.8 | 4.6 | 2.2 | 5.2 | 2.9 | 2.7 | 1.4 | 0.68 |
| o3 | 37 | 44 | 55 | 46 | 56 | 48 | 64 | 58 |
| no2 | 22 | 22 | 5.9 | 7.4 | 7.1 | 17 | 5.7 | 11 |
Epila 2
| index | 2024-01-17 | 2024-01-16 | 2024-01-15 | 2024-01-14 | 2024-01-13 | 2024-01-12 | 2024-01-11 | 2024-01-10 |
|---|---|---|---|---|---|---|---|---|
| pm10 | 7 | 9.1 | 3.8 | 4.7 | 3.5 | 4.3 | 4.7 | 3.2 |
| pm25 | 5.4 | 7.1 | 3.1 | 4.3 | 2.4 | 3.2 | 3.3 | 1.2 |
FI00549
| index | 2020-05 | 2020-04 | 2020-03 | 2020-02 | 2020-01 | 2019-12 | 2019-11 | 2019-10 | 2019-09 | 2019-08 | 2019-07 | 2019-06 | 2019-05 | 2019-04 | 2019-03 | 2019-02 | 2019-01 | 2018-12 | 2018-11 | 2018-10 | 2018-09 | 2018-08 | 2018-07 | 2018-06 | 2018-05 | 2018-04 | 2018-03 | 2018-02 | 2018-01 | 2017-12 | 2017-11 | 2017-10 | 2017-09 |
|---|---|---|---|---|---|---|---|---|---|---|---|---|---|---|---|---|---|---|---|---|---|---|---|---|---|---|---|---|---|---|---|---|---|
| pm10 | 13 | 15 | 13 | 9.5 | 6.8 | 5.8 | 11 | 8.5 | 7.2 | 12 | 8.4 | 10 | 14 | 29 | 12 | 9.9 | 7.2 | 8.4 | 12 | 10 | 9.6 | 9.3 | 12 | 13 | 25 | 31 | 19 | 13 | 6.5 | 6.3 | 8.6 | 10 | 15 |
| no2 | 8.2 | 8.9 | 12 | 16 | 11 | 12 | 15 | 13 | 12 | 11 | 8.6 | 8.1 | 12 | 15 | 13 | 16 | 23 | 14 | 15 | 14 | 12 | 11 | 9.9 | 7.3 | 13 | 20 | 25 | 19 | 12 | 11 | 17 | 16 | 16 |
FI00801

| index | 2020-05 | 2020-04 | 2020-03 | 2020-02 | 2020-01 | 2019-12 | 2019-11 | 2019-10 | 2019-09 | 2019-08 | 2019-07 | 2019-06 | 2019-05 | 2019-04 | 2019-03 | 2019-02 | 2019-01 | 2018-12 | 2018-11 | 2018-10 | 2018-09 | 2018-08 | 2018-07 | 2018-06 | 2018-05 | 2018-04 | 2018-03 | 2018-02 | 2018-01 | 2017-12 | 2017-11 | 2017-10 | 2017-09 |
|---|---|---|---|---|---|---|---|---|---|---|---|---|---|---|---|---|---|---|---|---|---|---|---|---|---|---|---|---|---|---|---|---|---|
| pm25 | 3.3 | 3.1 | 3.9 | 3.3 | 3 | 2.8 | 4.1 | 2.9 | 2.6 | 3.1 | 2.8 | 4.1 | 3.7 | 7.5 | 3.7 | 3.6 | 4.5 | 4.2 | 3.9 | 5 | 4.7 | 3.8 | 6.3 | 3.6 | 5 | 6.5 | 6.8 | 9.2 | 5.4 | 4.7 | 5 | 5 | 7 |
| no2 | 6.1 | 6.3 | 9.3 | 9.9 | 8.6 | 9 | 11 | 9.2 | 8.6 | 6.9 | 4.9 | 5.7 | 8.8 | 13 | 10 | 13 | 22 | 15 | 14 | 11 | 9.2 | 9.1 | 9 | 7.8 | 10 | 16 | 22 | 18 | 10 | 9.2 | 14 | 11 | 8.4 |
FI00838
| index | 2020-05 | 2020-04 | 2020-03 | 2020-02 | 2020-01 | 2019-12 | 2019-11 | 2019-10 | 2019-09 | 2019-08 | 2019-07 | 2019-06 | 2019-05 | 2019-04 | 2019-03 | 2019-02 | 2019-01 | 2018-12 | 2018-11 | 2018-10 | 2018-09 | 2018-08 | 2018-07 | 2018-06 | 2018-05 | 2018-04 | 2018-03 | 2018-02 | 2018-01 | 2017-12 | 2017-11 | 2017-10 | 2017-09 |
|---|---|---|---|---|---|---|---|---|---|---|---|---|---|---|---|---|---|---|---|---|---|---|---|---|---|---|---|---|---|---|---|---|---|
| pm25 | 3.6 | 4.4 | 6.4 | 5 | 4.1 | 4.1 | 6.6 | 4.3 | 4.4 | 6.6 | 5.5 | 2 | 4.2 | 12 | 5.1 | 4.5 | 6.3 | 5.9 | 6 | 6.3 | 6.3 | 4.1 | 8.9 | 3.4 | 5.3 | 7.4 | 7.7 | 8.7 | 5.1 | 3.9 | 4.2 | 4.9 | 8.7 |
| pm10 | 8.1 | 16 | 19 | 18 | 5.7 | 4.5 | 8.3 | 6.1 | 6.5 | 10 | 8.9 | 4.1 | 7 | 32 | 14 | 8.5 | 7.1 | 6.5 | 7.5 | 7.9 | 8.6 | 6.3 | 13 | 8.8 | 25 | 31 | 23 | 14 | 6.7 | 4.2 | 4.8 | 6.1 | 12 |