Air Pollution in Dashuigou: Real-time Air Quality Index and smog alert.
Pollution and air quality forecast for Dashuigou. Today is Tuesday, June 2, 2026. The following air pollution values have been recorded for Dashuigou:- particulate matter (PM10) suspended dust - 179 (Very bad Hazardous)
- particulate matter (PM2.5) dust - 35 (Unhealthy for Sensitive Groups)
- ozone (O3) - 0 (Good)
- nitrogen dioxide (NO2) - 0 (Good)
- sulfur dioxide (SO2) - 0 (Good)

What is the air quality in Dashuigou today? Is the air polluted in Dashuigou?. Is there smog?
What is the level of PM10 today in Dashuigou? (particulate matter (PM10) suspended dust)
The current level of particulate matter PM10 in Dashuigou is:
179 (Very bad Hazardous)
The highest PM10 values usually occur in month: 116 (November 2018).
The lowest value of particulate matter PM10 pollution in Dashuigou is usually recorded in: January (42).
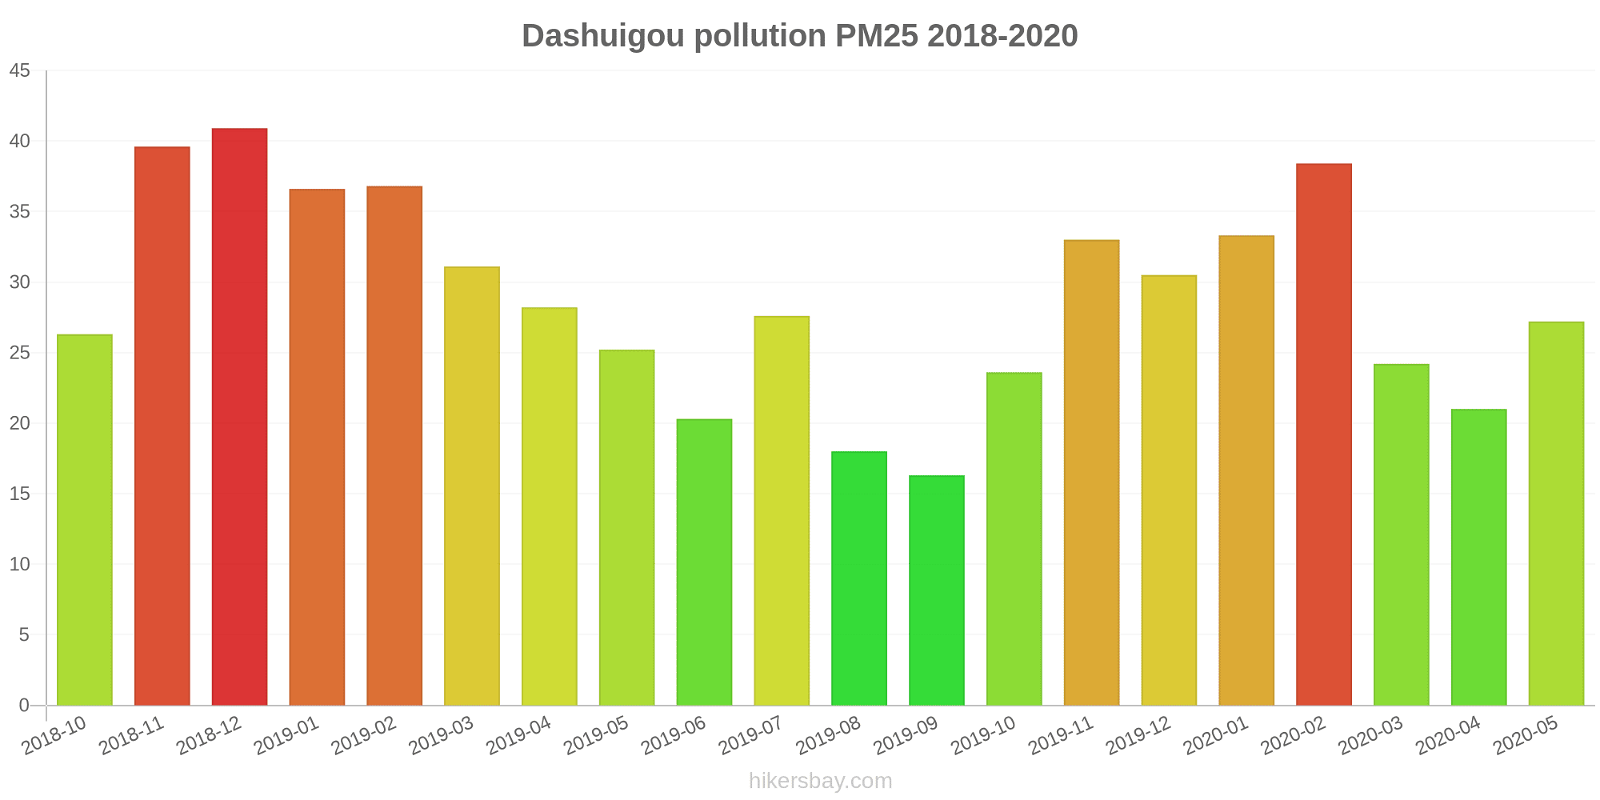
What is the current level of PM2.5 in Dashuigou? (particulate matter (PM2.5) dust)
Today's PM2.5 level is:
35 (Unhealthy for Sensitive Groups)
For comparison, the highest level of PM2.5 in Dashuigou in the last 7 days was: 56 (Friday, May 27, 2022) and the lowest: 56 (Friday, May 27, 2022).
The highest PM2.5 values were recorded: 41 (December 2018).
The lowest level of particulate matter PM2.5 pollution occurs in month: September (16).
How is the O3 level today in Dashuigou? (ozone (O3))
0 (Good)
How high is the level of NO2? (nitrogen dioxide (NO2))
0 (Good)
What is the level of SO2 pollution? (sulfur dioxide (SO2))
0 (Good)
Current data Friday, May 27, 2022, 12:00 PM
PM10 179 (Very bad Hazardous)
PM2,5 35 (Unhealthy for Sensitive Groups)
O3 0 (Good)
NO2 0 (Good)
SO2 0 (Good)
Data on air pollution from recent days in Dashuigou
index
2022-05-27
pm10
56
Unhealthy for Sensitive Groups
pm25
56
Unhealthy
o3
0
Good
no2
0
Good
so2
0
Good
data source »
Air pollution in Dashuigou from October 2018 to May 2020
index
2020-05
2020-04
2020-03
2020-02
2020-01
2019-12
2019-11
2019-10
2019-09
2019-08
2019-07
2019-06
2019-05
2019-04
2019-03
2019-02
2019-01
2018-12
2018-11
2018-10
pm25
27 (Moderate)
21 (Moderate)
24 (Moderate)
38 (Unhealthy for Sensitive Groups)
33 (Moderate)
31 (Moderate)
33 (Moderate)
24 (Moderate)
16 (Moderate)
18 (Moderate)
28 (Moderate)
20 (Moderate)
25 (Moderate)
28 (Moderate)
31 (Moderate)
37 (Unhealthy for Sensitive Groups)
37 (Unhealthy for Sensitive Groups)
41 (Unhealthy for Sensitive Groups)
40 (Unhealthy for Sensitive Groups)
26 (Moderate)
co
506 (Good)
449 (Good)
627 (Good)
896 (Good)
1 (Good)
802 (Good)
798 (Good)
551 (Good)
305 (Good)
435 (Good)
259 (Good)
249 (Good)
822 (Good)
1 (Good)
657 (Good)
568 (Good)
728 (Good)
790 (Good)
901 (Good)
533 (Good)
no2
15 (Good)
14 (Good)
13 (Good)
17 (Good)
21 (Good)
26 (Good)
31 (Good)
28 (Good)
19 (Good)
17 (Good)
18 (Good)
15 (Good)
16 (Good)
19 (Good)
16 (Good)
12 (Good)
18 (Good)
20 (Good)
25 (Good)
24 (Good)
o3
150 (Unhealthy)
119 (Moderate)
94 (Moderate)
91 (Moderate)
80 (Moderate)
64 (Good)
62 (Good)
95 (Moderate)
136 (Unhealthy for Sensitive Groups)
126 (Unhealthy for Sensitive Groups)
158 (Unhealthy)
156 (Unhealthy)
135 (Unhealthy for Sensitive Groups)
117 (Moderate)
112 (Moderate)
96 (Moderate)
75 (Moderate)
64 (Good)
73 (Moderate)
93 (Moderate)
pm10
107 (Unhealthy)
75 (Unhealthy for Sensitive Groups)
54 (Unhealthy for Sensitive Groups)
57 (Unhealthy for Sensitive Groups)
42 (Moderate)
53 (Unhealthy for Sensitive Groups)
86 (Unhealthy)
75 (Unhealthy for Sensitive Groups)
50 (Unhealthy for Sensitive Groups)
44 (Moderate)
50 (Unhealthy for Sensitive Groups)
52 (Unhealthy for Sensitive Groups)
74 (Unhealthy for Sensitive Groups)
109 (Unhealthy)
73 (Unhealthy for Sensitive Groups)
75 (Unhealthy for Sensitive Groups)
71 (Unhealthy for Sensitive Groups)
89 (Unhealthy)
116 (Very Unhealthy)
64 (Unhealthy for Sensitive Groups)
so2
5.2 (Good)
5.5 (Good)
11 (Good)
19 (Good)
18 (Good)
15 (Good)
12 (Good)
6.5 (Good)
5.9 (Good)
7.7 (Good)
7.6 (Good)
6.8 (Good)
3.7 (Good)
9.8 (Good)
14 (Good)
16 (Good)
18 (Good)
16 (Good)
14 (Good)
9.3 (Good)
data source »
北泵房
Friday, May 27, 2022, 12:00 PM
PM10 179 (Very bad Hazardous)
particulate matter (PM10) suspended dust
PM2,5 35 (Unhealthy for Sensitive Groups)
particulate matter (PM2.5) dust
O3 0.04 (Good)
ozone (O3)
NO2 0 (Good)
nitrogen dioxide (NO2)
SO2 0 (Good)
sulfur dioxide (SO2)
北泵房
index
2022-05-27
pm10
56
pm25
56
o3
0.03
no2
0
so2
0
北泵房
2018-10 2020-05

index
2020-05
2020-04
2020-03
2020-02
2020-01
2019-12
2019-11
2019-10
2019-09
2019-08
2019-07
2019-06
2019-05
2019-04
2019-03
2019-02
2019-01
2018-12
2018-11
2018-10
pm25
27
21
24
38
33
31
33
24
16
18
28
20
25
28
31
37
37
41
40
26
co
506
449
627
896
1
802
798
551
305
435
259
249
822
1
657
568
728
790
901
533
no2
15
14
13
17
21
26
31
28
19
17
18
15
16
19
16
12
18
20
25
24
o3
150
119
94
91
80
64
62
95
136
126
158
156
135
117
112
96
75
64
73
93
pm10
107
75
54
57
42
53
86
75
50
44
50
52
74
109
73
75
71
89
116
64
so2
5.2
5.5
11
19
18
15
12
6.5
5.9
7.7
7.6
6.8
3.7
9.8
14
16
18
16
14
9.3
* Pollution data source:
https://openaq.org
(ChinaAQIData)
The data is licensed under CC-By 4.0
PM10 179 (Very bad Hazardous)
PM2,5 35 (Unhealthy for Sensitive Groups)
O3 0 (Good)
NO2 0 (Good)
SO2 0 (Good)
Data on air pollution from recent days in Dashuigou
| index | 2022-05-27 |
|---|---|
| pm10 | 56 Unhealthy for Sensitive Groups |
| pm25 | 56 Unhealthy |
| o3 | 0 Good |
| no2 | 0 Good |
| so2 | 0 Good |

| index | 2020-05 | 2020-04 | 2020-03 | 2020-02 | 2020-01 | 2019-12 | 2019-11 | 2019-10 | 2019-09 | 2019-08 | 2019-07 | 2019-06 | 2019-05 | 2019-04 | 2019-03 | 2019-02 | 2019-01 | 2018-12 | 2018-11 | 2018-10 |
|---|---|---|---|---|---|---|---|---|---|---|---|---|---|---|---|---|---|---|---|---|
| pm25 | 27 (Moderate) | 21 (Moderate) | 24 (Moderate) | 38 (Unhealthy for Sensitive Groups) | 33 (Moderate) | 31 (Moderate) | 33 (Moderate) | 24 (Moderate) | 16 (Moderate) | 18 (Moderate) | 28 (Moderate) | 20 (Moderate) | 25 (Moderate) | 28 (Moderate) | 31 (Moderate) | 37 (Unhealthy for Sensitive Groups) | 37 (Unhealthy for Sensitive Groups) | 41 (Unhealthy for Sensitive Groups) | 40 (Unhealthy for Sensitive Groups) | 26 (Moderate) |
| co | 506 (Good) | 449 (Good) | 627 (Good) | 896 (Good) | 1 (Good) | 802 (Good) | 798 (Good) | 551 (Good) | 305 (Good) | 435 (Good) | 259 (Good) | 249 (Good) | 822 (Good) | 1 (Good) | 657 (Good) | 568 (Good) | 728 (Good) | 790 (Good) | 901 (Good) | 533 (Good) |
| no2 | 15 (Good) | 14 (Good) | 13 (Good) | 17 (Good) | 21 (Good) | 26 (Good) | 31 (Good) | 28 (Good) | 19 (Good) | 17 (Good) | 18 (Good) | 15 (Good) | 16 (Good) | 19 (Good) | 16 (Good) | 12 (Good) | 18 (Good) | 20 (Good) | 25 (Good) | 24 (Good) |
| o3 | 150 (Unhealthy) | 119 (Moderate) | 94 (Moderate) | 91 (Moderate) | 80 (Moderate) | 64 (Good) | 62 (Good) | 95 (Moderate) | 136 (Unhealthy for Sensitive Groups) | 126 (Unhealthy for Sensitive Groups) | 158 (Unhealthy) | 156 (Unhealthy) | 135 (Unhealthy for Sensitive Groups) | 117 (Moderate) | 112 (Moderate) | 96 (Moderate) | 75 (Moderate) | 64 (Good) | 73 (Moderate) | 93 (Moderate) |
| pm10 | 107 (Unhealthy) | 75 (Unhealthy for Sensitive Groups) | 54 (Unhealthy for Sensitive Groups) | 57 (Unhealthy for Sensitive Groups) | 42 (Moderate) | 53 (Unhealthy for Sensitive Groups) | 86 (Unhealthy) | 75 (Unhealthy for Sensitive Groups) | 50 (Unhealthy for Sensitive Groups) | 44 (Moderate) | 50 (Unhealthy for Sensitive Groups) | 52 (Unhealthy for Sensitive Groups) | 74 (Unhealthy for Sensitive Groups) | 109 (Unhealthy) | 73 (Unhealthy for Sensitive Groups) | 75 (Unhealthy for Sensitive Groups) | 71 (Unhealthy for Sensitive Groups) | 89 (Unhealthy) | 116 (Very Unhealthy) | 64 (Unhealthy for Sensitive Groups) |
| so2 | 5.2 (Good) | 5.5 (Good) | 11 (Good) | 19 (Good) | 18 (Good) | 15 (Good) | 12 (Good) | 6.5 (Good) | 5.9 (Good) | 7.7 (Good) | 7.6 (Good) | 6.8 (Good) | 3.7 (Good) | 9.8 (Good) | 14 (Good) | 16 (Good) | 18 (Good) | 16 (Good) | 14 (Good) | 9.3 (Good) |
PM10 179 (Very bad Hazardous)
particulate matter (PM10) suspended dustPM2,5 35 (Unhealthy for Sensitive Groups)
particulate matter (PM2.5) dustO3 0.04 (Good)
ozone (O3)NO2 0 (Good)
nitrogen dioxide (NO2)SO2 0 (Good)
sulfur dioxide (SO2)北泵房
| index | 2022-05-27 |
|---|---|
| pm10 | 56 |
| pm25 | 56 |
| o3 | 0.03 |
| no2 | 0 |
| so2 | 0 |
北泵房

| index | 2020-05 | 2020-04 | 2020-03 | 2020-02 | 2020-01 | 2019-12 | 2019-11 | 2019-10 | 2019-09 | 2019-08 | 2019-07 | 2019-06 | 2019-05 | 2019-04 | 2019-03 | 2019-02 | 2019-01 | 2018-12 | 2018-11 | 2018-10 |
|---|---|---|---|---|---|---|---|---|---|---|---|---|---|---|---|---|---|---|---|---|
| pm25 | 27 | 21 | 24 | 38 | 33 | 31 | 33 | 24 | 16 | 18 | 28 | 20 | 25 | 28 | 31 | 37 | 37 | 41 | 40 | 26 |
| co | 506 | 449 | 627 | 896 | 1 | 802 | 798 | 551 | 305 | 435 | 259 | 249 | 822 | 1 | 657 | 568 | 728 | 790 | 901 | 533 |
| no2 | 15 | 14 | 13 | 17 | 21 | 26 | 31 | 28 | 19 | 17 | 18 | 15 | 16 | 19 | 16 | 12 | 18 | 20 | 25 | 24 |
| o3 | 150 | 119 | 94 | 91 | 80 | 64 | 62 | 95 | 136 | 126 | 158 | 156 | 135 | 117 | 112 | 96 | 75 | 64 | 73 | 93 |
| pm10 | 107 | 75 | 54 | 57 | 42 | 53 | 86 | 75 | 50 | 44 | 50 | 52 | 74 | 109 | 73 | 75 | 71 | 89 | 116 | 64 |
| so2 | 5.2 | 5.5 | 11 | 19 | 18 | 15 | 12 | 6.5 | 5.9 | 7.7 | 7.6 | 6.8 | 3.7 | 9.8 | 14 | 16 | 18 | 16 | 14 | 9.3 |