Air Pollution in Erdaogou: Real-time Air Quality Index and smog alert.
Pollution and air quality forecast for Erdaogou. Today is Tuesday, June 2, 2026. The following air pollution values have been recorded for Erdaogou:- particulate matter (PM10) suspended dust - 179 (Very bad Hazardous)
- particulate matter (PM2.5) dust - 35 (Unhealthy for Sensitive Groups)
- ozone (O3) - 0 (Good)
- nitrogen dioxide (NO2) - 0 (Good)
- sulfur dioxide (SO2) - 0 (Good)

What is the air quality in Erdaogou today? Is the air polluted in Erdaogou?. Is there smog?
What is the level of PM10 today in Erdaogou? (particulate matter (PM10) suspended dust)
The current level of particulate matter PM10 in Erdaogou is:
179 (Very bad Hazardous)
The highest PM10 values usually occur in month: 153 (January 2019).
The lowest value of particulate matter PM10 pollution in Erdaogou is usually recorded in: August (50).
What is the current level of PM2.5 in Erdaogou? (particulate matter (PM2.5) dust)
Today's PM2.5 level is:
35 (Unhealthy for Sensitive Groups)
For comparison, the highest level of PM2.5 in Erdaogou in the last 7 days was: 56 (Friday, May 27, 2022) and the lowest: 56 (Friday, May 27, 2022).
The highest PM2.5 values were recorded: 131 (January 2019).
The lowest level of particulate matter PM2.5 pollution occurs in month: July (29).
How is the O3 level today in Erdaogou? (ozone (O3))
0 (Good)
How high is the level of NO2? (nitrogen dioxide (NO2))
0 (Good)
What is the level of SO2 pollution? (sulfur dioxide (SO2))
0 (Good)
Current data Friday, May 27, 2022, 12:00 PM
PM10 179 (Very bad Hazardous)
PM2,5 35 (Unhealthy for Sensitive Groups)
O3 0 (Good)
NO2 0 (Good)
SO2 0 (Good)
Data on air pollution from recent days in Erdaogou
index
2022-05-27
pm10
56
Unhealthy for Sensitive Groups
pm25
56
Unhealthy
o3
0
Good
no2
0
Good
so2
0
Good
data source »
Air pollution in Erdaogou from October 2018 to May 2020

index
2020-05
2020-04
2020-03
2020-02
2020-01
2019-12
2019-11
2019-10
2019-09
2019-08
2019-07
2019-06
2019-05
2019-04
2019-03
2019-02
2019-01
2018-12
2018-11
2018-10
pm25
29 (Moderate)
46 (Unhealthy for Sensitive Groups)
50 (Unhealthy for Sensitive Groups)
60 (Unhealthy)
125 (Very bad Hazardous)
96 (Very Unhealthy)
75 (Very Unhealthy)
43 (Unhealthy for Sensitive Groups)
38 (Unhealthy for Sensitive Groups)
29 (Moderate)
29 (Moderate)
29 (Moderate)
34 (Moderate)
46 (Unhealthy for Sensitive Groups)
54 (Unhealthy for Sensitive Groups)
120 (Very bad Hazardous)
131 (Very bad Hazardous)
113 (Very bad Hazardous)
92 (Very Unhealthy)
48 (Unhealthy for Sensitive Groups)
co
784 (Good)
838 (Good)
875 (Good)
995 (Good)
1 (Good)
1 (Good)
953 (Good)
893 (Good)
849 (Good)
835 (Good)
771 (Good)
826 (Good)
905 (Good)
1 (Good)
879 (Good)
1 (Good)
1 (Good)
1 (Good)
1 (Good)
890 (Good)
no2
23 (Good)
34 (Good)
34 (Good)
17 (Good)
35 (Good)
45 (Moderate)
45 (Moderate)
38 (Good)
33 (Good)
23 (Good)
26 (Good)
26 (Good)
28 (Good)
29 (Good)
34 (Good)
33 (Good)
52 (Moderate)
53 (Moderate)
48 (Moderate)
47 (Moderate)
o3
155 (Unhealthy)
136 (Unhealthy for Sensitive Groups)
110 (Moderate)
90 (Moderate)
75 (Moderate)
54 (Good)
87 (Moderate)
110 (Moderate)
166 (Unhealthy)
164 (Unhealthy)
180 (Very Unhealthy)
184 (Very Unhealthy)
149 (Unhealthy for Sensitive Groups)
131 (Unhealthy for Sensitive Groups)
110 (Moderate)
91 (Moderate)
67 (Good)
48 (Good)
90 (Moderate)
120 (Unhealthy for Sensitive Groups)
pm10
70 (Unhealthy for Sensitive Groups)
83 (Unhealthy)
83 (Unhealthy)
70 (Unhealthy for Sensitive Groups)
120 (Very Unhealthy)
104 (Unhealthy)
110 (Very Unhealthy)
84 (Unhealthy)
70 (Unhealthy for Sensitive Groups)
50 (Unhealthy for Sensitive Groups)
58 (Unhealthy for Sensitive Groups)
66 (Unhealthy for Sensitive Groups)
97 (Unhealthy)
95 (Unhealthy)
97 (Unhealthy)
142 (Very Unhealthy)
153 (Very bad Hazardous)
148 (Very Unhealthy)
136 (Very Unhealthy)
97 (Unhealthy)
so2
12 (Good)
14 (Good)
11 (Good)
7.6 (Good)
10 (Good)
11 (Good)
14 (Good)
12 (Good)
13 (Good)
8.3 (Good)
7.6 (Good)
8.5 (Good)
11 (Good)
12 (Good)
13 (Good)
11 (Good)
19 (Good)
19 (Good)
13 (Good)
17 (Good)
data source »
Fuyang Kai Fa Qu
Friday, May 27, 2022, 12:00 PM
PM10 179 (Very bad Hazardous)
particulate matter (PM10) suspended dust
PM2,5 35 (Unhealthy for Sensitive Groups)
particulate matter (PM2.5) dust
O3 0.04 (Good)
ozone (O3)
NO2 0 (Good)
nitrogen dioxide (NO2)
SO2 0 (Good)
sulfur dioxide (SO2)
Fuyang Kai Fa Qu
index
2022-05-27
pm10
56
pm25
56
o3
0.03
no2
0
so2
0
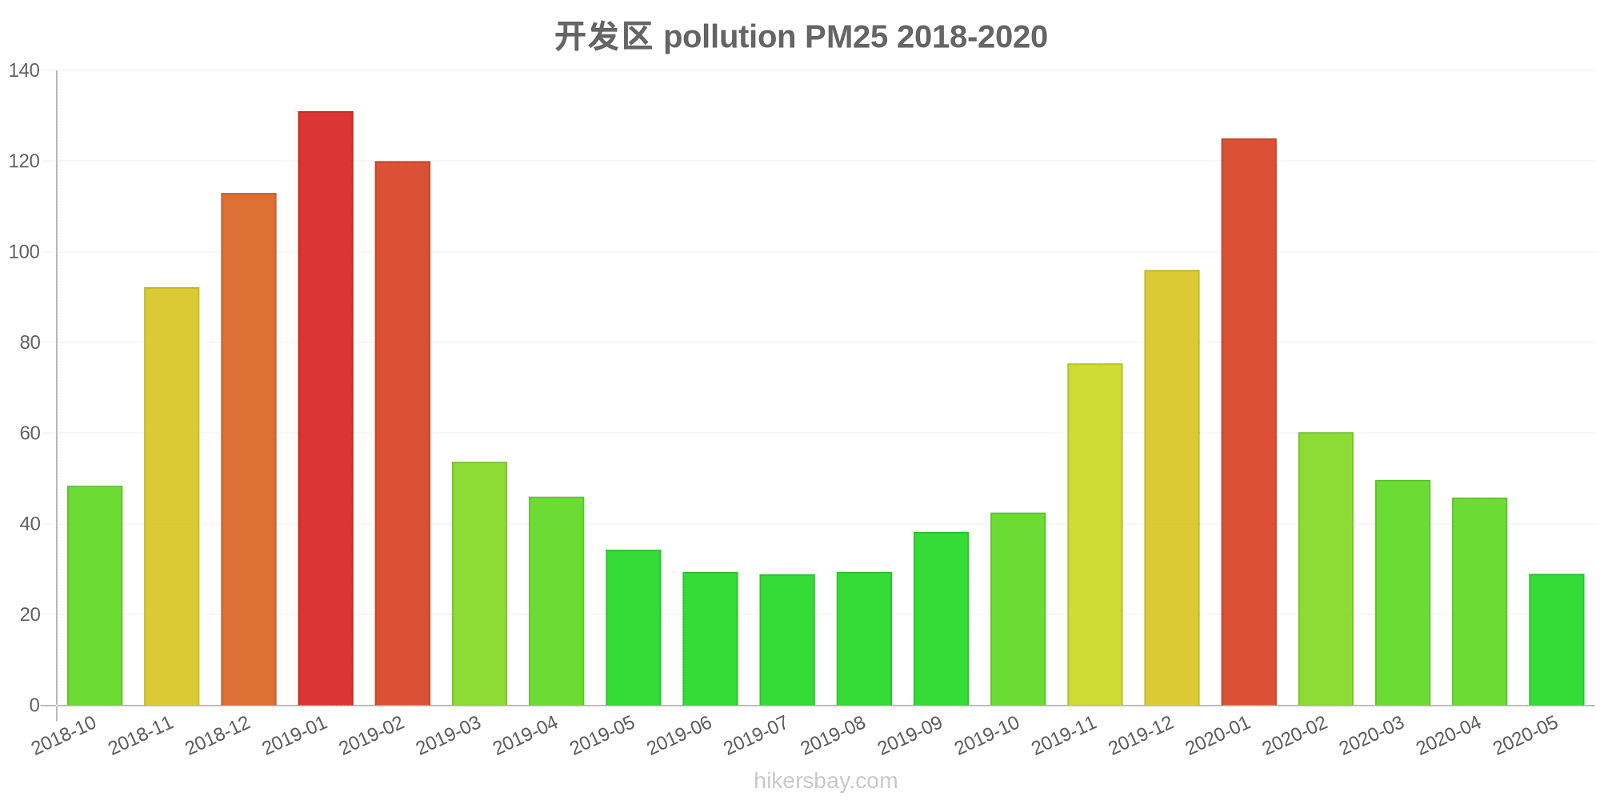
开发区
2018-10 2020-05
index
2020-05
2020-04
2020-03
2020-02
2020-01
2019-12
2019-11
2019-10
2019-09
2019-08
2019-07
2019-06
2019-05
2019-04
2019-03
2019-02
2019-01
2018-12
2018-11
2018-10
pm25
29
46
50
60
125
96
75
43
38
29
29
29
34
46
54
120
131
113
92
48
co
784
838
875
995
1
1
953
893
849
835
771
826
905
1
879
1
1
1
1
890
no2
23
34
34
17
35
45
45
38
33
23
26
26
28
29
34
33
52
53
48
47
o3
155
136
110
90
75
54
87
110
166
164
180
184
149
131
110
91
67
48
90
120
pm10
70
83
83
70
120
104
110
84
70
50
58
66
97
95
97
142
153
148
136
97
so2
12
14
11
7.6
10
11
14
12
13
8.3
7.6
8.5
11
12
13
11
19
19
13
17
* Pollution data source:
https://openaq.org
(ChinaAQIData)
The data is licensed under CC-By 4.0
PM10 179 (Very bad Hazardous)
PM2,5 35 (Unhealthy for Sensitive Groups)
O3 0 (Good)
NO2 0 (Good)
SO2 0 (Good)
Data on air pollution from recent days in Erdaogou
| index | 2022-05-27 |
|---|---|
| pm10 | 56 Unhealthy for Sensitive Groups |
| pm25 | 56 Unhealthy |
| o3 | 0 Good |
| no2 | 0 Good |
| so2 | 0 Good |

| index | 2020-05 | 2020-04 | 2020-03 | 2020-02 | 2020-01 | 2019-12 | 2019-11 | 2019-10 | 2019-09 | 2019-08 | 2019-07 | 2019-06 | 2019-05 | 2019-04 | 2019-03 | 2019-02 | 2019-01 | 2018-12 | 2018-11 | 2018-10 |
|---|---|---|---|---|---|---|---|---|---|---|---|---|---|---|---|---|---|---|---|---|
| pm25 | 29 (Moderate) | 46 (Unhealthy for Sensitive Groups) | 50 (Unhealthy for Sensitive Groups) | 60 (Unhealthy) | 125 (Very bad Hazardous) | 96 (Very Unhealthy) | 75 (Very Unhealthy) | 43 (Unhealthy for Sensitive Groups) | 38 (Unhealthy for Sensitive Groups) | 29 (Moderate) | 29 (Moderate) | 29 (Moderate) | 34 (Moderate) | 46 (Unhealthy for Sensitive Groups) | 54 (Unhealthy for Sensitive Groups) | 120 (Very bad Hazardous) | 131 (Very bad Hazardous) | 113 (Very bad Hazardous) | 92 (Very Unhealthy) | 48 (Unhealthy for Sensitive Groups) |
| co | 784 (Good) | 838 (Good) | 875 (Good) | 995 (Good) | 1 (Good) | 1 (Good) | 953 (Good) | 893 (Good) | 849 (Good) | 835 (Good) | 771 (Good) | 826 (Good) | 905 (Good) | 1 (Good) | 879 (Good) | 1 (Good) | 1 (Good) | 1 (Good) | 1 (Good) | 890 (Good) |
| no2 | 23 (Good) | 34 (Good) | 34 (Good) | 17 (Good) | 35 (Good) | 45 (Moderate) | 45 (Moderate) | 38 (Good) | 33 (Good) | 23 (Good) | 26 (Good) | 26 (Good) | 28 (Good) | 29 (Good) | 34 (Good) | 33 (Good) | 52 (Moderate) | 53 (Moderate) | 48 (Moderate) | 47 (Moderate) |
| o3 | 155 (Unhealthy) | 136 (Unhealthy for Sensitive Groups) | 110 (Moderate) | 90 (Moderate) | 75 (Moderate) | 54 (Good) | 87 (Moderate) | 110 (Moderate) | 166 (Unhealthy) | 164 (Unhealthy) | 180 (Very Unhealthy) | 184 (Very Unhealthy) | 149 (Unhealthy for Sensitive Groups) | 131 (Unhealthy for Sensitive Groups) | 110 (Moderate) | 91 (Moderate) | 67 (Good) | 48 (Good) | 90 (Moderate) | 120 (Unhealthy for Sensitive Groups) |
| pm10 | 70 (Unhealthy for Sensitive Groups) | 83 (Unhealthy) | 83 (Unhealthy) | 70 (Unhealthy for Sensitive Groups) | 120 (Very Unhealthy) | 104 (Unhealthy) | 110 (Very Unhealthy) | 84 (Unhealthy) | 70 (Unhealthy for Sensitive Groups) | 50 (Unhealthy for Sensitive Groups) | 58 (Unhealthy for Sensitive Groups) | 66 (Unhealthy for Sensitive Groups) | 97 (Unhealthy) | 95 (Unhealthy) | 97 (Unhealthy) | 142 (Very Unhealthy) | 153 (Very bad Hazardous) | 148 (Very Unhealthy) | 136 (Very Unhealthy) | 97 (Unhealthy) |
| so2 | 12 (Good) | 14 (Good) | 11 (Good) | 7.6 (Good) | 10 (Good) | 11 (Good) | 14 (Good) | 12 (Good) | 13 (Good) | 8.3 (Good) | 7.6 (Good) | 8.5 (Good) | 11 (Good) | 12 (Good) | 13 (Good) | 11 (Good) | 19 (Good) | 19 (Good) | 13 (Good) | 17 (Good) |
PM10 179 (Very bad Hazardous)
particulate matter (PM10) suspended dustPM2,5 35 (Unhealthy for Sensitive Groups)
particulate matter (PM2.5) dustO3 0.04 (Good)
ozone (O3)NO2 0 (Good)
nitrogen dioxide (NO2)SO2 0 (Good)
sulfur dioxide (SO2)Fuyang Kai Fa Qu
| index | 2022-05-27 |
|---|---|
| pm10 | 56 |
| pm25 | 56 |
| o3 | 0.03 |
| no2 | 0 |
| so2 | 0 |
开发区

| index | 2020-05 | 2020-04 | 2020-03 | 2020-02 | 2020-01 | 2019-12 | 2019-11 | 2019-10 | 2019-09 | 2019-08 | 2019-07 | 2019-06 | 2019-05 | 2019-04 | 2019-03 | 2019-02 | 2019-01 | 2018-12 | 2018-11 | 2018-10 |
|---|---|---|---|---|---|---|---|---|---|---|---|---|---|---|---|---|---|---|---|---|
| pm25 | 29 | 46 | 50 | 60 | 125 | 96 | 75 | 43 | 38 | 29 | 29 | 29 | 34 | 46 | 54 | 120 | 131 | 113 | 92 | 48 |
| co | 784 | 838 | 875 | 995 | 1 | 1 | 953 | 893 | 849 | 835 | 771 | 826 | 905 | 1 | 879 | 1 | 1 | 1 | 1 | 890 |
| no2 | 23 | 34 | 34 | 17 | 35 | 45 | 45 | 38 | 33 | 23 | 26 | 26 | 28 | 29 | 34 | 33 | 52 | 53 | 48 | 47 |
| o3 | 155 | 136 | 110 | 90 | 75 | 54 | 87 | 110 | 166 | 164 | 180 | 184 | 149 | 131 | 110 | 91 | 67 | 48 | 90 | 120 |
| pm10 | 70 | 83 | 83 | 70 | 120 | 104 | 110 | 84 | 70 | 50 | 58 | 66 | 97 | 95 | 97 | 142 | 153 | 148 | 136 | 97 |
| so2 | 12 | 14 | 11 | 7.6 | 10 | 11 | 14 | 12 | 13 | 8.3 | 7.6 | 8.5 | 11 | 12 | 13 | 11 | 19 | 19 | 13 | 17 |