Air Pollution in Bishu Shanzhuang: Real-time Air Quality Index and smog alert.
Pollution and air quality forecast for Bishu Shanzhuang. Today is Tuesday, June 2, 2026. The following air pollution values have been recorded for Bishu Shanzhuang:- particulate matter (PM10) suspended dust - 179 (Very bad Hazardous)
- particulate matter (PM2.5) dust - 35 (Unhealthy for Sensitive Groups)
- ozone (O3) - 0 (Good)
- nitrogen dioxide (NO2) - 0 (Good)
- sulfur dioxide (SO2) - 0 (Good)

What is the air quality in Bishu Shanzhuang today? Is the air polluted in Bishu Shanzhuang?. Is there smog?
What is the level of PM10 today in Bishu Shanzhuang? (particulate matter (PM10) suspended dust)
The current level of particulate matter PM10 in Bishu Shanzhuang is:
179 (Very bad Hazardous)
The highest PM10 values usually occur in month: 100 (November 2018).
The lowest value of particulate matter PM10 pollution in Bishu Shanzhuang is usually recorded in: August (31).
What is the current level of PM2.5 in Bishu Shanzhuang? (particulate matter (PM2.5) dust)
Today's PM2.5 level is:
35 (Unhealthy for Sensitive Groups)
For comparison, the highest level of PM2.5 in Bishu Shanzhuang in the last 7 days was: 56 (Friday, May 27, 2022) and the lowest: 56 (Friday, May 27, 2022).
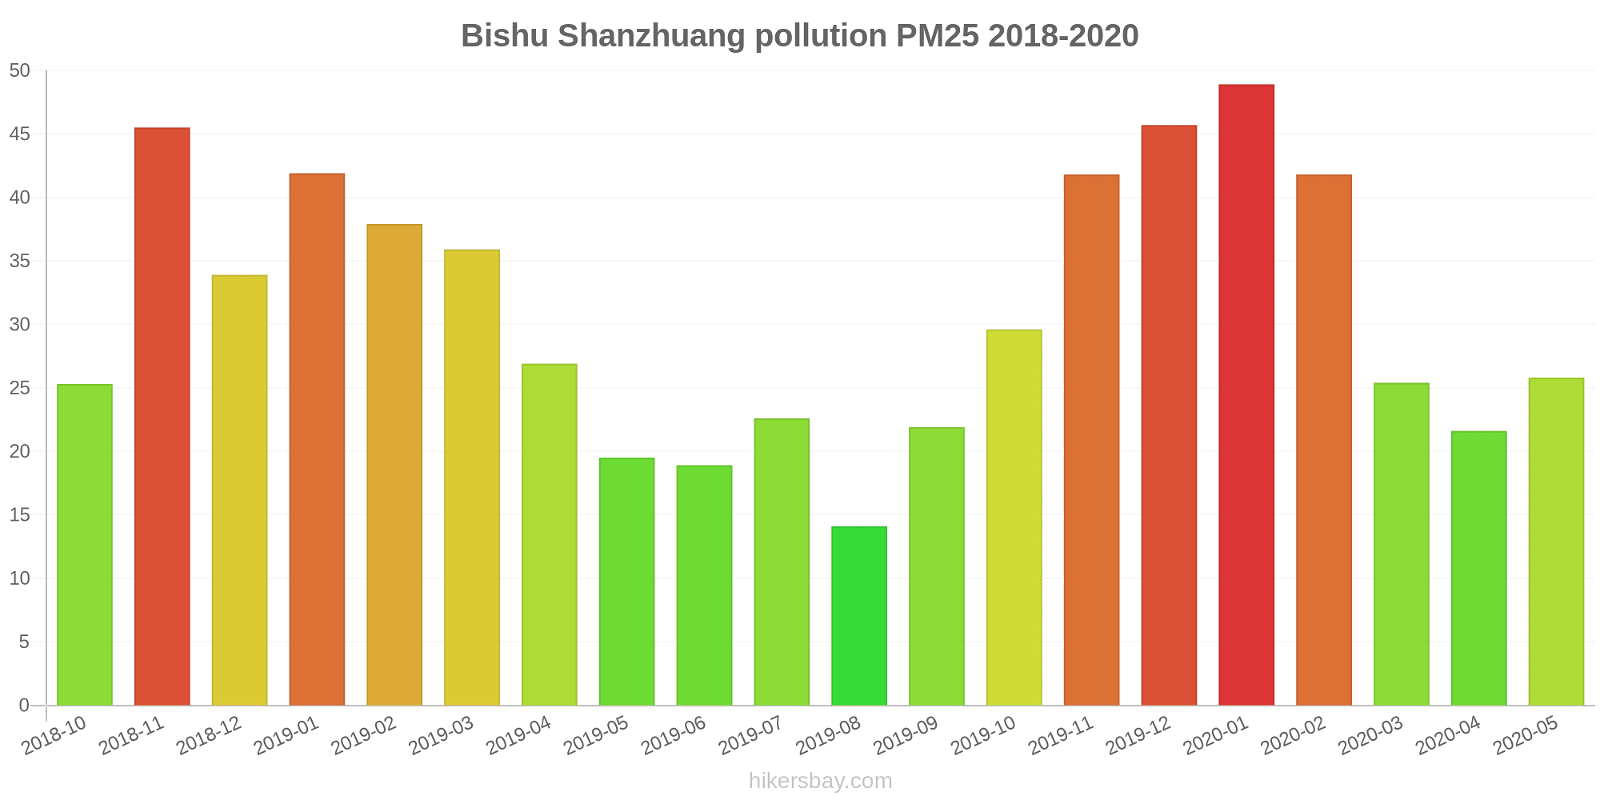
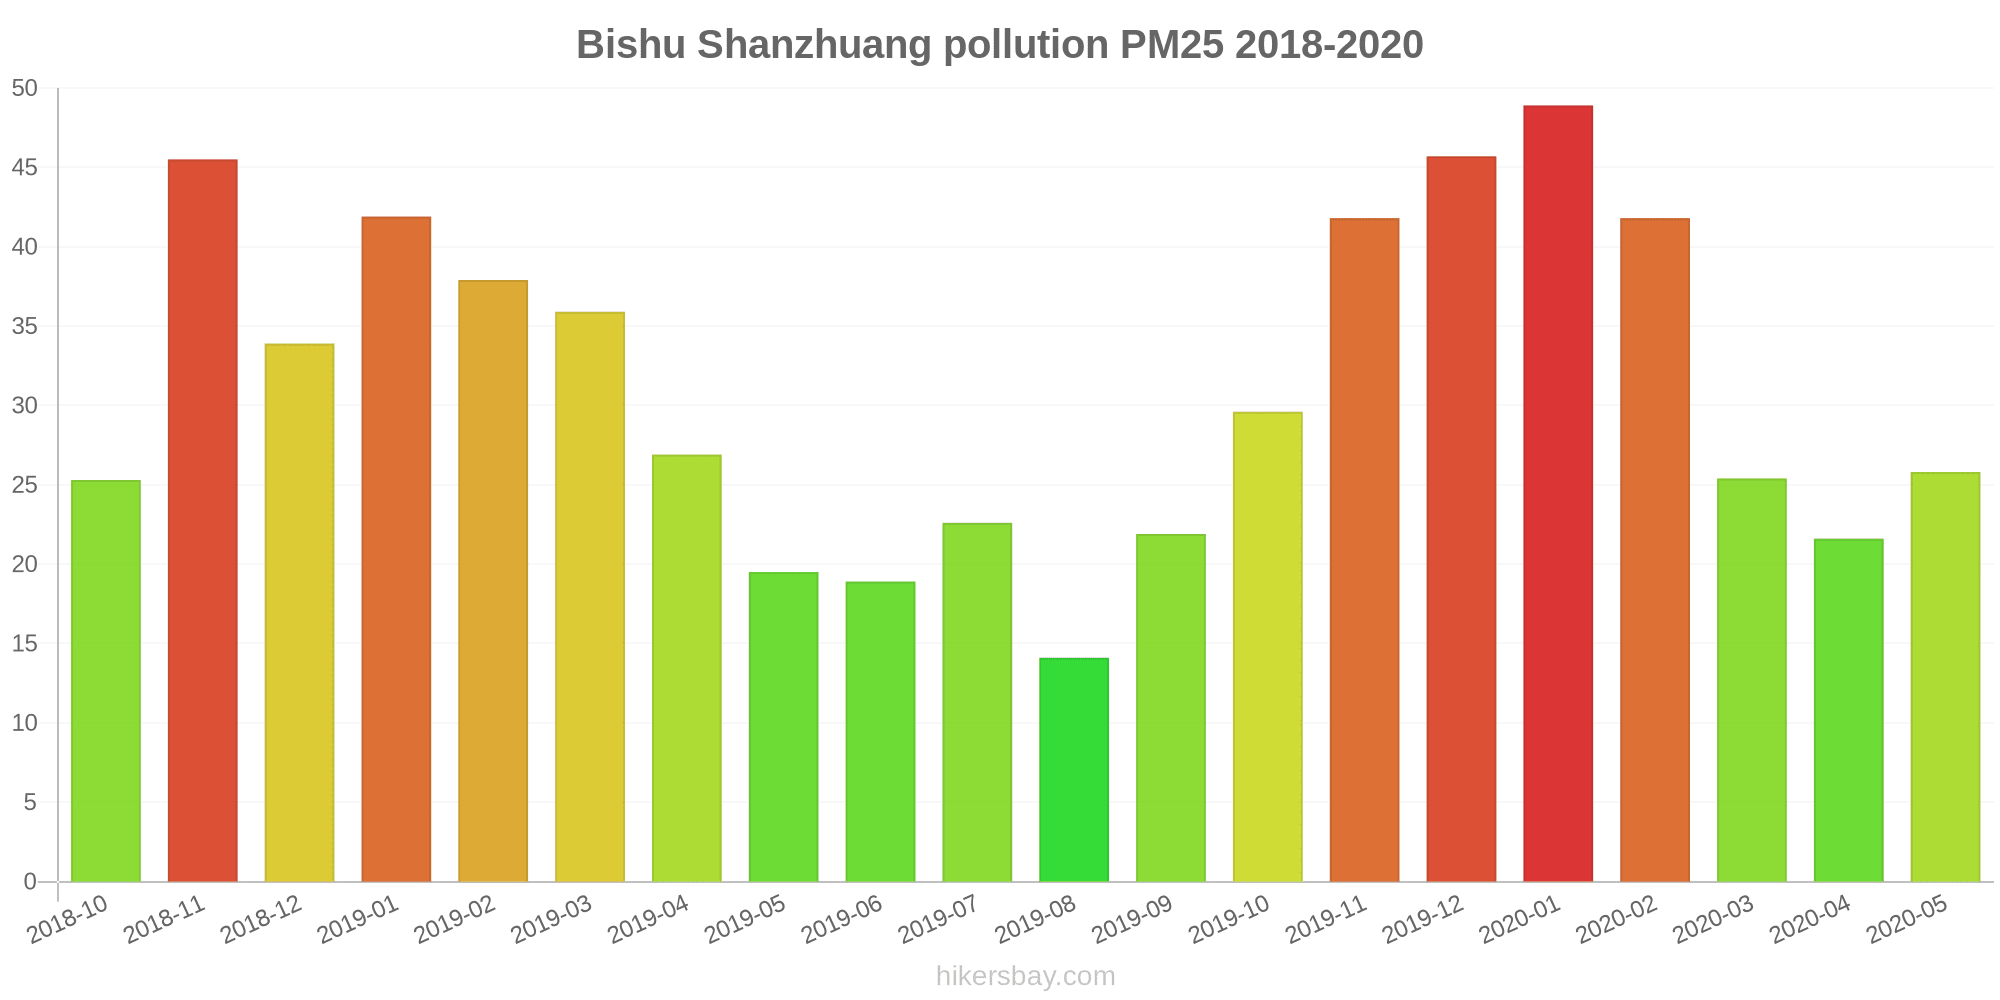
The highest PM2.5 values were recorded: 49 (January 2020).
The lowest level of particulate matter PM2.5 pollution occurs in month: August (14).
How is the O3 level today in Bishu Shanzhuang? (ozone (O3))
0 (Good)
How high is the level of NO2? (nitrogen dioxide (NO2))
0 (Good)
What is the level of SO2 pollution? (sulfur dioxide (SO2))
0 (Good)
Current data Friday, May 27, 2022, 12:00 PM
PM10 179 (Very bad Hazardous)
PM2,5 35 (Unhealthy for Sensitive Groups)
O3 0 (Good)
NO2 0 (Good)
SO2 0 (Good)
Data on air pollution from recent days in Bishu Shanzhuang
index
2022-05-27
pm10
56
Unhealthy for Sensitive Groups
pm25
56
Unhealthy
o3
0
Good
no2
0
Good
so2
0
Good
data source »
Air pollution in Bishu Shanzhuang from October 2018 to May 2020
index
2020-05
2020-04
2020-03
2020-02
2020-01
2019-12
2019-11
2019-10
2019-09
2019-08
2019-07
2019-06
2019-05
2019-04
2019-03
2019-02
2019-01
2018-12
2018-11
2018-10
pm25
26 (Moderate)
22 (Moderate)
25 (Moderate)
42 (Unhealthy for Sensitive Groups)
49 (Unhealthy for Sensitive Groups)
46 (Unhealthy for Sensitive Groups)
42 (Unhealthy for Sensitive Groups)
30 (Moderate)
22 (Moderate)
14 (Moderate)
23 (Moderate)
19 (Moderate)
20 (Moderate)
27 (Moderate)
36 (Unhealthy for Sensitive Groups)
38 (Unhealthy for Sensitive Groups)
42 (Unhealthy for Sensitive Groups)
34 (Moderate)
46 (Unhealthy for Sensitive Groups)
25 (Moderate)
co
824 (Good)
581 (Good)
668 (Good)
1 (Good)
1 (Good)
1 (Good)
1 (Good)
814 (Good)
666 (Good)
626 (Good)
680 (Good)
695 (Good)
578 (Good)
523 (Good)
767 (Good)
1 (Good)
1 (Good)
1 (Good)
1 (Good)
893 (Good)
no2
25 (Good)
29 (Good)
24 (Good)
23 (Good)
42 (Moderate)
41 (Moderate)
38 (Good)
35 (Good)
30 (Good)
20 (Good)
22 (Good)
23 (Good)
25 (Good)
26 (Good)
31 (Good)
28 (Good)
38 (Good)
36 (Good)
45 (Moderate)
38 (Good)
o3
154 (Unhealthy)
127 (Unhealthy for Sensitive Groups)
103 (Moderate)
92 (Moderate)
63 (Good)
55 (Good)
53 (Good)
91 (Moderate)
149 (Unhealthy for Sensitive Groups)
113 (Moderate)
157 (Unhealthy)
174 (Unhealthy)
153 (Unhealthy)
120 (Unhealthy for Sensitive Groups)
102 (Moderate)
78 (Moderate)
57 (Good)
50 (Good)
53 (Good)
57 (Good)
pm10
68 (Unhealthy for Sensitive Groups)
59 (Unhealthy for Sensitive Groups)
45 (Moderate)
55 (Unhealthy for Sensitive Groups)
69 (Unhealthy for Sensitive Groups)
64 (Unhealthy for Sensitive Groups)
77 (Unhealthy for Sensitive Groups)
56 (Unhealthy for Sensitive Groups)
44 (Moderate)
31 (Moderate)
42 (Moderate)
51 (Unhealthy for Sensitive Groups)
56 (Unhealthy for Sensitive Groups)
79 (Unhealthy for Sensitive Groups)
71 (Unhealthy for Sensitive Groups)
66 (Unhealthy for Sensitive Groups)
78 (Unhealthy for Sensitive Groups)
72 (Unhealthy for Sensitive Groups)
100 (Unhealthy)
60 (Unhealthy for Sensitive Groups)
so2
12 (Good)
8.4 (Good)
7.8 (Good)
9.7 (Good)
13 (Good)
13 (Good)
13 (Good)
11 (Good)
11 (Good)
9 (Good)
8.9 (Good)
10 (Good)
9.7 (Good)
11 (Good)
8.5 (Good)
9.6 (Good)
16 (Good)
11 (Good)
9.2 (Good)
5.4 (Good)
data source »
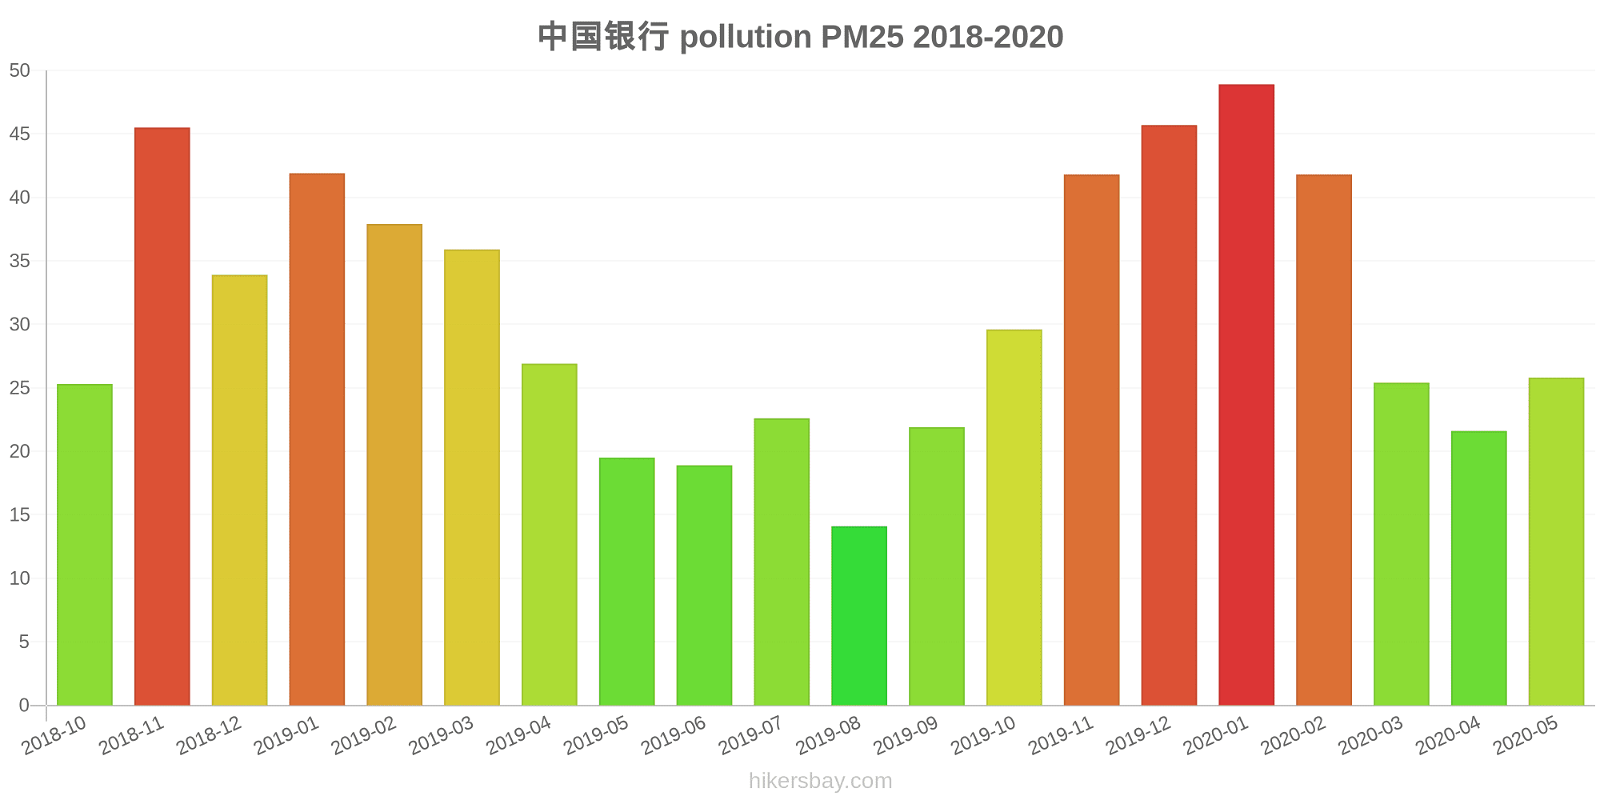
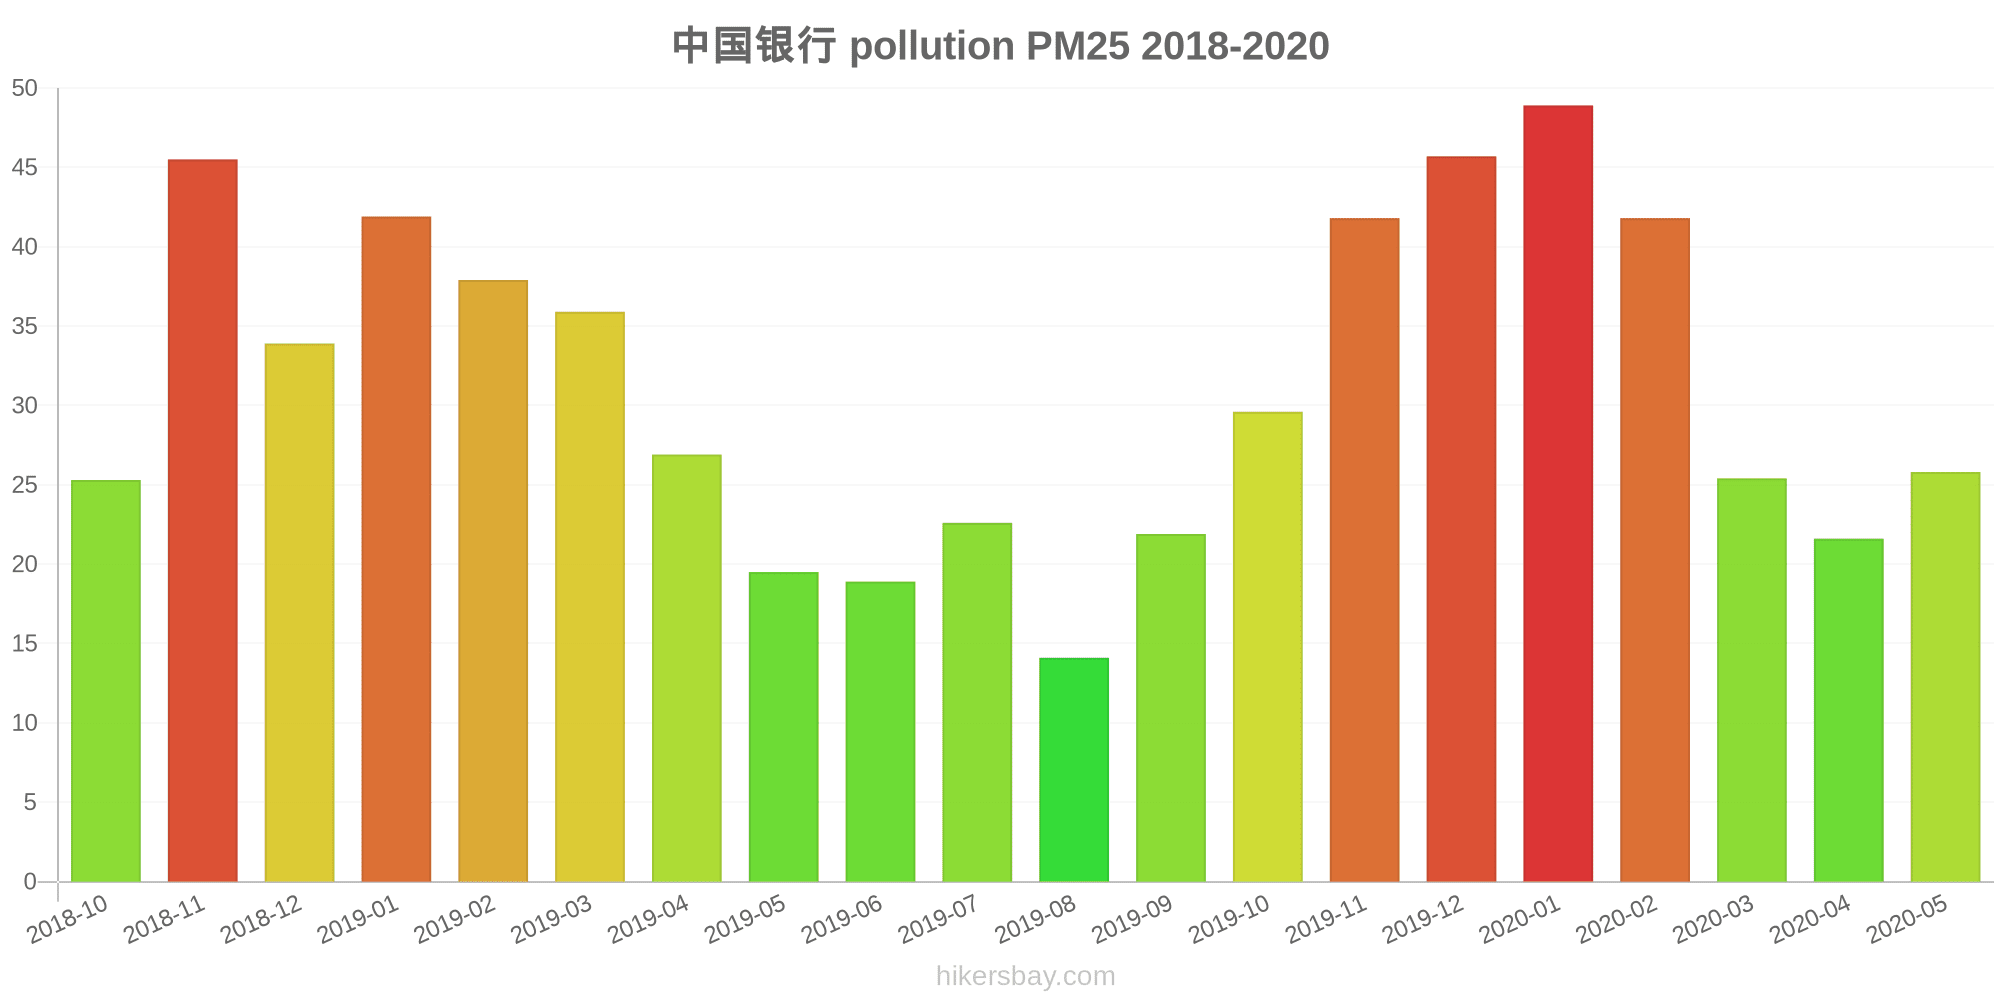
中国银行
Friday, May 27, 2022, 12:00 PM
PM10 179 (Very bad Hazardous)
particulate matter (PM10) suspended dust
PM2,5 35 (Unhealthy for Sensitive Groups)
particulate matter (PM2.5) dust
O3 0.04 (Good)
ozone (O3)
NO2 0 (Good)
nitrogen dioxide (NO2)
SO2 0 (Good)
sulfur dioxide (SO2)
中国银行
index
2022-05-27
pm10
56
pm25
56
o3
0.03
no2
0
so2
0
中国银行
2018-10 2020-05
index
2020-05
2020-04
2020-03
2020-02
2020-01
2019-12
2019-11
2019-10
2019-09
2019-08
2019-07
2019-06
2019-05
2019-04
2019-03
2019-02
2019-01
2018-12
2018-11
2018-10
pm25
26
22
25
42
49
46
42
30
22
14
23
19
20
27
36
38
42
34
46
25
co
824
581
668
1
1
1
1
814
666
626
680
695
578
523
767
1
1
1
1
893
no2
25
29
24
23
42
41
38
35
30
20
22
23
25
26
31
28
38
36
45
38
o3
154
127
103
92
63
55
53
91
149
113
157
174
153
120
102
78
57
50
53
57
pm10
68
59
45
55
69
64
77
56
44
31
42
51
56
79
71
66
78
72
100
60
so2
12
8.4
7.8
9.7
13
13
13
11
11
9
8.9
10
9.7
11
8.5
9.6
16
11
9.2
5.4
* Pollution data source:
https://openaq.org
(ChinaAQIData)
The data is licensed under CC-By 4.0
PM10 179 (Very bad Hazardous)
PM2,5 35 (Unhealthy for Sensitive Groups)
O3 0 (Good)
NO2 0 (Good)
SO2 0 (Good)
Data on air pollution from recent days in Bishu Shanzhuang
| index | 2022-05-27 |
|---|---|
| pm10 | 56 Unhealthy for Sensitive Groups |
| pm25 | 56 Unhealthy |
| o3 | 0 Good |
| no2 | 0 Good |
| so2 | 0 Good |
| index | 2020-05 | 2020-04 | 2020-03 | 2020-02 | 2020-01 | 2019-12 | 2019-11 | 2019-10 | 2019-09 | 2019-08 | 2019-07 | 2019-06 | 2019-05 | 2019-04 | 2019-03 | 2019-02 | 2019-01 | 2018-12 | 2018-11 | 2018-10 |
|---|---|---|---|---|---|---|---|---|---|---|---|---|---|---|---|---|---|---|---|---|
| pm25 | 26 (Moderate) | 22 (Moderate) | 25 (Moderate) | 42 (Unhealthy for Sensitive Groups) | 49 (Unhealthy for Sensitive Groups) | 46 (Unhealthy for Sensitive Groups) | 42 (Unhealthy for Sensitive Groups) | 30 (Moderate) | 22 (Moderate) | 14 (Moderate) | 23 (Moderate) | 19 (Moderate) | 20 (Moderate) | 27 (Moderate) | 36 (Unhealthy for Sensitive Groups) | 38 (Unhealthy for Sensitive Groups) | 42 (Unhealthy for Sensitive Groups) | 34 (Moderate) | 46 (Unhealthy for Sensitive Groups) | 25 (Moderate) |
| co | 824 (Good) | 581 (Good) | 668 (Good) | 1 (Good) | 1 (Good) | 1 (Good) | 1 (Good) | 814 (Good) | 666 (Good) | 626 (Good) | 680 (Good) | 695 (Good) | 578 (Good) | 523 (Good) | 767 (Good) | 1 (Good) | 1 (Good) | 1 (Good) | 1 (Good) | 893 (Good) |
| no2 | 25 (Good) | 29 (Good) | 24 (Good) | 23 (Good) | 42 (Moderate) | 41 (Moderate) | 38 (Good) | 35 (Good) | 30 (Good) | 20 (Good) | 22 (Good) | 23 (Good) | 25 (Good) | 26 (Good) | 31 (Good) | 28 (Good) | 38 (Good) | 36 (Good) | 45 (Moderate) | 38 (Good) |
| o3 | 154 (Unhealthy) | 127 (Unhealthy for Sensitive Groups) | 103 (Moderate) | 92 (Moderate) | 63 (Good) | 55 (Good) | 53 (Good) | 91 (Moderate) | 149 (Unhealthy for Sensitive Groups) | 113 (Moderate) | 157 (Unhealthy) | 174 (Unhealthy) | 153 (Unhealthy) | 120 (Unhealthy for Sensitive Groups) | 102 (Moderate) | 78 (Moderate) | 57 (Good) | 50 (Good) | 53 (Good) | 57 (Good) |
| pm10 | 68 (Unhealthy for Sensitive Groups) | 59 (Unhealthy for Sensitive Groups) | 45 (Moderate) | 55 (Unhealthy for Sensitive Groups) | 69 (Unhealthy for Sensitive Groups) | 64 (Unhealthy for Sensitive Groups) | 77 (Unhealthy for Sensitive Groups) | 56 (Unhealthy for Sensitive Groups) | 44 (Moderate) | 31 (Moderate) | 42 (Moderate) | 51 (Unhealthy for Sensitive Groups) | 56 (Unhealthy for Sensitive Groups) | 79 (Unhealthy for Sensitive Groups) | 71 (Unhealthy for Sensitive Groups) | 66 (Unhealthy for Sensitive Groups) | 78 (Unhealthy for Sensitive Groups) | 72 (Unhealthy for Sensitive Groups) | 100 (Unhealthy) | 60 (Unhealthy for Sensitive Groups) |
| so2 | 12 (Good) | 8.4 (Good) | 7.8 (Good) | 9.7 (Good) | 13 (Good) | 13 (Good) | 13 (Good) | 11 (Good) | 11 (Good) | 9 (Good) | 8.9 (Good) | 10 (Good) | 9.7 (Good) | 11 (Good) | 8.5 (Good) | 9.6 (Good) | 16 (Good) | 11 (Good) | 9.2 (Good) | 5.4 (Good) |
PM10 179 (Very bad Hazardous)
particulate matter (PM10) suspended dustPM2,5 35 (Unhealthy for Sensitive Groups)
particulate matter (PM2.5) dustO3 0.04 (Good)
ozone (O3)NO2 0 (Good)
nitrogen dioxide (NO2)SO2 0 (Good)
sulfur dioxide (SO2)中国银行
| index | 2022-05-27 |
|---|---|
| pm10 | 56 |
| pm25 | 56 |
| o3 | 0.03 |
| no2 | 0 |
| so2 | 0 |
中国银行
| index | 2020-05 | 2020-04 | 2020-03 | 2020-02 | 2020-01 | 2019-12 | 2019-11 | 2019-10 | 2019-09 | 2019-08 | 2019-07 | 2019-06 | 2019-05 | 2019-04 | 2019-03 | 2019-02 | 2019-01 | 2018-12 | 2018-11 | 2018-10 |
|---|---|---|---|---|---|---|---|---|---|---|---|---|---|---|---|---|---|---|---|---|
| pm25 | 26 | 22 | 25 | 42 | 49 | 46 | 42 | 30 | 22 | 14 | 23 | 19 | 20 | 27 | 36 | 38 | 42 | 34 | 46 | 25 |
| co | 824 | 581 | 668 | 1 | 1 | 1 | 1 | 814 | 666 | 626 | 680 | 695 | 578 | 523 | 767 | 1 | 1 | 1 | 1 | 893 |
| no2 | 25 | 29 | 24 | 23 | 42 | 41 | 38 | 35 | 30 | 20 | 22 | 23 | 25 | 26 | 31 | 28 | 38 | 36 | 45 | 38 |
| o3 | 154 | 127 | 103 | 92 | 63 | 55 | 53 | 91 | 149 | 113 | 157 | 174 | 153 | 120 | 102 | 78 | 57 | 50 | 53 | 57 |
| pm10 | 68 | 59 | 45 | 55 | 69 | 64 | 77 | 56 | 44 | 31 | 42 | 51 | 56 | 79 | 71 | 66 | 78 | 72 | 100 | 60 |
| so2 | 12 | 8.4 | 7.8 | 9.7 | 13 | 13 | 13 | 11 | 11 | 9 | 8.9 | 10 | 9.7 | 11 | 8.5 | 9.6 | 16 | 11 | 9.2 | 5.4 |