Air Pollution in Yaobu: Real-time Air Quality Index and smog alert.
Pollution and air quality forecast for Yaobu. Today is Tuesday, June 16, 2026. The following air pollution values have been recorded for Yaobu:- particulate matter (PM10) suspended dust - 7 (Good)
- particulate matter (PM2.5) dust - 2 (Good)
- carbon monoxide (CO) - 100 (Good)
- nitrogen dioxide (NO2) - 8 (Good)
- ozone (O3) - 0 (Good)
- sulfur dioxide (SO2) - 9 (Good)

What is the air quality in Yaobu today? Is the air polluted in Yaobu?. Is there smog?
What is the level of PM10 today in Yaobu? (particulate matter (PM10) suspended dust)
The current level of particulate matter PM10 in Yaobu is:
7 (Good)
The highest PM10 values usually occur in month: 77 (November 2018).
The lowest value of particulate matter PM10 pollution in Yaobu is usually recorded in: June (30).
What is the current level of PM2.5 in Yaobu? (particulate matter (PM2.5) dust)
Today's PM2.5 level is:
2 (Good)
For comparison, the highest level of PM2.5 in Yaobu in the last 7 days was: 24 (Friday, May 27, 2022) and the lowest: 24 (Friday, May 27, 2022).
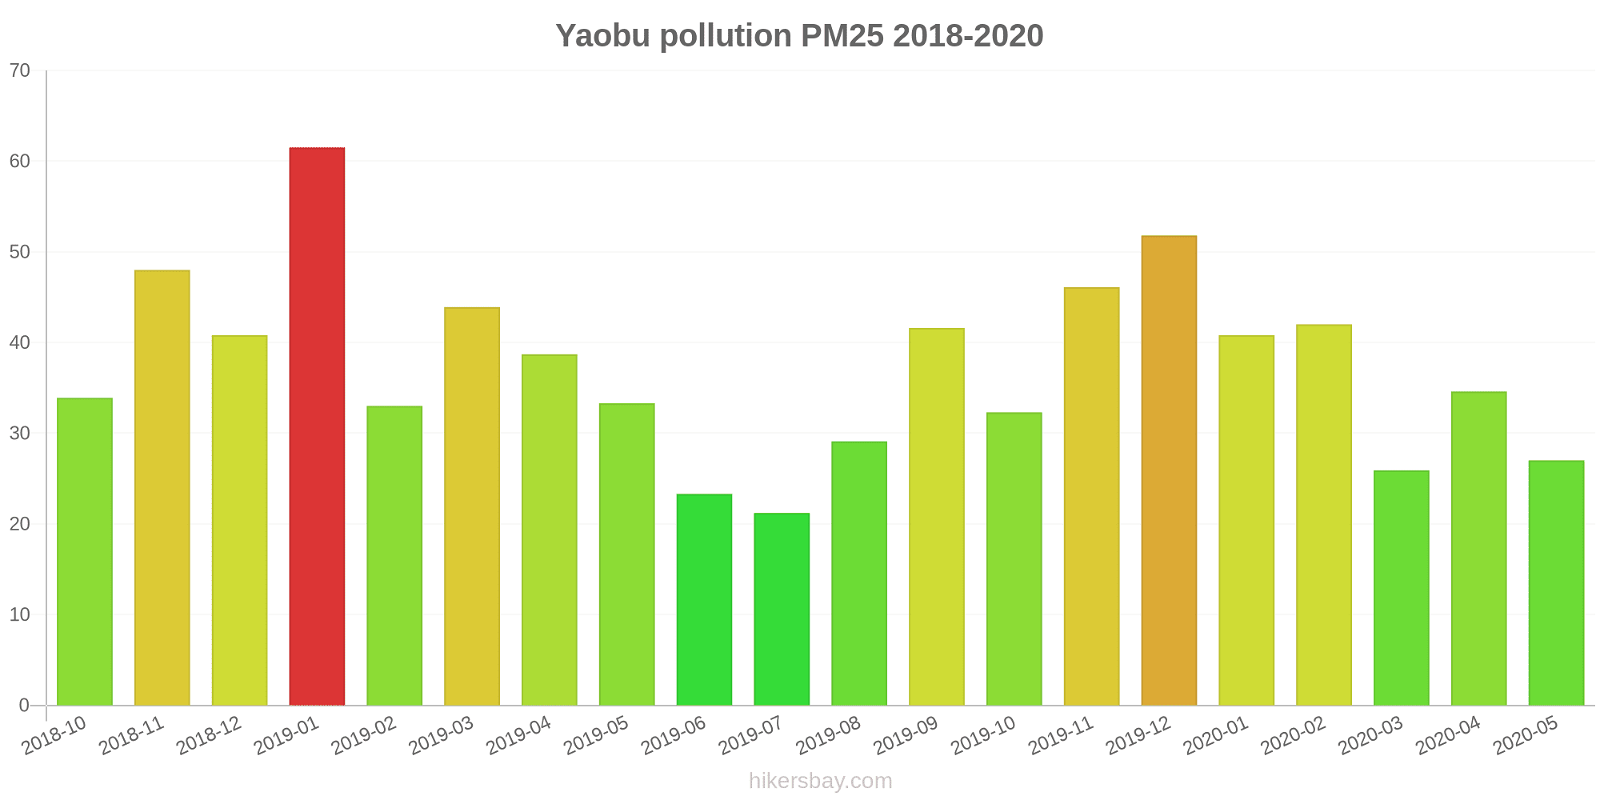
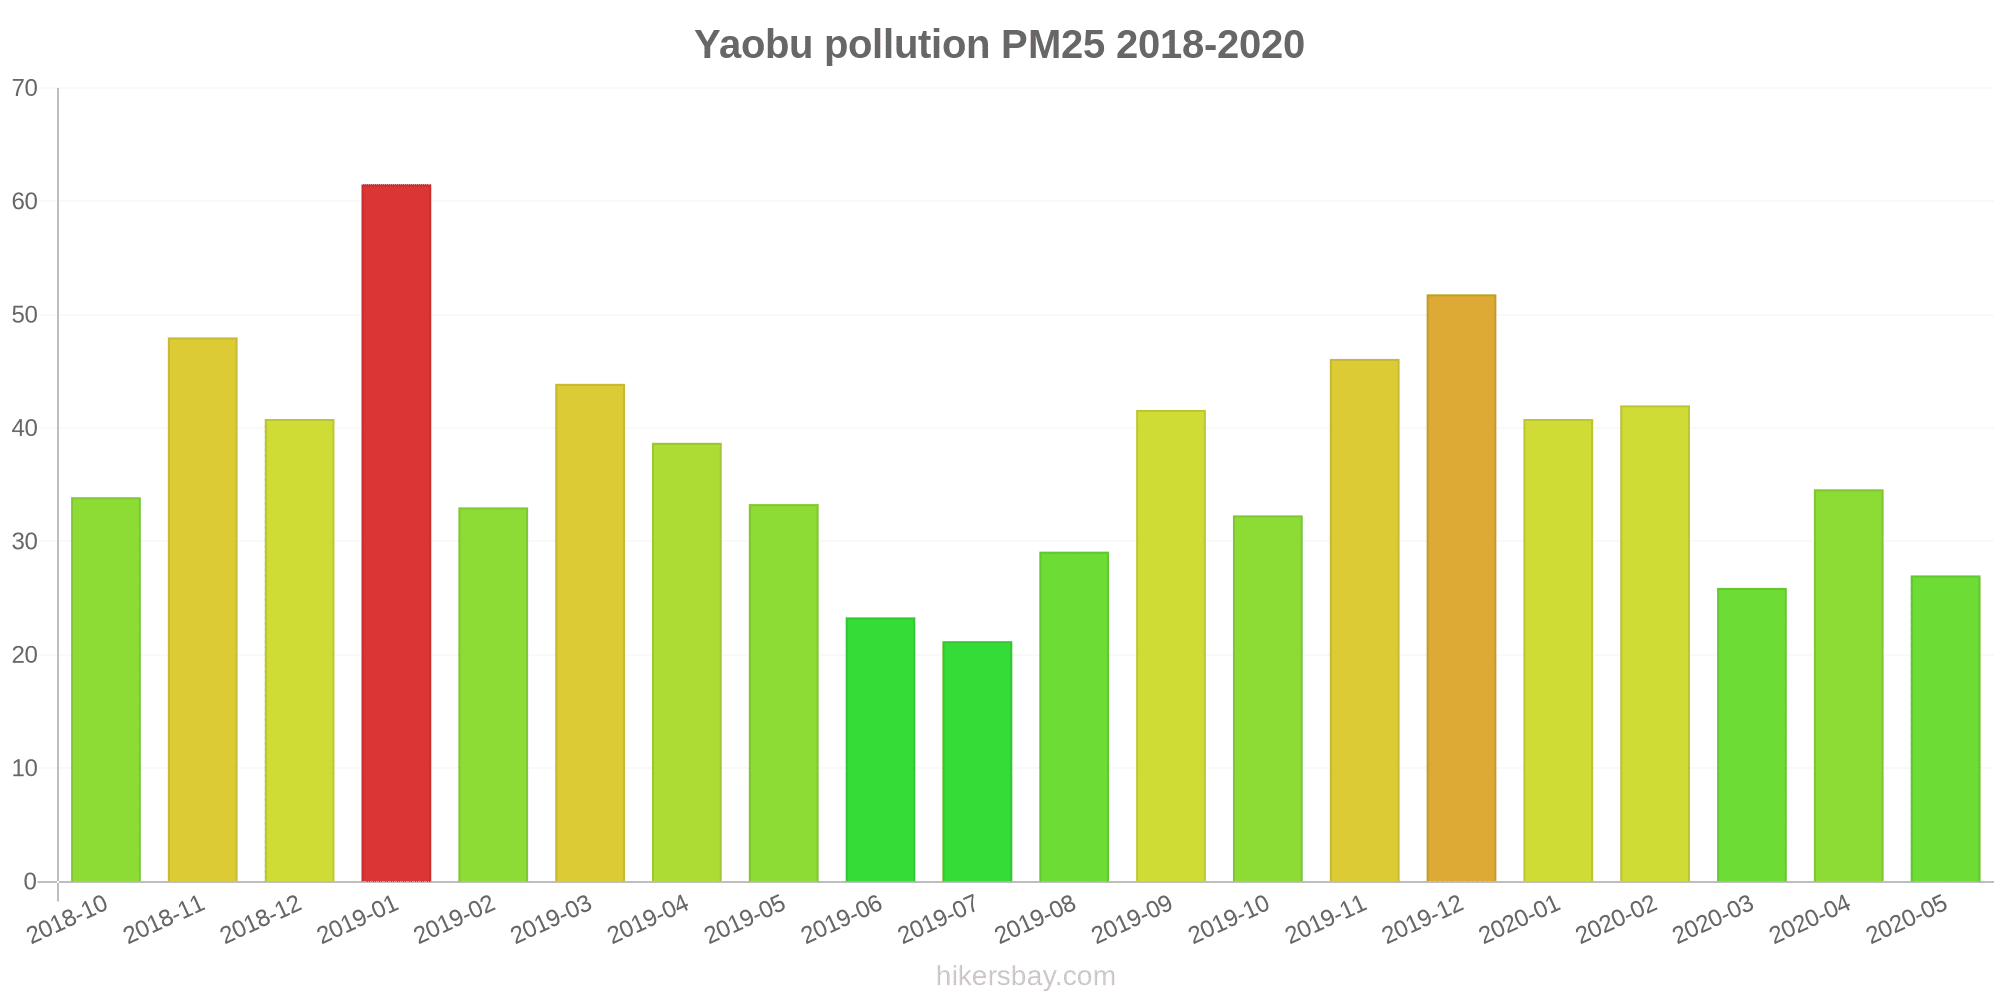
The highest PM2.5 values were recorded: 62 (January 2019).
The lowest level of particulate matter PM2.5 pollution occurs in month: July (21).
How high is the CO level? (carbon monoxide (CO))
100 (Good)
How high is the level of NO2? (nitrogen dioxide (NO2))
8 (Good)
How is the O3 level today in Yaobu? (ozone (O3))
0 (Good)
What is the level of SO2 pollution? (sulfur dioxide (SO2))
9 (Good)
Current data Friday, May 27, 2022, 12:00 PM
PM10 7 (Good)
PM2,5 2 (Good)
CO 100 (Good)
NO2 8 (Good)
O3 0 (Good)
SO2 9 (Good)
Data on air pollution from recent days in Yaobu
index
2022-05-27
pm10
32
Moderate
pm25
24
Moderate
co
468
Good
no2
21
Good
o3
32
Good
so2
5
Good
data source »
Air pollution in Yaobu from October 2018 to May 2020
index
2020-05
2020-04
2020-03
2020-02
2020-01
2019-12
2019-11
2019-10
2019-09
2019-08
2019-07
2019-06
2019-05
2019-04
2019-03
2019-02
2019-01
2018-12
2018-11
2018-10
pm25
27 (Moderate)
35 (Moderate)
26 (Moderate)
42 (Unhealthy for Sensitive Groups)
41 (Unhealthy for Sensitive Groups)
52 (Unhealthy for Sensitive Groups)
46 (Unhealthy for Sensitive Groups)
32 (Moderate)
42 (Unhealthy for Sensitive Groups)
29 (Moderate)
21 (Moderate)
23 (Moderate)
33 (Moderate)
39 (Unhealthy for Sensitive Groups)
44 (Unhealthy for Sensitive Groups)
33 (Moderate)
62 (Unhealthy)
41 (Unhealthy for Sensitive Groups)
48 (Unhealthy for Sensitive Groups)
34 (Moderate)
co
845 (Good)
881 (Good)
850 (Good)
893 (Good)
1 (Good)
1 (Good)
944 (Good)
883 (Good)
890 (Good)
893 (Good)
779 (Good)
800 (Good)
828 (Good)
903 (Good)
1 (Good)
1 (Good)
1 (Good)
1 (Good)
1 (Good)
966 (Good)
no2
17 (Good)
30 (Good)
21 (Good)
20 (Good)
25 (Good)
42 (Moderate)
31 (Good)
27 (Good)
30 (Good)
22 (Good)
20 (Good)
21 (Good)
22 (Good)
25 (Good)
30 (Good)
22 (Good)
35 (Good)
30 (Good)
37 (Good)
28 (Good)
o3
119 (Moderate)
99 (Moderate)
66 (Good)
69 (Good)
63 (Good)
79 (Moderate)
102 (Moderate)
101 (Moderate)
136 (Unhealthy for Sensitive Groups)
118 (Moderate)
90 (Moderate)
95 (Moderate)
106 (Moderate)
90 (Moderate)
47 (Good)
36 (Good)
50 (Good)
40 (Good)
80 (Moderate)
66 (Good)
pm10
43 (Moderate)
51 (Unhealthy for Sensitive Groups)
34 (Moderate)
45 (Moderate)
45 (Moderate)
74 (Unhealthy for Sensitive Groups)
76 (Unhealthy for Sensitive Groups)
52 (Unhealthy for Sensitive Groups)
66 (Unhealthy for Sensitive Groups)
47 (Moderate)
33 (Moderate)
30 (Moderate)
53 (Unhealthy for Sensitive Groups)
49 (Moderate)
58 (Unhealthy for Sensitive Groups)
41 (Moderate)
76 (Unhealthy for Sensitive Groups)
58 (Unhealthy for Sensitive Groups)
77 (Unhealthy for Sensitive Groups)
58 (Unhealthy for Sensitive Groups)
so2
4.9 (Good)
8.4 (Good)
5.6 (Good)
4.4 (Good)
9.5 (Good)
21 (Good)
19 (Good)
12 (Good)
17 (Good)
10 (Good)
6.3 (Good)
6.1 (Good)
11 (Good)
7.3 (Good)
9.1 (Good)
12 (Good)
18 (Good)
17 (Good)
19 (Good)
15 (Good)
data source »
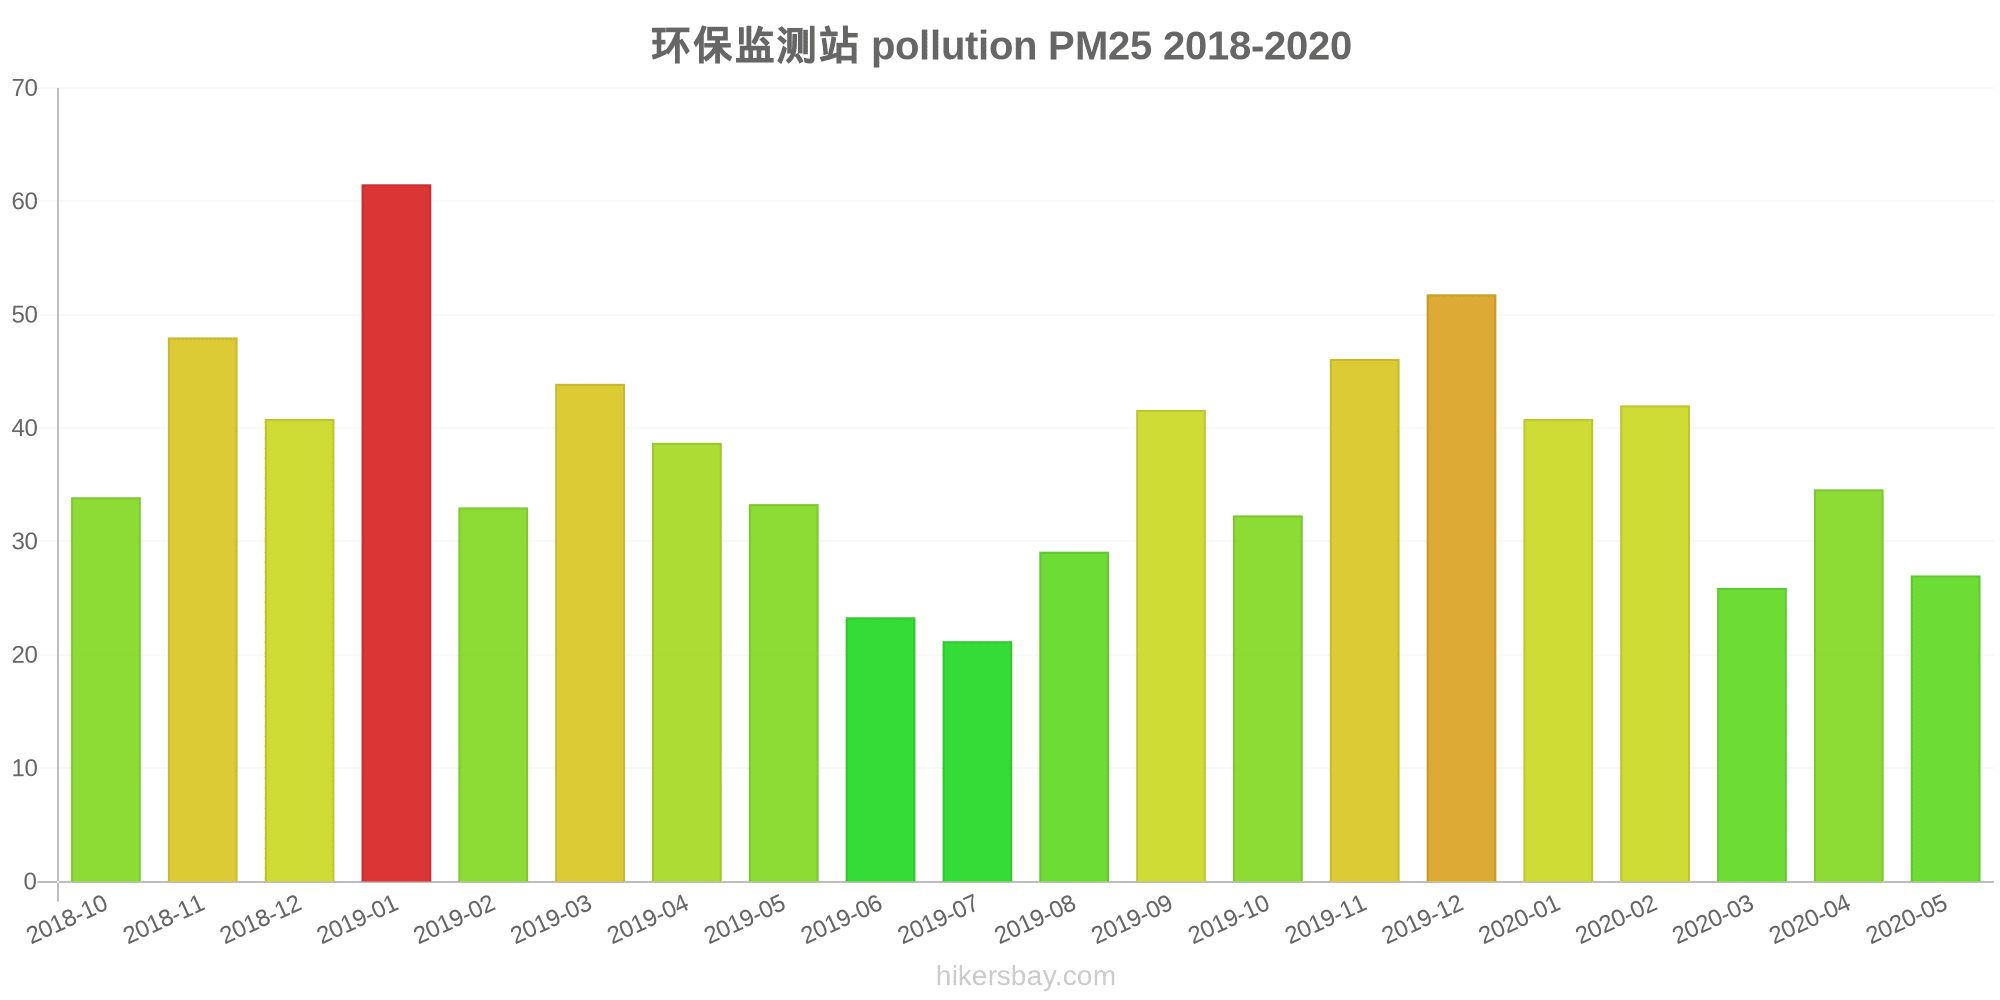
环保监测站
Friday, May 27, 2022, 12:00 PM
PM10 6.7 (Good)
particulate matter (PM10) suspended dust
PM2,5 1.7 (Good)
particulate matter (PM2.5) dust
CO 100 (Good)
carbon monoxide (CO)
NO2 7.6 (Good)
nitrogen dioxide (NO2)
O3 0.02 (Good)
ozone (O3)
SO2 8.6 (Good)
sulfur dioxide (SO2)
环保监测站
index
2022-05-27
pm10
32
pm25
24
co
468
no2
21
o3
32
so2
4.6
环保监测站
2018-10 2020-05

index
2020-05
2020-04
2020-03
2020-02
2020-01
2019-12
2019-11
2019-10
2019-09
2019-08
2019-07
2019-06
2019-05
2019-04
2019-03
2019-02
2019-01
2018-12
2018-11
2018-10
pm25
27
35
26
42
41
52
46
32
42
29
21
23
33
39
44
33
62
41
48
34
co
845
881
850
893
1
1
944
883
890
893
779
800
828
903
1
1
1
1
1
966
no2
17
30
21
20
25
42
31
27
30
22
20
21
22
25
30
22
35
30
37
28
o3
119
99
66
69
63
79
102
101
136
118
90
95
106
90
47
36
50
40
80
66
pm10
43
51
34
45
45
74
76
52
66
47
33
30
53
49
58
41
76
58
77
58
so2
4.9
8.4
5.6
4.4
9.5
21
19
12
17
10
6.3
6.1
11
7.3
9.1
12
18
17
19
15
* Pollution data source:
https://openaq.org
(ChinaAQIData)
The data is licensed under CC-By 4.0
PM10 7 (Good)
PM2,5 2 (Good)
CO 100 (Good)
NO2 8 (Good)
O3 0 (Good)
SO2 9 (Good)
Data on air pollution from recent days in Yaobu
| index | 2022-05-27 |
|---|---|
| pm10 | 32 Moderate |
| pm25 | 24 Moderate |
| co | 468 Good |
| no2 | 21 Good |
| o3 | 32 Good |
| so2 | 5 Good |
| index | 2020-05 | 2020-04 | 2020-03 | 2020-02 | 2020-01 | 2019-12 | 2019-11 | 2019-10 | 2019-09 | 2019-08 | 2019-07 | 2019-06 | 2019-05 | 2019-04 | 2019-03 | 2019-02 | 2019-01 | 2018-12 | 2018-11 | 2018-10 |
|---|---|---|---|---|---|---|---|---|---|---|---|---|---|---|---|---|---|---|---|---|
| pm25 | 27 (Moderate) | 35 (Moderate) | 26 (Moderate) | 42 (Unhealthy for Sensitive Groups) | 41 (Unhealthy for Sensitive Groups) | 52 (Unhealthy for Sensitive Groups) | 46 (Unhealthy for Sensitive Groups) | 32 (Moderate) | 42 (Unhealthy for Sensitive Groups) | 29 (Moderate) | 21 (Moderate) | 23 (Moderate) | 33 (Moderate) | 39 (Unhealthy for Sensitive Groups) | 44 (Unhealthy for Sensitive Groups) | 33 (Moderate) | 62 (Unhealthy) | 41 (Unhealthy for Sensitive Groups) | 48 (Unhealthy for Sensitive Groups) | 34 (Moderate) |
| co | 845 (Good) | 881 (Good) | 850 (Good) | 893 (Good) | 1 (Good) | 1 (Good) | 944 (Good) | 883 (Good) | 890 (Good) | 893 (Good) | 779 (Good) | 800 (Good) | 828 (Good) | 903 (Good) | 1 (Good) | 1 (Good) | 1 (Good) | 1 (Good) | 1 (Good) | 966 (Good) |
| no2 | 17 (Good) | 30 (Good) | 21 (Good) | 20 (Good) | 25 (Good) | 42 (Moderate) | 31 (Good) | 27 (Good) | 30 (Good) | 22 (Good) | 20 (Good) | 21 (Good) | 22 (Good) | 25 (Good) | 30 (Good) | 22 (Good) | 35 (Good) | 30 (Good) | 37 (Good) | 28 (Good) |
| o3 | 119 (Moderate) | 99 (Moderate) | 66 (Good) | 69 (Good) | 63 (Good) | 79 (Moderate) | 102 (Moderate) | 101 (Moderate) | 136 (Unhealthy for Sensitive Groups) | 118 (Moderate) | 90 (Moderate) | 95 (Moderate) | 106 (Moderate) | 90 (Moderate) | 47 (Good) | 36 (Good) | 50 (Good) | 40 (Good) | 80 (Moderate) | 66 (Good) |
| pm10 | 43 (Moderate) | 51 (Unhealthy for Sensitive Groups) | 34 (Moderate) | 45 (Moderate) | 45 (Moderate) | 74 (Unhealthy for Sensitive Groups) | 76 (Unhealthy for Sensitive Groups) | 52 (Unhealthy for Sensitive Groups) | 66 (Unhealthy for Sensitive Groups) | 47 (Moderate) | 33 (Moderate) | 30 (Moderate) | 53 (Unhealthy for Sensitive Groups) | 49 (Moderate) | 58 (Unhealthy for Sensitive Groups) | 41 (Moderate) | 76 (Unhealthy for Sensitive Groups) | 58 (Unhealthy for Sensitive Groups) | 77 (Unhealthy for Sensitive Groups) | 58 (Unhealthy for Sensitive Groups) |
| so2 | 4.9 (Good) | 8.4 (Good) | 5.6 (Good) | 4.4 (Good) | 9.5 (Good) | 21 (Good) | 19 (Good) | 12 (Good) | 17 (Good) | 10 (Good) | 6.3 (Good) | 6.1 (Good) | 11 (Good) | 7.3 (Good) | 9.1 (Good) | 12 (Good) | 18 (Good) | 17 (Good) | 19 (Good) | 15 (Good) |
PM10 6.7 (Good)
particulate matter (PM10) suspended dustPM2,5 1.7 (Good)
particulate matter (PM2.5) dustCO 100 (Good)
carbon monoxide (CO)NO2 7.6 (Good)
nitrogen dioxide (NO2)O3 0.02 (Good)
ozone (O3)SO2 8.6 (Good)
sulfur dioxide (SO2)环保监测站
| index | 2022-05-27 |
|---|---|
| pm10 | 32 |
| pm25 | 24 |
| co | 468 |
| no2 | 21 |
| o3 | 32 |
| so2 | 4.6 |
环保监测站
| index | 2020-05 | 2020-04 | 2020-03 | 2020-02 | 2020-01 | 2019-12 | 2019-11 | 2019-10 | 2019-09 | 2019-08 | 2019-07 | 2019-06 | 2019-05 | 2019-04 | 2019-03 | 2019-02 | 2019-01 | 2018-12 | 2018-11 | 2018-10 |
|---|---|---|---|---|---|---|---|---|---|---|---|---|---|---|---|---|---|---|---|---|
| pm25 | 27 | 35 | 26 | 42 | 41 | 52 | 46 | 32 | 42 | 29 | 21 | 23 | 33 | 39 | 44 | 33 | 62 | 41 | 48 | 34 |
| co | 845 | 881 | 850 | 893 | 1 | 1 | 944 | 883 | 890 | 893 | 779 | 800 | 828 | 903 | 1 | 1 | 1 | 1 | 1 | 966 |
| no2 | 17 | 30 | 21 | 20 | 25 | 42 | 31 | 27 | 30 | 22 | 20 | 21 | 22 | 25 | 30 | 22 | 35 | 30 | 37 | 28 |
| o3 | 119 | 99 | 66 | 69 | 63 | 79 | 102 | 101 | 136 | 118 | 90 | 95 | 106 | 90 | 47 | 36 | 50 | 40 | 80 | 66 |
| pm10 | 43 | 51 | 34 | 45 | 45 | 74 | 76 | 52 | 66 | 47 | 33 | 30 | 53 | 49 | 58 | 41 | 76 | 58 | 77 | 58 |
| so2 | 4.9 | 8.4 | 5.6 | 4.4 | 9.5 | 21 | 19 | 12 | 17 | 10 | 6.3 | 6.1 | 11 | 7.3 | 9.1 | 12 | 18 | 17 | 19 | 15 |