Air Pollution in Xinglongzhuang: Real-time Air Quality Index and smog alert.
Pollution and air quality forecast for Xinglongzhuang. Today is Tuesday, June 2, 2026. The following air pollution values have been recorded for Xinglongzhuang:- particulate matter (PM10) suspended dust - 179 (Very bad Hazardous)
- particulate matter (PM2.5) dust - 35 (Unhealthy for Sensitive Groups)
- ozone (O3) - 0 (Good)
- nitrogen dioxide (NO2) - 0 (Good)
- sulfur dioxide (SO2) - 0 (Good)

What is the air quality in Xinglongzhuang today? Is the air polluted in Xinglongzhuang?. Is there smog?
What is the level of PM10 today in Xinglongzhuang? (particulate matter (PM10) suspended dust)
The current level of particulate matter PM10 in Xinglongzhuang is:
179 (Very bad Hazardous)
The highest PM10 values usually occur in month: 148 (January 2019).
The lowest value of particulate matter PM10 pollution in Xinglongzhuang is usually recorded in: August (47).
What is the current level of PM2.5 in Xinglongzhuang? (particulate matter (PM2.5) dust)
Today's PM2.5 level is:
35 (Unhealthy for Sensitive Groups)
For comparison, the highest level of PM2.5 in Xinglongzhuang in the last 7 days was: 56 (Friday, May 27, 2022) and the lowest: 56 (Friday, May 27, 2022).
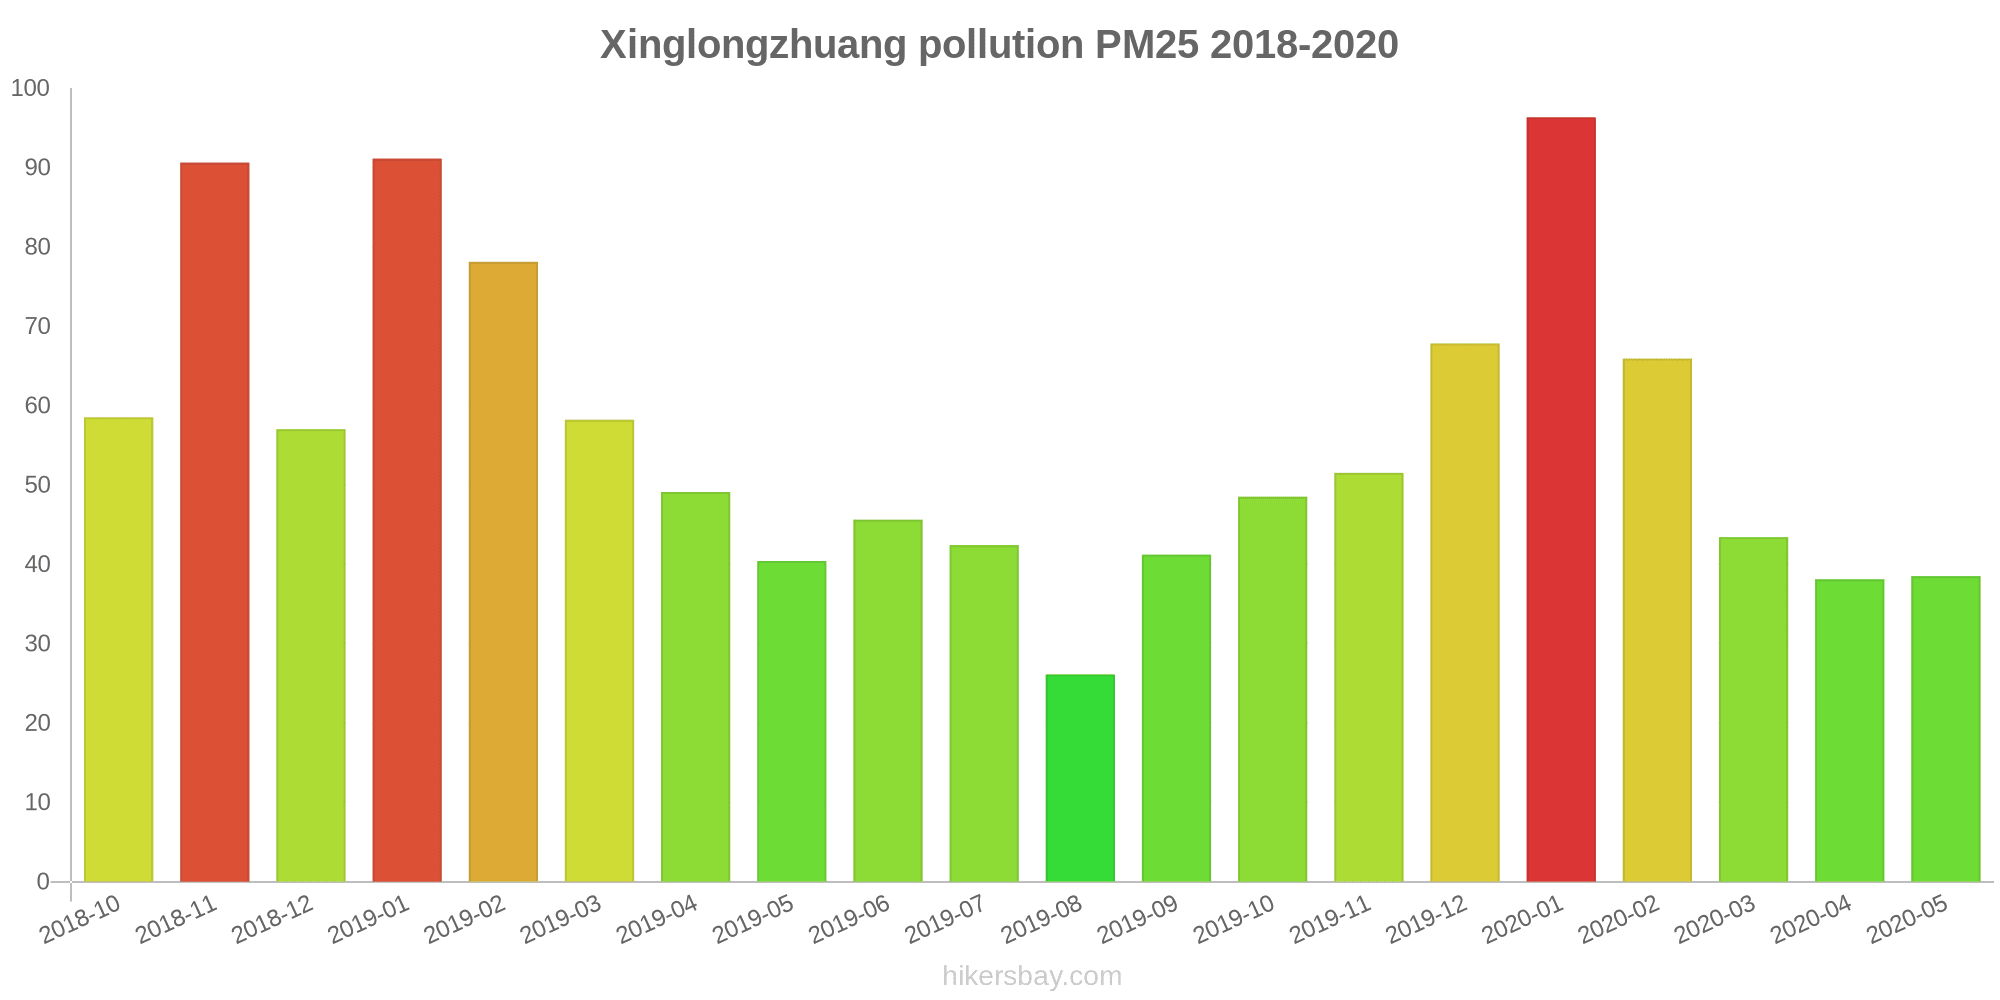
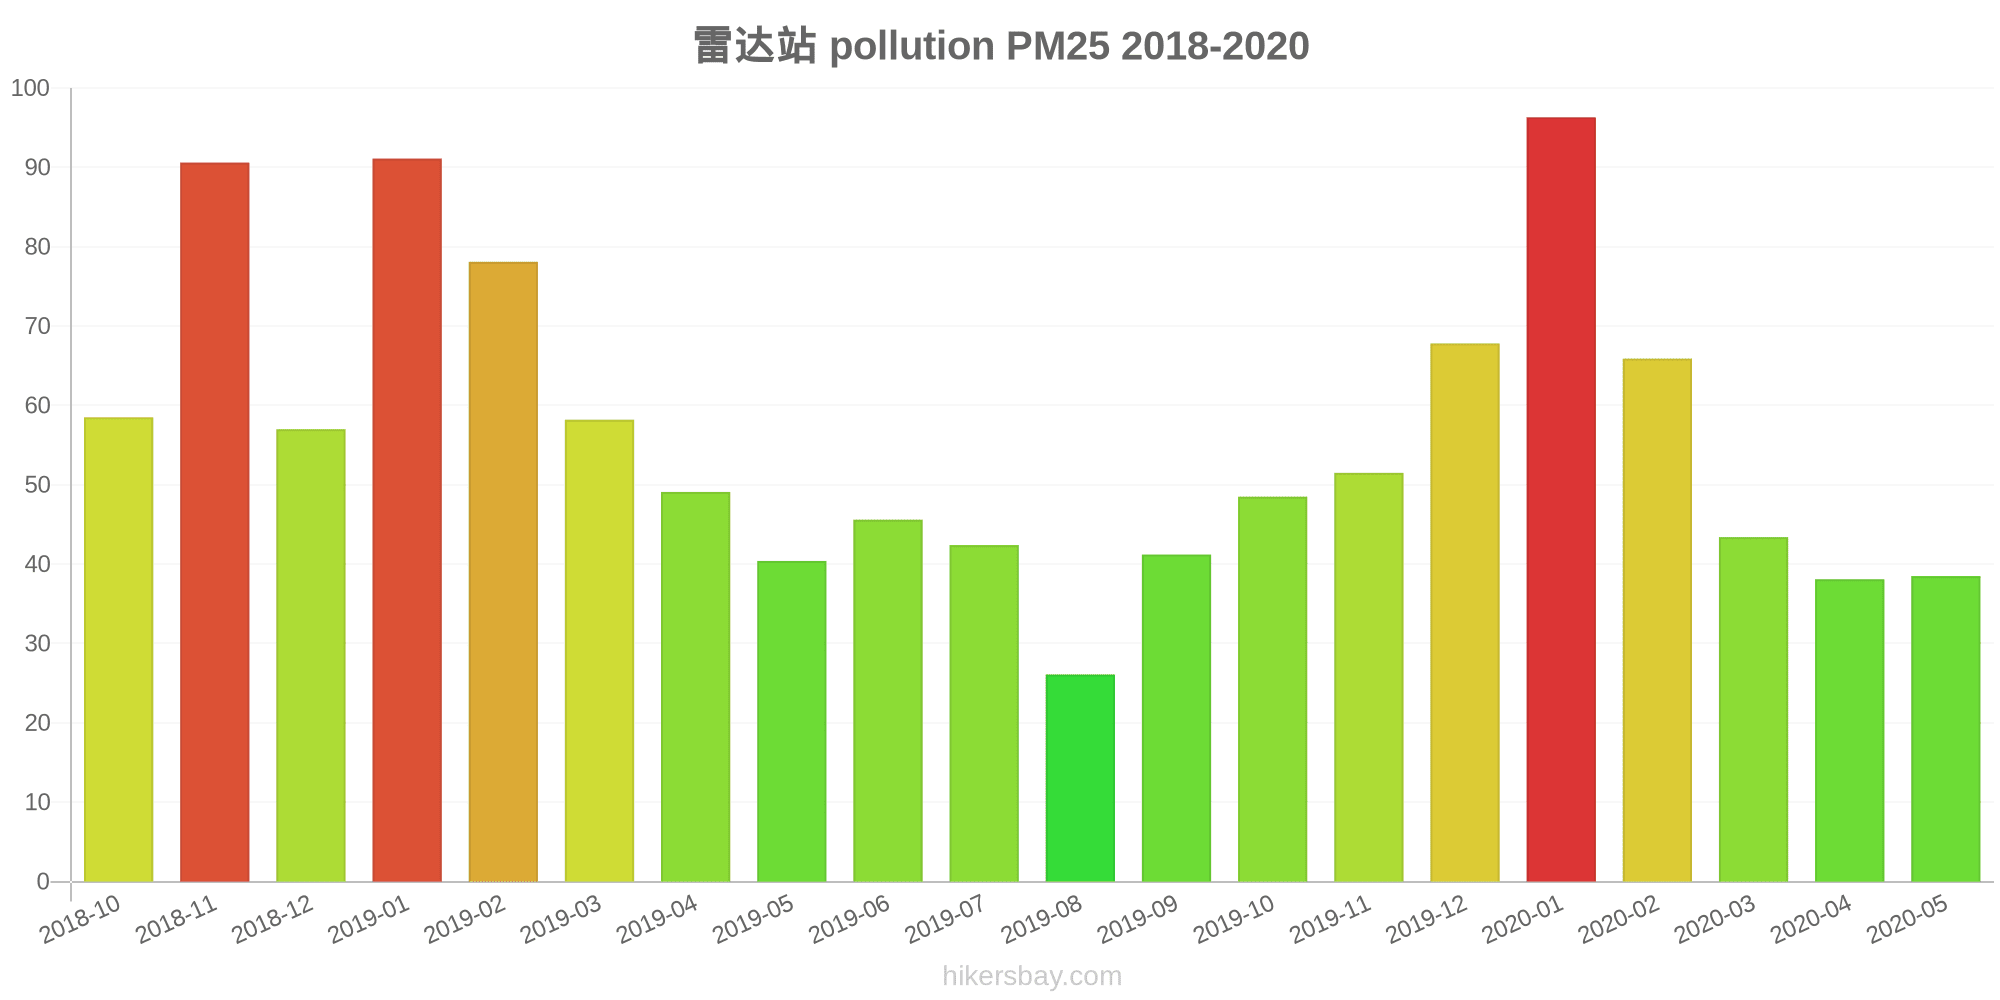
The highest PM2.5 values were recorded: 96 (January 2020).
The lowest level of particulate matter PM2.5 pollution occurs in month: August (26).
How is the O3 level today in Xinglongzhuang? (ozone (O3))
0 (Good)
How high is the level of NO2? (nitrogen dioxide (NO2))
0 (Good)
What is the level of SO2 pollution? (sulfur dioxide (SO2))
0 (Good)
Current data Friday, May 27, 2022, 12:00 PM
PM10 179 (Very bad Hazardous)
PM2,5 35 (Unhealthy for Sensitive Groups)
O3 0 (Good)
NO2 0 (Good)
SO2 0 (Good)
Data on air pollution from recent days in Xinglongzhuang
index
2022-05-27
pm10
56
Unhealthy for Sensitive Groups
pm25
56
Unhealthy
o3
0
Good
no2
0
Good
so2
0
Good
data source »
Air pollution in Xinglongzhuang from October 2018 to May 2020

index
2020-05
2020-04
2020-03
2020-02
2020-01
2019-12
2019-11
2019-10
2019-09
2019-08
2019-07
2019-06
2019-05
2019-04
2019-03
2019-02
2019-01
2018-12
2018-11
2018-10
pm25
39 (Unhealthy for Sensitive Groups)
38 (Unhealthy for Sensitive Groups)
43 (Unhealthy for Sensitive Groups)
66 (Unhealthy)
96 (Very Unhealthy)
68 (Unhealthy)
52 (Unhealthy for Sensitive Groups)
49 (Unhealthy for Sensitive Groups)
41 (Unhealthy for Sensitive Groups)
26 (Moderate)
42 (Unhealthy for Sensitive Groups)
46 (Unhealthy for Sensitive Groups)
40 (Unhealthy for Sensitive Groups)
49 (Unhealthy for Sensitive Groups)
58 (Unhealthy)
78 (Very Unhealthy)
91 (Very Unhealthy)
57 (Unhealthy)
91 (Very Unhealthy)
59 (Unhealthy)
co
1 (Good)
976 (Good)
927 (Good)
1 (Good)
2 (Good)
1 (Good)
1 (Good)
1 (Good)
1 (Good)
945 (Good)
1 (Good)
1 (Good)
880 (Good)
1 (Good)
1 (Good)
1 (Good)
1 (Good)
1 (Good)
1 (Good)
1 (Good)
no2
35 (Good)
41 (Moderate)
39 (Good)
38 (Good)
58 (Moderate)
56 (Moderate)
60 (Moderate)
62 (Moderate)
46 (Moderate)
32 (Good)
32 (Good)
33 (Good)
37 (Good)
40 (Good)
50 (Moderate)
51 (Moderate)
64 (Moderate)
53 (Moderate)
64 (Moderate)
56 (Moderate)
o3
136 (Unhealthy for Sensitive Groups)
132 (Unhealthy for Sensitive Groups)
94 (Moderate)
80 (Moderate)
62 (Good)
45 (Good)
51 (Good)
98 (Moderate)
185 (Very Unhealthy)
143 (Unhealthy for Sensitive Groups)
193 (Very Unhealthy)
209 (Very Unhealthy)
176 (Unhealthy)
129 (Unhealthy for Sensitive Groups)
108 (Moderate)
80 (Moderate)
56 (Good)
50 (Good)
62 (Good)
90 (Moderate)
pm10
71 (Unhealthy for Sensitive Groups)
77 (Unhealthy for Sensitive Groups)
73 (Unhealthy for Sensitive Groups)
90 (Unhealthy)
134 (Very Unhealthy)
107 (Unhealthy)
102 (Unhealthy)
97 (Unhealthy)
81 (Unhealthy)
47 (Moderate)
60 (Unhealthy for Sensitive Groups)
78 (Unhealthy for Sensitive Groups)
88 (Unhealthy)
95 (Unhealthy)
104 (Unhealthy)
124 (Very Unhealthy)
148 (Very Unhealthy)
106 (Unhealthy)
146 (Very Unhealthy)
107 (Unhealthy)
so2
17 (Good)
16 (Good)
14 (Good)
15 (Good)
27 (Good)
23 (Good)
28 (Good)
17 (Good)
19 (Good)
13 (Good)
12 (Good)
28 (Good)
19 (Good)
20 (Good)
17 (Good)
24 (Good)
28 (Good)
27 (Good)
38 (Good)
26 (Good)
data source »
雷达站
Friday, May 27, 2022, 12:00 PM
PM10 179 (Very bad Hazardous)
particulate matter (PM10) suspended dust
PM2,5 35 (Unhealthy for Sensitive Groups)
particulate matter (PM2.5) dust
O3 0.04 (Good)
ozone (O3)
NO2 0 (Good)
nitrogen dioxide (NO2)
SO2 0 (Good)
sulfur dioxide (SO2)
雷达站
index
2022-05-27
pm10
56
pm25
56
o3
0.03
no2
0
so2
0
雷达站
2018-10 2020-05

index
2020-05
2020-04
2020-03
2020-02
2020-01
2019-12
2019-11
2019-10
2019-09
2019-08
2019-07
2019-06
2019-05
2019-04
2019-03
2019-02
2019-01
2018-12
2018-11
2018-10
pm25
39
38
43
66
96
68
52
49
41
26
42
46
40
49
58
78
91
57
91
59
co
1
976
927
1
2
1
1
1
1
945
1
1
880
1
1
1
1
1
1
1
no2
35
41
39
38
58
56
60
62
46
32
32
33
37
40
50
51
64
53
64
56
o3
136
132
94
80
62
45
51
98
185
143
193
209
176
129
108
80
56
50
62
90
pm10
71
77
73
90
134
107
102
97
81
47
60
78
88
95
104
124
148
106
146
107
so2
17
16
14
15
27
23
28
17
19
13
12
28
19
20
17
24
28
27
38
26
* Pollution data source:
https://openaq.org
(ChinaAQIData)
The data is licensed under CC-By 4.0
PM10 179 (Very bad Hazardous)
PM2,5 35 (Unhealthy for Sensitive Groups)
O3 0 (Good)
NO2 0 (Good)
SO2 0 (Good)
Data on air pollution from recent days in Xinglongzhuang
| index | 2022-05-27 |
|---|---|
| pm10 | 56 Unhealthy for Sensitive Groups |
| pm25 | 56 Unhealthy |
| o3 | 0 Good |
| no2 | 0 Good |
| so2 | 0 Good |
| index | 2020-05 | 2020-04 | 2020-03 | 2020-02 | 2020-01 | 2019-12 | 2019-11 | 2019-10 | 2019-09 | 2019-08 | 2019-07 | 2019-06 | 2019-05 | 2019-04 | 2019-03 | 2019-02 | 2019-01 | 2018-12 | 2018-11 | 2018-10 |
|---|---|---|---|---|---|---|---|---|---|---|---|---|---|---|---|---|---|---|---|---|
| pm25 | 39 (Unhealthy for Sensitive Groups) | 38 (Unhealthy for Sensitive Groups) | 43 (Unhealthy for Sensitive Groups) | 66 (Unhealthy) | 96 (Very Unhealthy) | 68 (Unhealthy) | 52 (Unhealthy for Sensitive Groups) | 49 (Unhealthy for Sensitive Groups) | 41 (Unhealthy for Sensitive Groups) | 26 (Moderate) | 42 (Unhealthy for Sensitive Groups) | 46 (Unhealthy for Sensitive Groups) | 40 (Unhealthy for Sensitive Groups) | 49 (Unhealthy for Sensitive Groups) | 58 (Unhealthy) | 78 (Very Unhealthy) | 91 (Very Unhealthy) | 57 (Unhealthy) | 91 (Very Unhealthy) | 59 (Unhealthy) |
| co | 1 (Good) | 976 (Good) | 927 (Good) | 1 (Good) | 2 (Good) | 1 (Good) | 1 (Good) | 1 (Good) | 1 (Good) | 945 (Good) | 1 (Good) | 1 (Good) | 880 (Good) | 1 (Good) | 1 (Good) | 1 (Good) | 1 (Good) | 1 (Good) | 1 (Good) | 1 (Good) |
| no2 | 35 (Good) | 41 (Moderate) | 39 (Good) | 38 (Good) | 58 (Moderate) | 56 (Moderate) | 60 (Moderate) | 62 (Moderate) | 46 (Moderate) | 32 (Good) | 32 (Good) | 33 (Good) | 37 (Good) | 40 (Good) | 50 (Moderate) | 51 (Moderate) | 64 (Moderate) | 53 (Moderate) | 64 (Moderate) | 56 (Moderate) |
| o3 | 136 (Unhealthy for Sensitive Groups) | 132 (Unhealthy for Sensitive Groups) | 94 (Moderate) | 80 (Moderate) | 62 (Good) | 45 (Good) | 51 (Good) | 98 (Moderate) | 185 (Very Unhealthy) | 143 (Unhealthy for Sensitive Groups) | 193 (Very Unhealthy) | 209 (Very Unhealthy) | 176 (Unhealthy) | 129 (Unhealthy for Sensitive Groups) | 108 (Moderate) | 80 (Moderate) | 56 (Good) | 50 (Good) | 62 (Good) | 90 (Moderate) |
| pm10 | 71 (Unhealthy for Sensitive Groups) | 77 (Unhealthy for Sensitive Groups) | 73 (Unhealthy for Sensitive Groups) | 90 (Unhealthy) | 134 (Very Unhealthy) | 107 (Unhealthy) | 102 (Unhealthy) | 97 (Unhealthy) | 81 (Unhealthy) | 47 (Moderate) | 60 (Unhealthy for Sensitive Groups) | 78 (Unhealthy for Sensitive Groups) | 88 (Unhealthy) | 95 (Unhealthy) | 104 (Unhealthy) | 124 (Very Unhealthy) | 148 (Very Unhealthy) | 106 (Unhealthy) | 146 (Very Unhealthy) | 107 (Unhealthy) |
| so2 | 17 (Good) | 16 (Good) | 14 (Good) | 15 (Good) | 27 (Good) | 23 (Good) | 28 (Good) | 17 (Good) | 19 (Good) | 13 (Good) | 12 (Good) | 28 (Good) | 19 (Good) | 20 (Good) | 17 (Good) | 24 (Good) | 28 (Good) | 27 (Good) | 38 (Good) | 26 (Good) |
PM10 179 (Very bad Hazardous)
particulate matter (PM10) suspended dustPM2,5 35 (Unhealthy for Sensitive Groups)
particulate matter (PM2.5) dustO3 0.04 (Good)
ozone (O3)NO2 0 (Good)
nitrogen dioxide (NO2)SO2 0 (Good)
sulfur dioxide (SO2)雷达站
| index | 2022-05-27 |
|---|---|
| pm10 | 56 |
| pm25 | 56 |
| o3 | 0.03 |
| no2 | 0 |
| so2 | 0 |
雷达站
| index | 2020-05 | 2020-04 | 2020-03 | 2020-02 | 2020-01 | 2019-12 | 2019-11 | 2019-10 | 2019-09 | 2019-08 | 2019-07 | 2019-06 | 2019-05 | 2019-04 | 2019-03 | 2019-02 | 2019-01 | 2018-12 | 2018-11 | 2018-10 |
|---|---|---|---|---|---|---|---|---|---|---|---|---|---|---|---|---|---|---|---|---|
| pm25 | 39 | 38 | 43 | 66 | 96 | 68 | 52 | 49 | 41 | 26 | 42 | 46 | 40 | 49 | 58 | 78 | 91 | 57 | 91 | 59 |
| co | 1 | 976 | 927 | 1 | 2 | 1 | 1 | 1 | 1 | 945 | 1 | 1 | 880 | 1 | 1 | 1 | 1 | 1 | 1 | 1 |
| no2 | 35 | 41 | 39 | 38 | 58 | 56 | 60 | 62 | 46 | 32 | 32 | 33 | 37 | 40 | 50 | 51 | 64 | 53 | 64 | 56 |
| o3 | 136 | 132 | 94 | 80 | 62 | 45 | 51 | 98 | 185 | 143 | 193 | 209 | 176 | 129 | 108 | 80 | 56 | 50 | 62 | 90 |
| pm10 | 71 | 77 | 73 | 90 | 134 | 107 | 102 | 97 | 81 | 47 | 60 | 78 | 88 | 95 | 104 | 124 | 148 | 106 | 146 | 107 |
| so2 | 17 | 16 | 14 | 15 | 27 | 23 | 28 | 17 | 19 | 13 | 12 | 28 | 19 | 20 | 17 | 24 | 28 | 27 | 38 | 26 |