Air Pollution in Changling: Real-time Air Quality Index and smog alert.
Pollution and air quality forecast for Changling. Today is Tuesday, June 16, 2026. The following air pollution values have been recorded for Changling:- particulate matter (PM10) suspended dust - 7 (Good)
- particulate matter (PM2.5) dust - 2 (Good)
- carbon monoxide (CO) - 100 (Good)
- nitrogen dioxide (NO2) - 8 (Good)
- ozone (O3) - 0 (Good)
- sulfur dioxide (SO2) - 9 (Good)

What is the air quality in Changling today? Is the air polluted in Changling?. Is there smog?
What is the level of PM10 today in Changling? (particulate matter (PM10) suspended dust)
The current level of particulate matter PM10 in Changling is:
7 (Good)
The highest PM10 values usually occur in month: 89 (December 2019).
The lowest value of particulate matter PM10 pollution in Changling is usually recorded in: June (34).
What is the current level of PM2.5 in Changling? (particulate matter (PM2.5) dust)
Today's PM2.5 level is:
2 (Good)
For comparison, the highest level of PM2.5 in Changling in the last 7 days was: 24 (Friday, May 27, 2022) and the lowest: 24 (Friday, May 27, 2022).
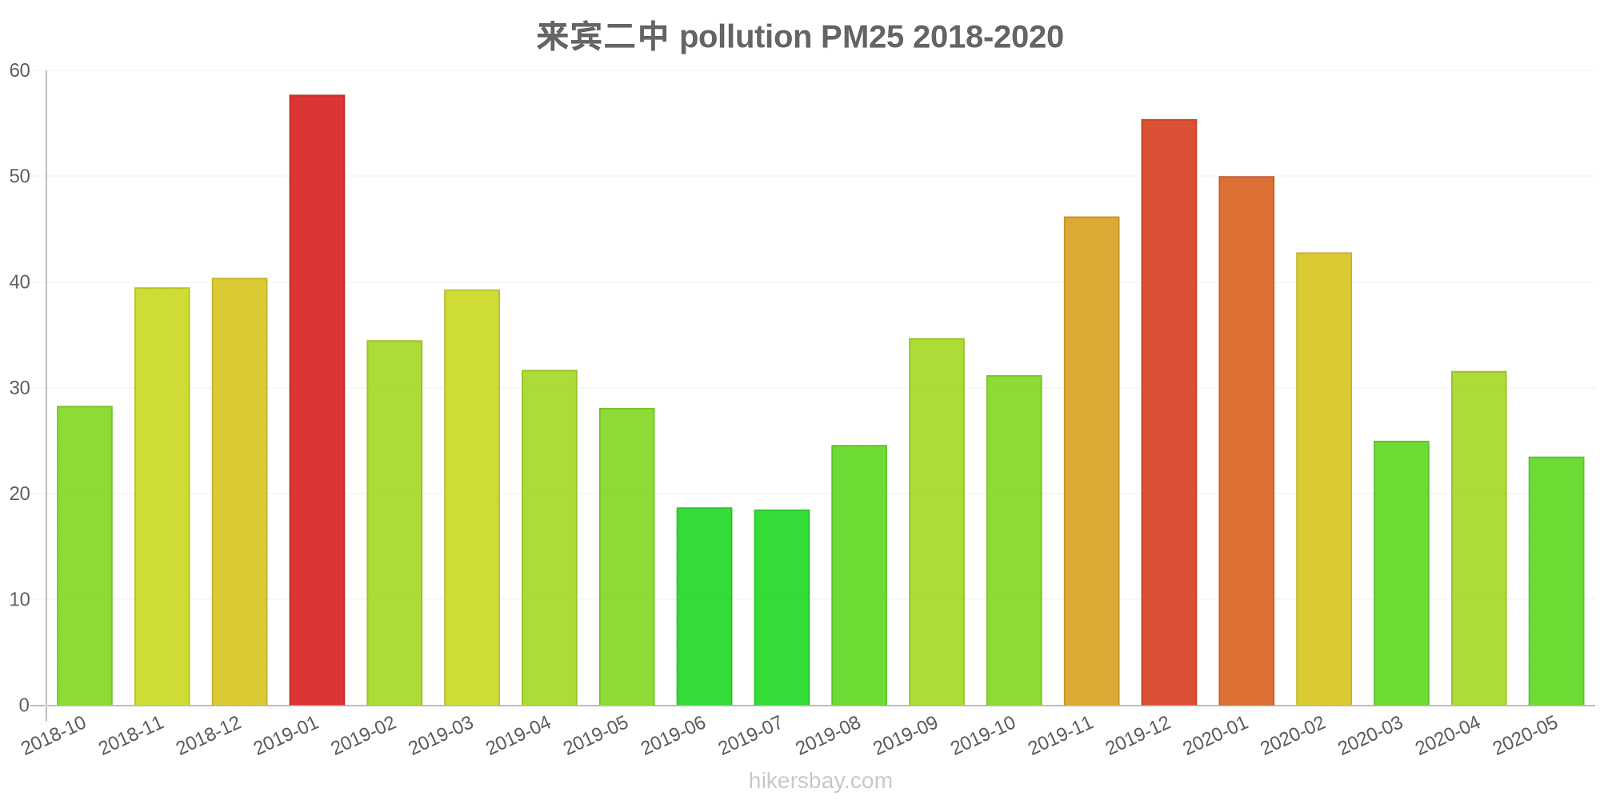
The highest PM2.5 values were recorded: 58 (January 2019).
The lowest level of particulate matter PM2.5 pollution occurs in month: July (19).
How high is the CO level? (carbon monoxide (CO))
100 (Good)
How high is the level of NO2? (nitrogen dioxide (NO2))
8 (Good)
How is the O3 level today in Changling? (ozone (O3))
0 (Good)
What is the level of SO2 pollution? (sulfur dioxide (SO2))
9 (Good)
Current data Friday, May 27, 2022, 12:00 PM
PM10 7 (Good)
PM2,5 2 (Good)
CO 100 (Good)
NO2 8 (Good)
O3 0 (Good)
SO2 9 (Good)
Data on air pollution from recent days in Changling
index
2022-05-27
pm10
32
Moderate
pm25
24
Moderate
co
468
Good
no2
21
Good
o3
32
Good
so2
5
Good
data source »
Air pollution in Changling from October 2018 to May 2020

index
2020-05
2020-04
2020-03
2020-02
2020-01
2019-12
2019-11
2019-10
2019-09
2019-08
2019-07
2019-06
2019-05
2019-04
2019-03
2019-02
2019-01
2018-12
2018-11
2018-10
pm25
24 (Moderate)
32 (Moderate)
25 (Moderate)
43 (Unhealthy for Sensitive Groups)
50 (Unhealthy for Sensitive Groups)
55 (Unhealthy)
46 (Unhealthy for Sensitive Groups)
31 (Moderate)
35 (Moderate)
25 (Moderate)
19 (Moderate)
19 (Moderate)
28 (Moderate)
32 (Moderate)
39 (Unhealthy for Sensitive Groups)
35 (Moderate)
58 (Unhealthy)
40 (Unhealthy for Sensitive Groups)
40 (Unhealthy for Sensitive Groups)
28 (Moderate)
co
692 (Good)
802 (Good)
829 (Good)
877 (Good)
1 (Good)
1 (Good)
894 (Good)
835 (Good)
868 (Good)
800 (Good)
764 (Good)
748 (Good)
778 (Good)
802 (Good)
939 (Good)
968 (Good)
1 (Good)
1 (Good)
951 (Good)
834 (Good)
no2
12 (Good)
21 (Good)
18 (Good)
19 (Good)
26 (Good)
38 (Good)
28 (Good)
17 (Good)
21 (Good)
14 (Good)
13 (Good)
14 (Good)
18 (Good)
19 (Good)
25 (Good)
18 (Good)
29 (Good)
27 (Good)
29 (Good)
25 (Good)
o3
113 (Moderate)
101 (Moderate)
67 (Good)
76 (Moderate)
76 (Moderate)
95 (Moderate)
131 (Unhealthy for Sensitive Groups)
118 (Moderate)
170 (Unhealthy)
125 (Unhealthy for Sensitive Groups)
106 (Moderate)
112 (Moderate)
108 (Moderate)
87 (Moderate)
65 (Good)
46 (Good)
61 (Good)
46 (Good)
90 (Moderate)
80 (Moderate)
pm10
49 (Moderate)
56 (Unhealthy for Sensitive Groups)
41 (Moderate)
56 (Unhealthy for Sensitive Groups)
70 (Unhealthy for Sensitive Groups)
89 (Unhealthy)
82 (Unhealthy)
56 (Unhealthy for Sensitive Groups)
67 (Unhealthy for Sensitive Groups)
47 (Moderate)
35 (Moderate)
34 (Moderate)
55 (Unhealthy for Sensitive Groups)
56 (Unhealthy for Sensitive Groups)
58 (Unhealthy for Sensitive Groups)
51 (Unhealthy for Sensitive Groups)
82 (Unhealthy)
64 (Unhealthy for Sensitive Groups)
65 (Unhealthy for Sensitive Groups)
54 (Unhealthy for Sensitive Groups)
so2
15 (Good)
11 (Good)
9.4 (Good)
7.6 (Good)
12 (Good)
16 (Good)
15 (Good)
12 (Good)
13 (Good)
11 (Good)
15 (Good)
11 (Good)
12 (Good)
13 (Good)
11 (Good)
6.6 (Good)
10 (Good)
13 (Good)
12 (Good)
10 (Good)
data source »
来宾二中
Friday, May 27, 2022, 12:00 PM
PM10 6.7 (Good)
particulate matter (PM10) suspended dust
PM2,5 1.7 (Good)
particulate matter (PM2.5) dust
CO 100 (Good)
carbon monoxide (CO)
NO2 7.6 (Good)
nitrogen dioxide (NO2)
O3 0.02 (Good)
ozone (O3)
SO2 8.6 (Good)
sulfur dioxide (SO2)
来宾二中
index
2022-05-27
pm10
32
pm25
24
co
468
no2
21
o3
32
so2
4.6
来宾二中
2018-10 2020-05
index
2020-05
2020-04
2020-03
2020-02
2020-01
2019-12
2019-11
2019-10
2019-09
2019-08
2019-07
2019-06
2019-05
2019-04
2019-03
2019-02
2019-01
2018-12
2018-11
2018-10
pm25
24
32
25
43
50
55
46
31
35
25
19
19
28
32
39
35
58
40
40
28
co
692
802
829
877
1
1
894
835
868
800
764
748
778
802
939
968
1
1
951
834
no2
12
21
18
19
26
38
28
17
21
14
13
14
18
19
25
18
29
27
29
25
o3
113
101
67
76
76
95
131
118
170
125
106
112
108
87
65
46
61
46
90
80
pm10
49
56
41
56
70
89
82
56
67
47
35
34
55
56
58
51
82
64
65
54
so2
15
11
9.4
7.6
12
16
15
12
13
11
15
11
12
13
11
6.6
10
13
12
10
* Pollution data source:
https://openaq.org
(ChinaAQIData)
The data is licensed under CC-By 4.0
PM10 7 (Good)
PM2,5 2 (Good)
CO 100 (Good)
NO2 8 (Good)
O3 0 (Good)
SO2 9 (Good)
Data on air pollution from recent days in Changling
| index | 2022-05-27 |
|---|---|
| pm10 | 32 Moderate |
| pm25 | 24 Moderate |
| co | 468 Good |
| no2 | 21 Good |
| o3 | 32 Good |
| so2 | 5 Good |

| index | 2020-05 | 2020-04 | 2020-03 | 2020-02 | 2020-01 | 2019-12 | 2019-11 | 2019-10 | 2019-09 | 2019-08 | 2019-07 | 2019-06 | 2019-05 | 2019-04 | 2019-03 | 2019-02 | 2019-01 | 2018-12 | 2018-11 | 2018-10 |
|---|---|---|---|---|---|---|---|---|---|---|---|---|---|---|---|---|---|---|---|---|
| pm25 | 24 (Moderate) | 32 (Moderate) | 25 (Moderate) | 43 (Unhealthy for Sensitive Groups) | 50 (Unhealthy for Sensitive Groups) | 55 (Unhealthy) | 46 (Unhealthy for Sensitive Groups) | 31 (Moderate) | 35 (Moderate) | 25 (Moderate) | 19 (Moderate) | 19 (Moderate) | 28 (Moderate) | 32 (Moderate) | 39 (Unhealthy for Sensitive Groups) | 35 (Moderate) | 58 (Unhealthy) | 40 (Unhealthy for Sensitive Groups) | 40 (Unhealthy for Sensitive Groups) | 28 (Moderate) |
| co | 692 (Good) | 802 (Good) | 829 (Good) | 877 (Good) | 1 (Good) | 1 (Good) | 894 (Good) | 835 (Good) | 868 (Good) | 800 (Good) | 764 (Good) | 748 (Good) | 778 (Good) | 802 (Good) | 939 (Good) | 968 (Good) | 1 (Good) | 1 (Good) | 951 (Good) | 834 (Good) |
| no2 | 12 (Good) | 21 (Good) | 18 (Good) | 19 (Good) | 26 (Good) | 38 (Good) | 28 (Good) | 17 (Good) | 21 (Good) | 14 (Good) | 13 (Good) | 14 (Good) | 18 (Good) | 19 (Good) | 25 (Good) | 18 (Good) | 29 (Good) | 27 (Good) | 29 (Good) | 25 (Good) |
| o3 | 113 (Moderate) | 101 (Moderate) | 67 (Good) | 76 (Moderate) | 76 (Moderate) | 95 (Moderate) | 131 (Unhealthy for Sensitive Groups) | 118 (Moderate) | 170 (Unhealthy) | 125 (Unhealthy for Sensitive Groups) | 106 (Moderate) | 112 (Moderate) | 108 (Moderate) | 87 (Moderate) | 65 (Good) | 46 (Good) | 61 (Good) | 46 (Good) | 90 (Moderate) | 80 (Moderate) |
| pm10 | 49 (Moderate) | 56 (Unhealthy for Sensitive Groups) | 41 (Moderate) | 56 (Unhealthy for Sensitive Groups) | 70 (Unhealthy for Sensitive Groups) | 89 (Unhealthy) | 82 (Unhealthy) | 56 (Unhealthy for Sensitive Groups) | 67 (Unhealthy for Sensitive Groups) | 47 (Moderate) | 35 (Moderate) | 34 (Moderate) | 55 (Unhealthy for Sensitive Groups) | 56 (Unhealthy for Sensitive Groups) | 58 (Unhealthy for Sensitive Groups) | 51 (Unhealthy for Sensitive Groups) | 82 (Unhealthy) | 64 (Unhealthy for Sensitive Groups) | 65 (Unhealthy for Sensitive Groups) | 54 (Unhealthy for Sensitive Groups) |
| so2 | 15 (Good) | 11 (Good) | 9.4 (Good) | 7.6 (Good) | 12 (Good) | 16 (Good) | 15 (Good) | 12 (Good) | 13 (Good) | 11 (Good) | 15 (Good) | 11 (Good) | 12 (Good) | 13 (Good) | 11 (Good) | 6.6 (Good) | 10 (Good) | 13 (Good) | 12 (Good) | 10 (Good) |
PM10 6.7 (Good)
particulate matter (PM10) suspended dustPM2,5 1.7 (Good)
particulate matter (PM2.5) dustCO 100 (Good)
carbon monoxide (CO)NO2 7.6 (Good)
nitrogen dioxide (NO2)O3 0.02 (Good)
ozone (O3)SO2 8.6 (Good)
sulfur dioxide (SO2)来宾二中
| index | 2022-05-27 |
|---|---|
| pm10 | 32 |
| pm25 | 24 |
| co | 468 |
| no2 | 21 |
| o3 | 32 |
| so2 | 4.6 |
来宾二中

| index | 2020-05 | 2020-04 | 2020-03 | 2020-02 | 2020-01 | 2019-12 | 2019-11 | 2019-10 | 2019-09 | 2019-08 | 2019-07 | 2019-06 | 2019-05 | 2019-04 | 2019-03 | 2019-02 | 2019-01 | 2018-12 | 2018-11 | 2018-10 |
|---|---|---|---|---|---|---|---|---|---|---|---|---|---|---|---|---|---|---|---|---|
| pm25 | 24 | 32 | 25 | 43 | 50 | 55 | 46 | 31 | 35 | 25 | 19 | 19 | 28 | 32 | 39 | 35 | 58 | 40 | 40 | 28 |
| co | 692 | 802 | 829 | 877 | 1 | 1 | 894 | 835 | 868 | 800 | 764 | 748 | 778 | 802 | 939 | 968 | 1 | 1 | 951 | 834 |
| no2 | 12 | 21 | 18 | 19 | 26 | 38 | 28 | 17 | 21 | 14 | 13 | 14 | 18 | 19 | 25 | 18 | 29 | 27 | 29 | 25 |
| o3 | 113 | 101 | 67 | 76 | 76 | 95 | 131 | 118 | 170 | 125 | 106 | 112 | 108 | 87 | 65 | 46 | 61 | 46 | 90 | 80 |
| pm10 | 49 | 56 | 41 | 56 | 70 | 89 | 82 | 56 | 67 | 47 | 35 | 34 | 55 | 56 | 58 | 51 | 82 | 64 | 65 | 54 |
| so2 | 15 | 11 | 9.4 | 7.6 | 12 | 16 | 15 | 12 | 13 | 11 | 15 | 11 | 12 | 13 | 11 | 6.6 | 10 | 13 | 12 | 10 |