Air Pollution in Tongle: Real-time Air Quality Index and smog alert.
Pollution and air quality forecast for Tongle. Today is Thursday, June 18, 2026. The following air pollution values have been recorded for Tongle:- particulate matter (PM10) suspended dust - 7 (Good)
- particulate matter (PM2.5) dust - 2 (Good)
- carbon monoxide (CO) - 100 (Good)
- nitrogen dioxide (NO2) - 8 (Good)
- ozone (O3) - 0 (Good)
- sulfur dioxide (SO2) - 9 (Good)

What is the air quality in Tongle today? Is the air polluted in Tongle?. Is there smog?
What is the level of PM10 today in Tongle? (particulate matter (PM10) suspended dust)
The current level of particulate matter PM10 in Tongle is:
7 (Good)
The highest PM10 values usually occur in month: 90 (November 2019).
The lowest value of particulate matter PM10 pollution in Tongle is usually recorded in: June (40).
What is the current level of PM2.5 in Tongle? (particulate matter (PM2.5) dust)
Today's PM2.5 level is:
2 (Good)
For comparison, the highest level of PM2.5 in Tongle in the last 7 days was: 24 (Friday, May 27, 2022) and the lowest: 24 (Friday, May 27, 2022).
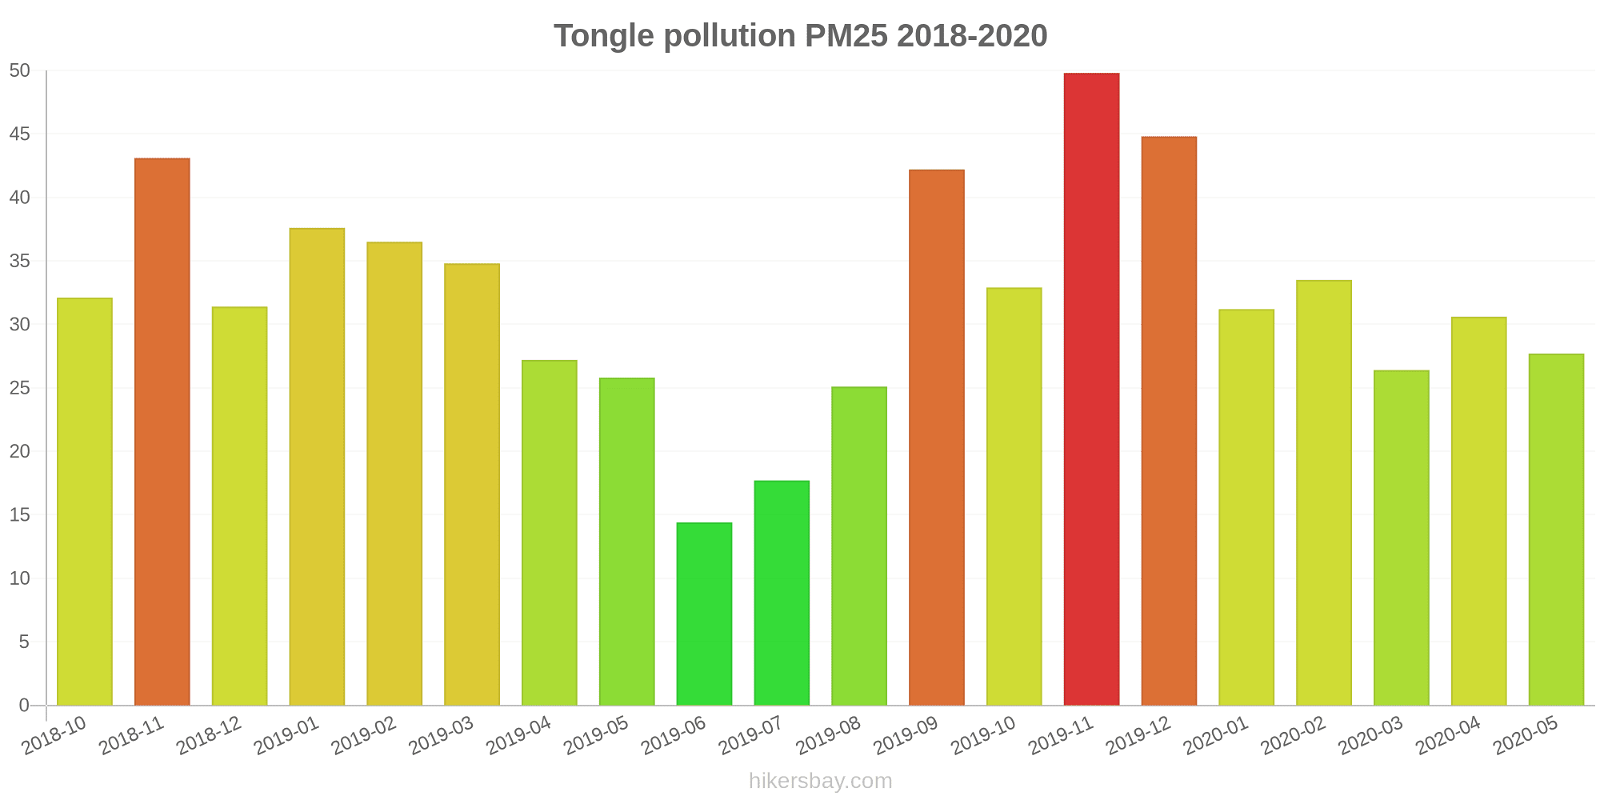
The highest PM2.5 values were recorded: 50 (November 2019).
The lowest level of particulate matter PM2.5 pollution occurs in month: June (14).
How high is the CO level? (carbon monoxide (CO))
100 (Good)
How high is the level of NO2? (nitrogen dioxide (NO2))
8 (Good)
How is the O3 level today in Tongle? (ozone (O3))
0 (Good)
What is the level of SO2 pollution? (sulfur dioxide (SO2))
9 (Good)
Current data Friday, May 27, 2022, 12:00 PM
PM10 7 (Good)
PM2,5 2 (Good)
CO 100 (Good)
NO2 8 (Good)
O3 0 (Good)
SO2 9 (Good)
Data on air pollution from recent days in Tongle
index
2022-05-27
pm10
32
Moderate
pm25
24
Moderate
co
468
Good
no2
21
Good
o3
32
Good
so2
5
Good
data source »
Air pollution in Tongle from October 2018 to May 2020
index
2020-05
2020-04
2020-03
2020-02
2020-01
2019-12
2019-11
2019-10
2019-09
2019-08
2019-07
2019-06
2019-05
2019-04
2019-03
2019-02
2019-01
2018-12
2018-11
2018-10
pm25
28 (Moderate)
31 (Moderate)
26 (Moderate)
34 (Moderate)
31 (Moderate)
45 (Unhealthy for Sensitive Groups)
50 (Unhealthy for Sensitive Groups)
33 (Moderate)
42 (Unhealthy for Sensitive Groups)
25 (Moderate)
18 (Moderate)
14 (Moderate)
26 (Moderate)
27 (Moderate)
35 (Moderate)
37 (Unhealthy for Sensitive Groups)
38 (Unhealthy for Sensitive Groups)
31 (Moderate)
43 (Unhealthy for Sensitive Groups)
32 (Moderate)
co
643 (Good)
833 (Good)
764 (Good)
790 (Good)
790 (Good)
915 (Good)
883 (Good)
812 (Good)
775 (Good)
743 (Good)
735 (Good)
735 (Good)
842 (Good)
751 (Good)
929 (Good)
1 (Good)
1 (Good)
1 (Good)
1 (Good)
1 (Good)
no2
23 (Good)
33 (Good)
27 (Good)
21 (Good)
25 (Good)
40 (Good)
45 (Moderate)
29 (Good)
32 (Good)
27 (Good)
24 (Good)
20 (Good)
27 (Good)
25 (Good)
36 (Good)
24 (Good)
37 (Good)
36 (Good)
48 (Moderate)
39 (Good)
o3
122 (Unhealthy for Sensitive Groups)
90 (Moderate)
59 (Good)
79 (Moderate)
72 (Moderate)
82 (Moderate)
110 (Moderate)
93 (Moderate)
138 (Unhealthy for Sensitive Groups)
113 (Moderate)
87 (Moderate)
93 (Moderate)
81 (Moderate)
77 (Moderate)
53 (Good)
39 (Good)
43 (Good)
42 (Good)
70 (Moderate)
60 (Good)
pm10
53 (Unhealthy for Sensitive Groups)
57 (Unhealthy for Sensitive Groups)
44 (Moderate)
45 (Moderate)
50 (Unhealthy for Sensitive Groups)
79 (Unhealthy for Sensitive Groups)
90 (Unhealthy)
65 (Unhealthy for Sensitive Groups)
73 (Unhealthy for Sensitive Groups)
50 (Moderate)
41 (Moderate)
40 (Moderate)
55 (Unhealthy for Sensitive Groups)
52 (Unhealthy for Sensitive Groups)
58 (Unhealthy for Sensitive Groups)
50 (Moderate)
58 (Unhealthy for Sensitive Groups)
54 (Unhealthy for Sensitive Groups)
83 (Unhealthy)
60 (Unhealthy for Sensitive Groups)
so2
7 (Good)
11 (Good)
8.8 (Good)
7.1 (Good)
8.4 (Good)
17 (Good)
12 (Good)
9 (Good)
13 (Good)
6.9 (Good)
4.3 (Good)
4.8 (Good)
6 (Good)
3.4 (Good)
6.7 (Good)
8.2 (Good)
6.9 (Good)
7.1 (Good)
12 (Good)
8.2 (Good)
data source »
沙井镇街道办
Friday, May 27, 2022, 12:00 PM
PM10 6.7 (Good)
particulate matter (PM10) suspended dust
PM2,5 1.7 (Good)
particulate matter (PM2.5) dust
CO 100 (Good)
carbon monoxide (CO)
NO2 7.6 (Good)
nitrogen dioxide (NO2)
O3 0.02 (Good)
ozone (O3)
SO2 8.6 (Good)
sulfur dioxide (SO2)
沙井镇街道办
index
2022-05-27
pm10
32
pm25
24
co
468
no2
21
o3
32
so2
4.6
沙井镇街道办
2018-10 2020-05

index
2020-05
2020-04
2020-03
2020-02
2020-01
2019-12
2019-11
2019-10
2019-09
2019-08
2019-07
2019-06
2019-05
2019-04
2019-03
2019-02
2019-01
2018-12
2018-11
2018-10
pm25
28
31
26
34
31
45
50
33
42
25
18
14
26
27
35
37
38
31
43
32
co
643
833
764
790
790
915
883
812
775
743
735
735
842
751
929
1
1
1
1
1
no2
23
33
27
21
25
40
45
29
32
27
24
20
27
25
36
24
37
36
48
39
o3
122
90
59
79
72
82
110
93
138
113
87
93
81
77
53
39
43
42
70
60
pm10
53
57
44
45
50
79
90
65
73
50
41
40
55
52
58
50
58
54
83
60
so2
7
11
8.8
7.1
8.4
17
12
9
13
6.9
4.3
4.8
6
3.4
6.7
8.2
6.9
7.1
12
8.2
* Pollution data source:
https://openaq.org
(ChinaAQIData)
The data is licensed under CC-By 4.0
PM10 7 (Good)
PM2,5 2 (Good)
CO 100 (Good)
NO2 8 (Good)
O3 0 (Good)
SO2 9 (Good)
Data on air pollution from recent days in Tongle
| index | 2022-05-27 |
|---|---|
| pm10 | 32 Moderate |
| pm25 | 24 Moderate |
| co | 468 Good |
| no2 | 21 Good |
| o3 | 32 Good |
| so2 | 5 Good |

| index | 2020-05 | 2020-04 | 2020-03 | 2020-02 | 2020-01 | 2019-12 | 2019-11 | 2019-10 | 2019-09 | 2019-08 | 2019-07 | 2019-06 | 2019-05 | 2019-04 | 2019-03 | 2019-02 | 2019-01 | 2018-12 | 2018-11 | 2018-10 |
|---|---|---|---|---|---|---|---|---|---|---|---|---|---|---|---|---|---|---|---|---|
| pm25 | 28 (Moderate) | 31 (Moderate) | 26 (Moderate) | 34 (Moderate) | 31 (Moderate) | 45 (Unhealthy for Sensitive Groups) | 50 (Unhealthy for Sensitive Groups) | 33 (Moderate) | 42 (Unhealthy for Sensitive Groups) | 25 (Moderate) | 18 (Moderate) | 14 (Moderate) | 26 (Moderate) | 27 (Moderate) | 35 (Moderate) | 37 (Unhealthy for Sensitive Groups) | 38 (Unhealthy for Sensitive Groups) | 31 (Moderate) | 43 (Unhealthy for Sensitive Groups) | 32 (Moderate) |
| co | 643 (Good) | 833 (Good) | 764 (Good) | 790 (Good) | 790 (Good) | 915 (Good) | 883 (Good) | 812 (Good) | 775 (Good) | 743 (Good) | 735 (Good) | 735 (Good) | 842 (Good) | 751 (Good) | 929 (Good) | 1 (Good) | 1 (Good) | 1 (Good) | 1 (Good) | 1 (Good) |
| no2 | 23 (Good) | 33 (Good) | 27 (Good) | 21 (Good) | 25 (Good) | 40 (Good) | 45 (Moderate) | 29 (Good) | 32 (Good) | 27 (Good) | 24 (Good) | 20 (Good) | 27 (Good) | 25 (Good) | 36 (Good) | 24 (Good) | 37 (Good) | 36 (Good) | 48 (Moderate) | 39 (Good) |
| o3 | 122 (Unhealthy for Sensitive Groups) | 90 (Moderate) | 59 (Good) | 79 (Moderate) | 72 (Moderate) | 82 (Moderate) | 110 (Moderate) | 93 (Moderate) | 138 (Unhealthy for Sensitive Groups) | 113 (Moderate) | 87 (Moderate) | 93 (Moderate) | 81 (Moderate) | 77 (Moderate) | 53 (Good) | 39 (Good) | 43 (Good) | 42 (Good) | 70 (Moderate) | 60 (Good) |
| pm10 | 53 (Unhealthy for Sensitive Groups) | 57 (Unhealthy for Sensitive Groups) | 44 (Moderate) | 45 (Moderate) | 50 (Unhealthy for Sensitive Groups) | 79 (Unhealthy for Sensitive Groups) | 90 (Unhealthy) | 65 (Unhealthy for Sensitive Groups) | 73 (Unhealthy for Sensitive Groups) | 50 (Moderate) | 41 (Moderate) | 40 (Moderate) | 55 (Unhealthy for Sensitive Groups) | 52 (Unhealthy for Sensitive Groups) | 58 (Unhealthy for Sensitive Groups) | 50 (Moderate) | 58 (Unhealthy for Sensitive Groups) | 54 (Unhealthy for Sensitive Groups) | 83 (Unhealthy) | 60 (Unhealthy for Sensitive Groups) |
| so2 | 7 (Good) | 11 (Good) | 8.8 (Good) | 7.1 (Good) | 8.4 (Good) | 17 (Good) | 12 (Good) | 9 (Good) | 13 (Good) | 6.9 (Good) | 4.3 (Good) | 4.8 (Good) | 6 (Good) | 3.4 (Good) | 6.7 (Good) | 8.2 (Good) | 6.9 (Good) | 7.1 (Good) | 12 (Good) | 8.2 (Good) |
PM10 6.7 (Good)
particulate matter (PM10) suspended dustPM2,5 1.7 (Good)
particulate matter (PM2.5) dustCO 100 (Good)
carbon monoxide (CO)NO2 7.6 (Good)
nitrogen dioxide (NO2)O3 0.02 (Good)
ozone (O3)SO2 8.6 (Good)
sulfur dioxide (SO2)沙井镇街道办
| index | 2022-05-27 |
|---|---|
| pm10 | 32 |
| pm25 | 24 |
| co | 468 |
| no2 | 21 |
| o3 | 32 |
| so2 | 4.6 |
沙井镇街道办
| index | 2020-05 | 2020-04 | 2020-03 | 2020-02 | 2020-01 | 2019-12 | 2019-11 | 2019-10 | 2019-09 | 2019-08 | 2019-07 | 2019-06 | 2019-05 | 2019-04 | 2019-03 | 2019-02 | 2019-01 | 2018-12 | 2018-11 | 2018-10 |
|---|---|---|---|---|---|---|---|---|---|---|---|---|---|---|---|---|---|---|---|---|
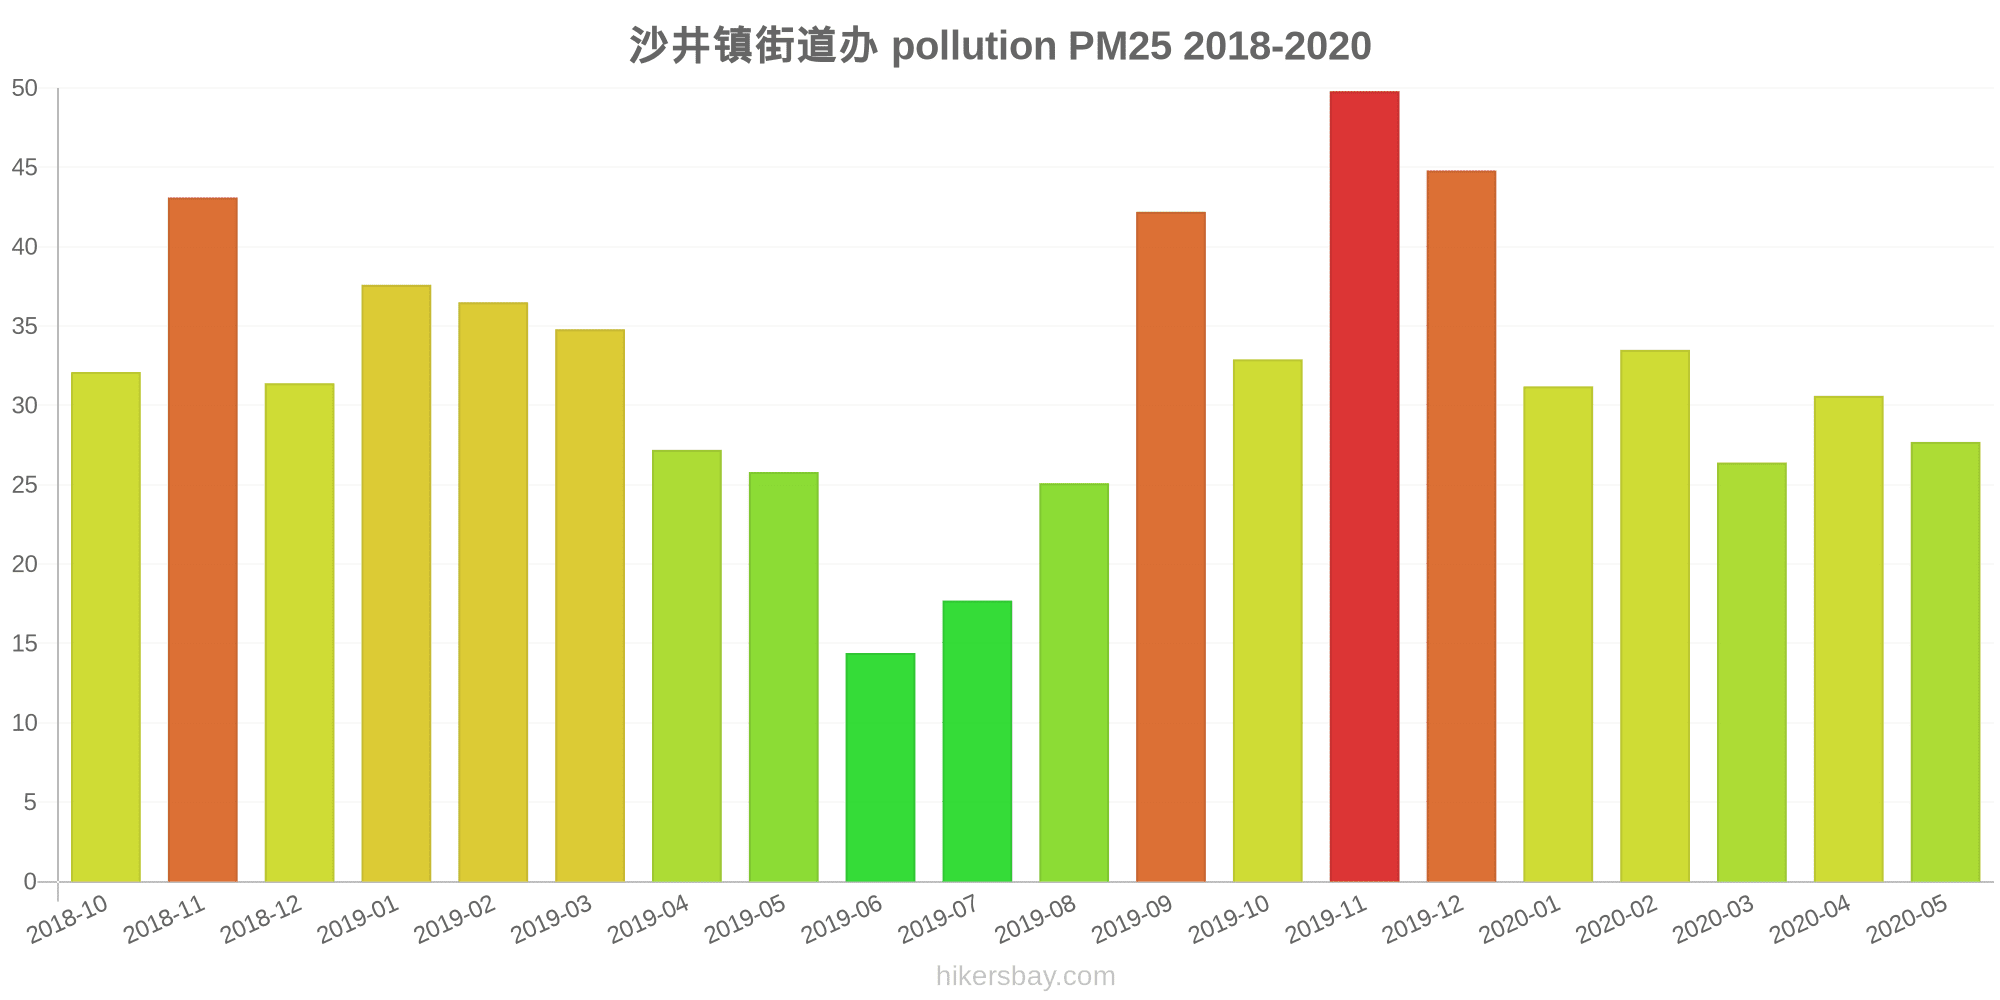
| pm25 | 28 | 31 | 26 | 34 | 31 | 45 | 50 | 33 | 42 | 25 | 18 | 14 | 26 | 27 | 35 | 37 | 38 | 31 | 43 | 32 |
| co | 643 | 833 | 764 | 790 | 790 | 915 | 883 | 812 | 775 | 743 | 735 | 735 | 842 | 751 | 929 | 1 | 1 | 1 | 1 | 1 |
| no2 | 23 | 33 | 27 | 21 | 25 | 40 | 45 | 29 | 32 | 27 | 24 | 20 | 27 | 25 | 36 | 24 | 37 | 36 | 48 | 39 |
| o3 | 122 | 90 | 59 | 79 | 72 | 82 | 110 | 93 | 138 | 113 | 87 | 93 | 81 | 77 | 53 | 39 | 43 | 42 | 70 | 60 |
| pm10 | 53 | 57 | 44 | 45 | 50 | 79 | 90 | 65 | 73 | 50 | 41 | 40 | 55 | 52 | 58 | 50 | 58 | 54 | 83 | 60 |
| so2 | 7 | 11 | 8.8 | 7.1 | 8.4 | 17 | 12 | 9 | 13 | 6.9 | 4.3 | 4.8 | 6 | 3.4 | 6.7 | 8.2 | 6.9 | 7.1 | 12 | 8.2 |