Air Pollution in Paidi: Real-time Air Quality Index and smog alert.
Pollution and air quality forecast for Paidi. Today is Tuesday, June 2, 2026. The following air pollution values have been recorded for Paidi:- particulate matter (PM10) suspended dust - 179 (Very bad Hazardous)
- particulate matter (PM2.5) dust - 35 (Unhealthy for Sensitive Groups)
- ozone (O3) - 0 (Good)
- nitrogen dioxide (NO2) - 0 (Good)
- sulfur dioxide (SO2) - 0 (Good)

What is the air quality in Paidi today? Is the air polluted in Paidi?. Is there smog?
What is the level of PM10 today in Paidi? (particulate matter (PM10) suspended dust)
The current level of particulate matter PM10 in Paidi is:
179 (Very bad Hazardous)
The highest PM10 values usually occur in month: 71 (November 2019).
The lowest value of particulate matter PM10 pollution in Paidi is usually recorded in: February (25).
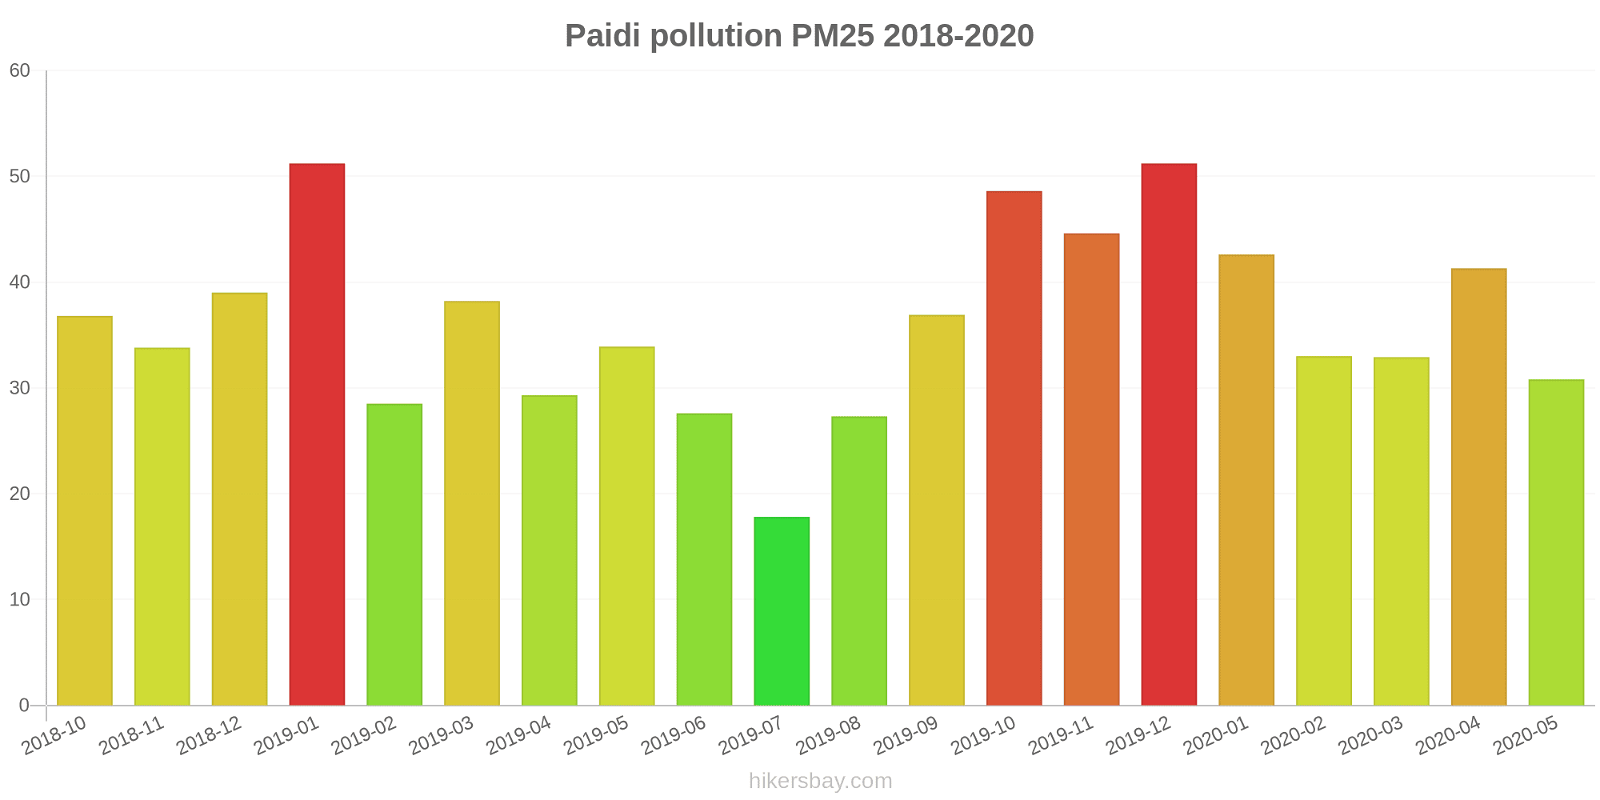
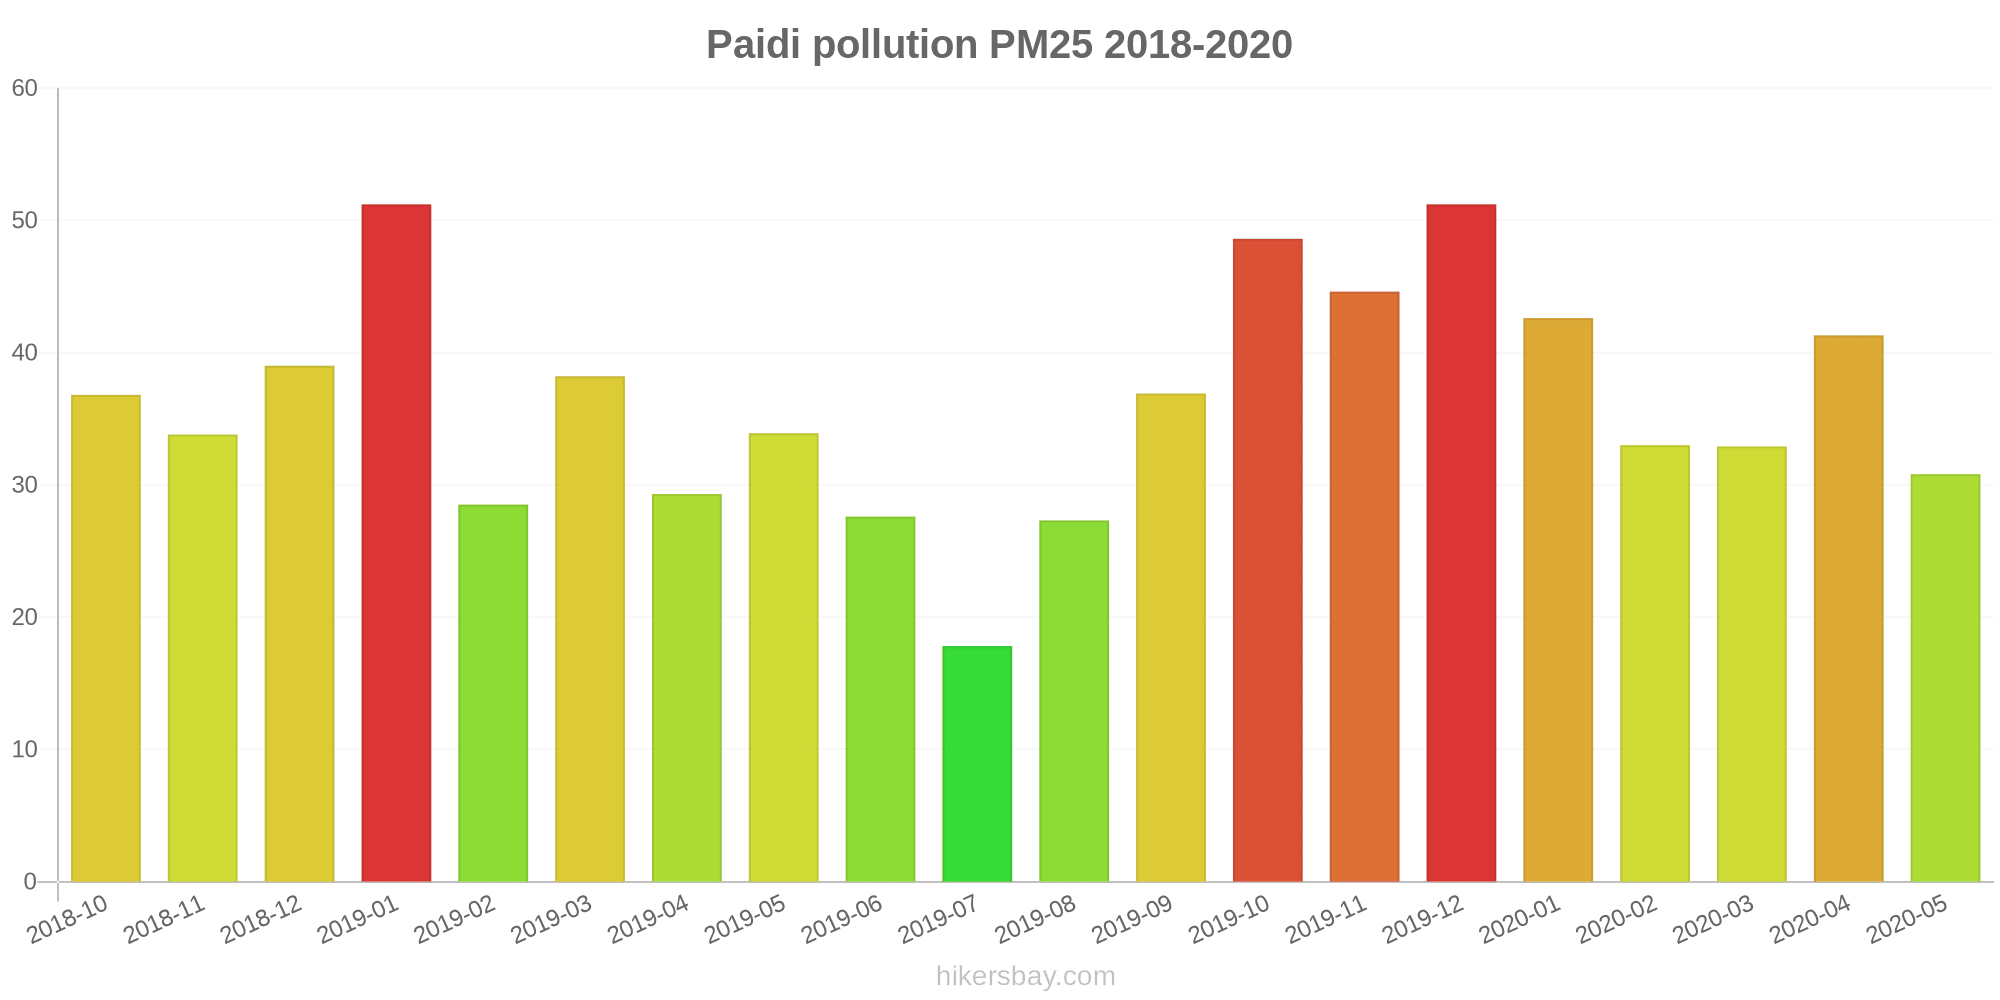
What is the current level of PM2.5 in Paidi? (particulate matter (PM2.5) dust)
Today's PM2.5 level is:
35 (Unhealthy for Sensitive Groups)
For comparison, the highest level of PM2.5 in Paidi in the last 7 days was: 56 (Friday, May 27, 2022) and the lowest: 56 (Friday, May 27, 2022).
The highest PM2.5 values were recorded: 51 (December 2019).
The lowest level of particulate matter PM2.5 pollution occurs in month: July (18).
How is the O3 level today in Paidi? (ozone (O3))
0 (Good)
How high is the level of NO2? (nitrogen dioxide (NO2))
0 (Good)
What is the level of SO2 pollution? (sulfur dioxide (SO2))
0 (Good)
Current data Friday, May 27, 2022, 12:00 PM
PM10 179 (Very bad Hazardous)
PM2,5 35 (Unhealthy for Sensitive Groups)
O3 0 (Good)
NO2 0 (Good)
SO2 0 (Good)
Data on air pollution from recent days in Paidi
index
2022-05-27
pm10
56
Unhealthy for Sensitive Groups
pm25
56
Unhealthy
o3
0
Good
no2
0
Good
so2
0
Good
data source »
Air pollution in Paidi from October 2018 to May 2020
index
2020-05
2020-04
2020-03
2020-02
2020-01
2019-12
2019-11
2019-10
2019-09
2019-08
2019-07
2019-06
2019-05
2019-04
2019-03
2019-02
2019-01
2018-12
2018-11
2018-10
pm25
31 (Moderate)
41 (Unhealthy for Sensitive Groups)
33 (Moderate)
33 (Moderate)
43 (Unhealthy for Sensitive Groups)
51 (Unhealthy for Sensitive Groups)
45 (Unhealthy for Sensitive Groups)
49 (Unhealthy for Sensitive Groups)
37 (Unhealthy for Sensitive Groups)
27 (Moderate)
18 (Moderate)
28 (Moderate)
34 (Moderate)
29 (Moderate)
38 (Unhealthy for Sensitive Groups)
29 (Moderate)
51 (Unhealthy for Sensitive Groups)
39 (Unhealthy for Sensitive Groups)
34 (Moderate)
37 (Unhealthy for Sensitive Groups)
co
676 (Good)
582 (Good)
658 (Good)
554 (Good)
653 (Good)
510 (Good)
534 (Good)
622 (Good)
531 (Good)
266 (Good)
473 (Good)
598 (Good)
438 (Good)
505 (Good)
569 (Good)
680 (Good)
793 (Good)
608 (Good)
497 (Good)
609 (Good)
no2
16 (Good)
24 (Good)
19 (Good)
9.9 (Good)
23 (Good)
38 (Good)
32 (Good)
25 (Good)
21 (Good)
14 (Good)
10 (Good)
13 (Good)
12 (Good)
15 (Good)
22 (Good)
12 (Good)
34 (Good)
29 (Good)
22 (Good)
28 (Good)
o3
130 (Unhealthy for Sensitive Groups)
144 (Unhealthy for Sensitive Groups)
80 (Moderate)
77 (Moderate)
61 (Good)
83 (Moderate)
131 (Unhealthy for Sensitive Groups)
148 (Unhealthy for Sensitive Groups)
175 (Unhealthy)
140 (Unhealthy for Sensitive Groups)
105 (Moderate)
113 (Moderate)
132 (Unhealthy for Sensitive Groups)
107 (Moderate)
98 (Moderate)
55 (Good)
62 (Good)
52 (Good)
80 (Moderate)
121 (Unhealthy for Sensitive Groups)
pm10
44 (Moderate)
54 (Unhealthy for Sensitive Groups)
37 (Moderate)
34 (Moderate)
39 (Moderate)
58 (Unhealthy for Sensitive Groups)
71 (Unhealthy for Sensitive Groups)
67 (Unhealthy for Sensitive Groups)
56 (Unhealthy for Sensitive Groups)
41 (Moderate)
25 (Moderate)
34 (Moderate)
51 (Unhealthy for Sensitive Groups)
41 (Moderate)
50 (Moderate)
25 (Moderate)
57 (Unhealthy for Sensitive Groups)
40 (Moderate)
46 (Moderate)
55 (Unhealthy for Sensitive Groups)
so2
22 (Good)
24 (Good)
20 (Good)
24 (Good)
17 (Good)
33 (Good)
31 (Good)
23 (Good)
16 (Good)
8.1 (Good)
6.2 (Good)
20 (Good)
15 (Good)
22 (Good)
24 (Good)
11 (Good)
12 (Good)
16 (Good)
20 (Good)
25 (Good)
data source »
新监测站
Friday, May 27, 2022, 12:00 PM
PM10 179 (Very bad Hazardous)
particulate matter (PM10) suspended dust
PM2,5 35 (Unhealthy for Sensitive Groups)
particulate matter (PM2.5) dust
O3 0.04 (Good)
ozone (O3)
NO2 0 (Good)
nitrogen dioxide (NO2)
SO2 0 (Good)
sulfur dioxide (SO2)
新监测站
index
2022-05-27
pm10
56
pm25
56
o3
0.03
no2
0
so2
0
新监测站
2018-10 2020-05

index
2020-05
2020-04
2020-03
2020-02
2020-01
2019-12
2019-11
2019-10
2019-09
2019-08
2019-07
2019-06
2019-05
2019-04
2019-03
2019-02
2019-01
2018-12
2018-11
2018-10
pm25
31
41
33
33
43
51
45
49
37
27
18
28
34
29
38
29
51
39
34
37
co
676
582
658
554
653
510
534
622
531
266
473
598
438
505
569
680
793
608
497
609
no2
16
24
19
9.9
23
38
32
25
21
14
10
13
12
15
22
12
34
29
22
28
o3
130
144
80
77
61
83
131
148
175
140
105
113
132
107
98
55
62
52
80
121
pm10
44
54
37
34
39
58
71
67
56
41
25
34
51
41
50
25
57
40
46
55
so2
22
24
20
24
17
33
31
23
16
8.1
6.2
20
15
22
24
11
12
16
20
25
* Pollution data source:
https://openaq.org
(ChinaAQIData)
The data is licensed under CC-By 4.0
PM10 179 (Very bad Hazardous)
PM2,5 35 (Unhealthy for Sensitive Groups)
O3 0 (Good)
NO2 0 (Good)
SO2 0 (Good)
Data on air pollution from recent days in Paidi
| index | 2022-05-27 |
|---|---|
| pm10 | 56 Unhealthy for Sensitive Groups |
| pm25 | 56 Unhealthy |
| o3 | 0 Good |
| no2 | 0 Good |
| so2 | 0 Good |
| index | 2020-05 | 2020-04 | 2020-03 | 2020-02 | 2020-01 | 2019-12 | 2019-11 | 2019-10 | 2019-09 | 2019-08 | 2019-07 | 2019-06 | 2019-05 | 2019-04 | 2019-03 | 2019-02 | 2019-01 | 2018-12 | 2018-11 | 2018-10 |
|---|---|---|---|---|---|---|---|---|---|---|---|---|---|---|---|---|---|---|---|---|
| pm25 | 31 (Moderate) | 41 (Unhealthy for Sensitive Groups) | 33 (Moderate) | 33 (Moderate) | 43 (Unhealthy for Sensitive Groups) | 51 (Unhealthy for Sensitive Groups) | 45 (Unhealthy for Sensitive Groups) | 49 (Unhealthy for Sensitive Groups) | 37 (Unhealthy for Sensitive Groups) | 27 (Moderate) | 18 (Moderate) | 28 (Moderate) | 34 (Moderate) | 29 (Moderate) | 38 (Unhealthy for Sensitive Groups) | 29 (Moderate) | 51 (Unhealthy for Sensitive Groups) | 39 (Unhealthy for Sensitive Groups) | 34 (Moderate) | 37 (Unhealthy for Sensitive Groups) |
| co | 676 (Good) | 582 (Good) | 658 (Good) | 554 (Good) | 653 (Good) | 510 (Good) | 534 (Good) | 622 (Good) | 531 (Good) | 266 (Good) | 473 (Good) | 598 (Good) | 438 (Good) | 505 (Good) | 569 (Good) | 680 (Good) | 793 (Good) | 608 (Good) | 497 (Good) | 609 (Good) |
| no2 | 16 (Good) | 24 (Good) | 19 (Good) | 9.9 (Good) | 23 (Good) | 38 (Good) | 32 (Good) | 25 (Good) | 21 (Good) | 14 (Good) | 10 (Good) | 13 (Good) | 12 (Good) | 15 (Good) | 22 (Good) | 12 (Good) | 34 (Good) | 29 (Good) | 22 (Good) | 28 (Good) |
| o3 | 130 (Unhealthy for Sensitive Groups) | 144 (Unhealthy for Sensitive Groups) | 80 (Moderate) | 77 (Moderate) | 61 (Good) | 83 (Moderate) | 131 (Unhealthy for Sensitive Groups) | 148 (Unhealthy for Sensitive Groups) | 175 (Unhealthy) | 140 (Unhealthy for Sensitive Groups) | 105 (Moderate) | 113 (Moderate) | 132 (Unhealthy for Sensitive Groups) | 107 (Moderate) | 98 (Moderate) | 55 (Good) | 62 (Good) | 52 (Good) | 80 (Moderate) | 121 (Unhealthy for Sensitive Groups) |
| pm10 | 44 (Moderate) | 54 (Unhealthy for Sensitive Groups) | 37 (Moderate) | 34 (Moderate) | 39 (Moderate) | 58 (Unhealthy for Sensitive Groups) | 71 (Unhealthy for Sensitive Groups) | 67 (Unhealthy for Sensitive Groups) | 56 (Unhealthy for Sensitive Groups) | 41 (Moderate) | 25 (Moderate) | 34 (Moderate) | 51 (Unhealthy for Sensitive Groups) | 41 (Moderate) | 50 (Moderate) | 25 (Moderate) | 57 (Unhealthy for Sensitive Groups) | 40 (Moderate) | 46 (Moderate) | 55 (Unhealthy for Sensitive Groups) |
| so2 | 22 (Good) | 24 (Good) | 20 (Good) | 24 (Good) | 17 (Good) | 33 (Good) | 31 (Good) | 23 (Good) | 16 (Good) | 8.1 (Good) | 6.2 (Good) | 20 (Good) | 15 (Good) | 22 (Good) | 24 (Good) | 11 (Good) | 12 (Good) | 16 (Good) | 20 (Good) | 25 (Good) |
PM10 179 (Very bad Hazardous)
particulate matter (PM10) suspended dustPM2,5 35 (Unhealthy for Sensitive Groups)
particulate matter (PM2.5) dustO3 0.04 (Good)
ozone (O3)NO2 0 (Good)
nitrogen dioxide (NO2)SO2 0 (Good)
sulfur dioxide (SO2)新监测站
| index | 2022-05-27 |
|---|---|
| pm10 | 56 |
| pm25 | 56 |
| o3 | 0.03 |
| no2 | 0 |
| so2 | 0 |
新监测站

| index | 2020-05 | 2020-04 | 2020-03 | 2020-02 | 2020-01 | 2019-12 | 2019-11 | 2019-10 | 2019-09 | 2019-08 | 2019-07 | 2019-06 | 2019-05 | 2019-04 | 2019-03 | 2019-02 | 2019-01 | 2018-12 | 2018-11 | 2018-10 |
|---|---|---|---|---|---|---|---|---|---|---|---|---|---|---|---|---|---|---|---|---|
| pm25 | 31 | 41 | 33 | 33 | 43 | 51 | 45 | 49 | 37 | 27 | 18 | 28 | 34 | 29 | 38 | 29 | 51 | 39 | 34 | 37 |
| co | 676 | 582 | 658 | 554 | 653 | 510 | 534 | 622 | 531 | 266 | 473 | 598 | 438 | 505 | 569 | 680 | 793 | 608 | 497 | 609 |
| no2 | 16 | 24 | 19 | 9.9 | 23 | 38 | 32 | 25 | 21 | 14 | 10 | 13 | 12 | 15 | 22 | 12 | 34 | 29 | 22 | 28 |
| o3 | 130 | 144 | 80 | 77 | 61 | 83 | 131 | 148 | 175 | 140 | 105 | 113 | 132 | 107 | 98 | 55 | 62 | 52 | 80 | 121 |
| pm10 | 44 | 54 | 37 | 34 | 39 | 58 | 71 | 67 | 56 | 41 | 25 | 34 | 51 | 41 | 50 | 25 | 57 | 40 | 46 | 55 |
| so2 | 22 | 24 | 20 | 24 | 17 | 33 | 31 | 23 | 16 | 8.1 | 6.2 | 20 | 15 | 22 | 24 | 11 | 12 | 16 | 20 | 25 |