Air Pollution in Santian: Real-time Air Quality Index and smog alert.
Pollution and air quality forecast for Santian. Today is Tuesday, June 2, 2026. The following air pollution values have been recorded for Santian:- particulate matter (PM10) suspended dust - 179 (Very bad Hazardous)
- particulate matter (PM2.5) dust - 35 (Unhealthy for Sensitive Groups)
- ozone (O3) - 0 (Good)
- nitrogen dioxide (NO2) - 0 (Good)
- sulfur dioxide (SO2) - 0 (Good)

What is the air quality in Santian today? Is the air polluted in Santian?. Is there smog?
What is the level of PM10 today in Santian? (particulate matter (PM10) suspended dust)
The current level of particulate matter PM10 in Santian is:
179 (Very bad Hazardous)
The highest PM10 values usually occur in month: 116 (December 2019).
The lowest value of particulate matter PM10 pollution in Santian is usually recorded in: July (38).
What is the current level of PM2.5 in Santian? (particulate matter (PM2.5) dust)
Today's PM2.5 level is:
35 (Unhealthy for Sensitive Groups)
For comparison, the highest level of PM2.5 in Santian in the last 7 days was: 56 (Friday, May 27, 2022) and the lowest: 56 (Friday, May 27, 2022).
The highest PM2.5 values were recorded: 81 (January 2019).
The lowest level of particulate matter PM2.5 pollution occurs in month: July (21).
How is the O3 level today in Santian? (ozone (O3))
0 (Good)
How high is the level of NO2? (nitrogen dioxide (NO2))
0 (Good)
What is the level of SO2 pollution? (sulfur dioxide (SO2))
0 (Good)
Current data Friday, May 27, 2022, 12:00 PM
PM10 179 (Very bad Hazardous)
PM2,5 35 (Unhealthy for Sensitive Groups)
O3 0 (Good)
NO2 0 (Good)
SO2 0 (Good)
Data on air pollution from recent days in Santian
index
2022-05-27
pm10
56
Unhealthy for Sensitive Groups
pm25
56
Unhealthy
o3
0
Good
no2
0
Good
so2
0
Good
data source »
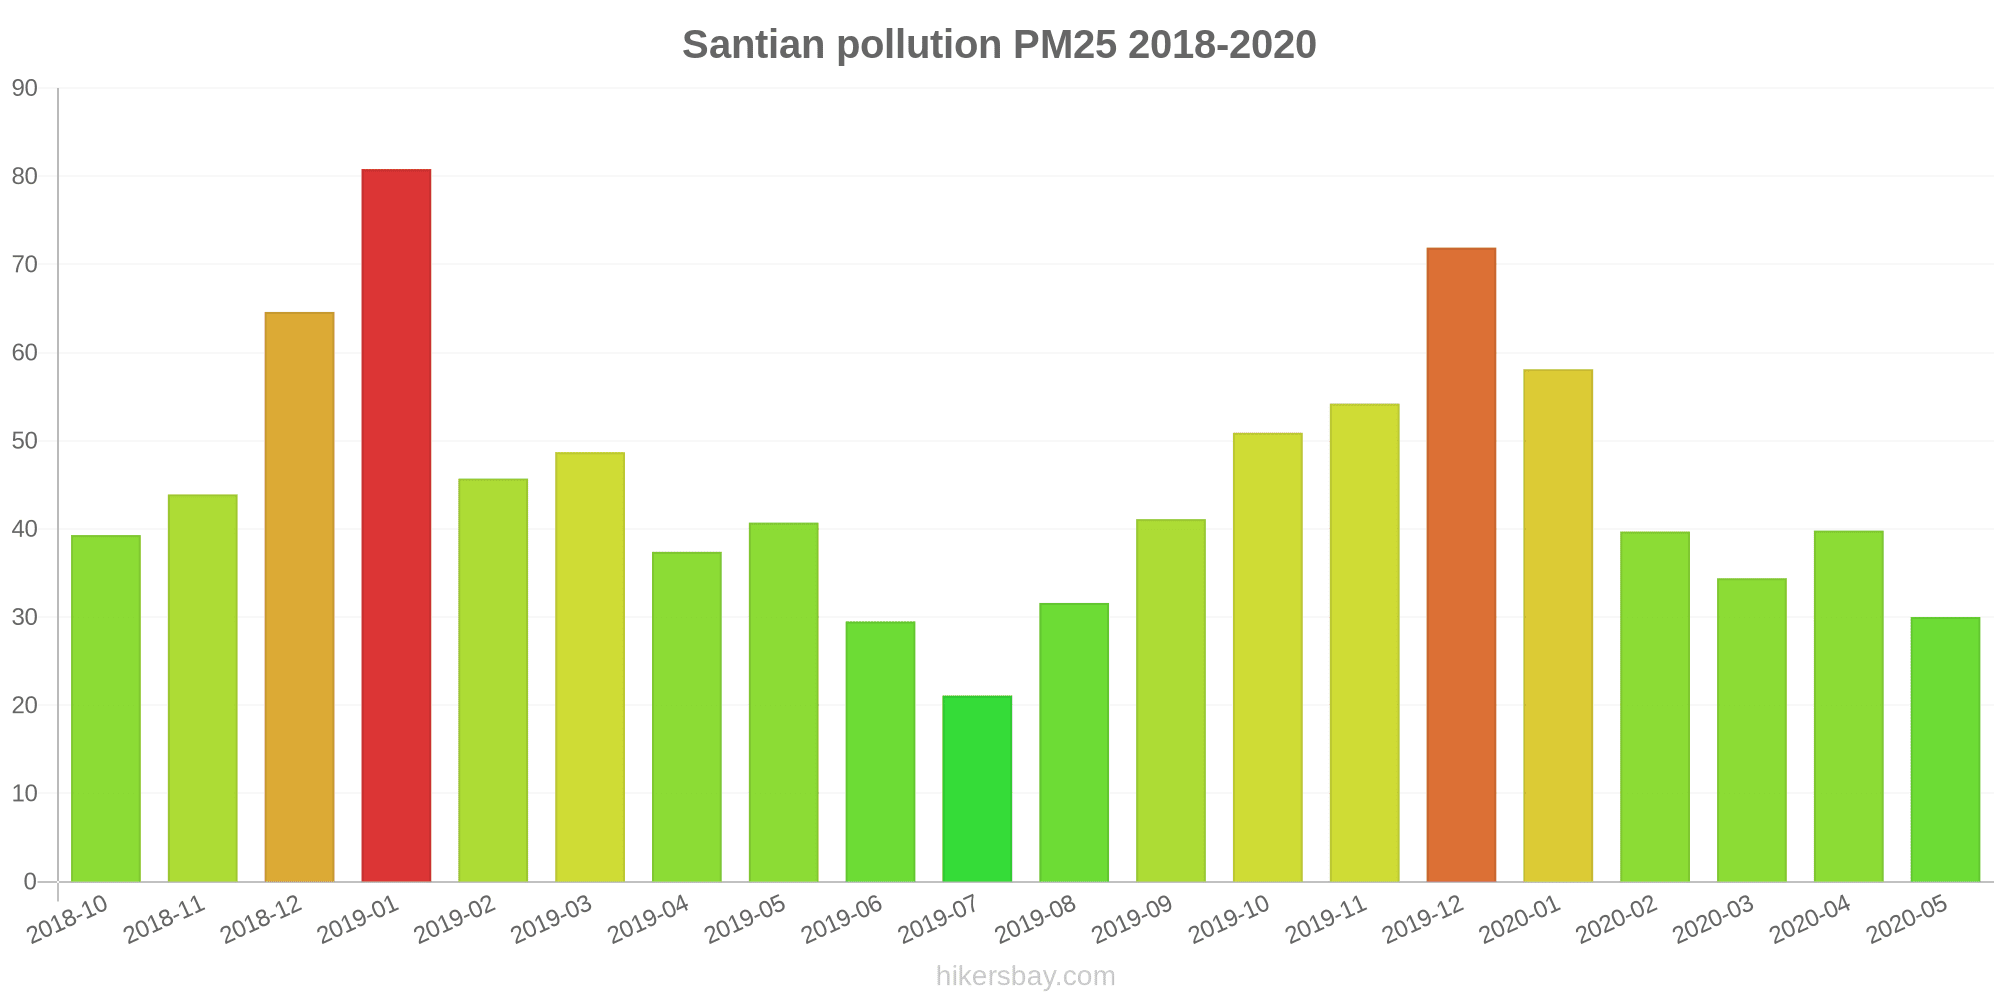
Air pollution in Santian from October 2018 to May 2020

index
2020-05
2020-04
2020-03
2020-02
2020-01
2019-12
2019-11
2019-10
2019-09
2019-08
2019-07
2019-06
2019-05
2019-04
2019-03
2019-02
2019-01
2018-12
2018-11
2018-10
pm25
30 (Moderate)
40 (Unhealthy for Sensitive Groups)
34 (Moderate)
40 (Unhealthy for Sensitive Groups)
58 (Unhealthy)
72 (Unhealthy)
54 (Unhealthy for Sensitive Groups)
51 (Unhealthy for Sensitive Groups)
41 (Unhealthy for Sensitive Groups)
32 (Moderate)
21 (Moderate)
30 (Moderate)
41 (Unhealthy for Sensitive Groups)
37 (Unhealthy for Sensitive Groups)
49 (Unhealthy for Sensitive Groups)
46 (Unhealthy for Sensitive Groups)
81 (Very Unhealthy)
65 (Unhealthy)
44 (Unhealthy for Sensitive Groups)
39 (Unhealthy for Sensitive Groups)
co
1 (Good)
1 (Good)
1 (Good)
1 (Good)
1 (Good)
1 (Good)
1 (Good)
1 (Good)
1 (Good)
1 (Good)
1 (Good)
1 (Good)
1 (Good)
1 (Good)
1 (Good)
1 (Good)
2 (Good)
1 (Good)
1 (Good)
1 (Good)
no2
19 (Good)
31 (Good)
24 (Good)
18 (Good)
30 (Good)
48 (Moderate)
42 (Moderate)
36 (Good)
27 (Good)
19 (Good)
16 (Good)
14 (Good)
20 (Good)
20 (Good)
32 (Good)
16 (Good)
28 (Good)
30 (Good)
34 (Good)
38 (Good)
o3
119 (Moderate)
129 (Unhealthy for Sensitive Groups)
74 (Moderate)
69 (Good)
48 (Good)
65 (Good)
112 (Moderate)
127 (Unhealthy for Sensitive Groups)
178 (Unhealthy)
149 (Unhealthy for Sensitive Groups)
105 (Moderate)
111 (Moderate)
108 (Moderate)
83 (Moderate)
74 (Moderate)
37 (Good)
36 (Good)
27 (Good)
62 (Good)
82 (Moderate)
pm10
53 (Unhealthy for Sensitive Groups)
68 (Unhealthy for Sensitive Groups)
52 (Unhealthy for Sensitive Groups)
54 (Unhealthy for Sensitive Groups)
81 (Unhealthy)
116 (Very Unhealthy)
109 (Unhealthy)
89 (Unhealthy)
75 (Unhealthy for Sensitive Groups)
58 (Unhealthy for Sensitive Groups)
38 (Moderate)
47 (Moderate)
67 (Unhealthy for Sensitive Groups)
54 (Unhealthy for Sensitive Groups)
73 (Unhealthy for Sensitive Groups)
61 (Unhealthy for Sensitive Groups)
112 (Very Unhealthy)
93 (Unhealthy)
78 (Unhealthy for Sensitive Groups)
76 (Unhealthy for Sensitive Groups)
so2
13 (Good)
16 (Good)
14 (Good)
8.4 (Good)
7.6 (Good)
16 (Good)
23 (Good)
19 (Good)
19 (Good)
17 (Good)
11 (Good)
13 (Good)
14 (Good)
14 (Good)
17 (Good)
10 (Good)
14 (Good)
14 (Good)
17 (Good)
16 (Good)
data source »
中医院
Friday, May 27, 2022, 12:00 PM
PM10 179 (Very bad Hazardous)
particulate matter (PM10) suspended dust
PM2,5 35 (Unhealthy for Sensitive Groups)
particulate matter (PM2.5) dust
O3 0.04 (Good)
ozone (O3)
NO2 0 (Good)
nitrogen dioxide (NO2)
SO2 0 (Good)
sulfur dioxide (SO2)
中医院
index
2022-05-27
pm10
56
pm25
56
o3
0.03
no2
0
so2
0
中医院
2018-10 2020-05

index
2020-05
2020-04
2020-03
2020-02
2020-01
2019-12
2019-11
2019-10
2019-09
2019-08
2019-07
2019-06
2019-05
2019-04
2019-03
2019-02
2019-01
2018-12
2018-11
2018-10
pm25
30
40
34
40
58
72
54
51
41
32
21
30
41
37
49
46
81
65
44
39
co
1
1
1
1
1
1
1
1
1
1
1
1
1
1
1
1
2
1
1
1
no2
19
31
24
18
30
48
42
36
27
19
16
14
20
20
32
16
28
30
34
38
o3
119
129
74
69
48
65
112
127
178
149
105
111
108
83
74
37
36
27
62
82
pm10
53
68
52
54
81
116
109
89
75
58
38
47
67
54
73
61
112
93
78
76
so2
13
16
14
8.4
7.6
16
23
19
19
17
11
13
14
14
17
10
14
14
17
16
* Pollution data source:
https://openaq.org
(ChinaAQIData)
The data is licensed under CC-By 4.0
PM10 179 (Very bad Hazardous)
PM2,5 35 (Unhealthy for Sensitive Groups)
O3 0 (Good)
NO2 0 (Good)
SO2 0 (Good)
Data on air pollution from recent days in Santian
| index | 2022-05-27 |
|---|---|
| pm10 | 56 Unhealthy for Sensitive Groups |
| pm25 | 56 Unhealthy |
| o3 | 0 Good |
| no2 | 0 Good |
| so2 | 0 Good |
| index | 2020-05 | 2020-04 | 2020-03 | 2020-02 | 2020-01 | 2019-12 | 2019-11 | 2019-10 | 2019-09 | 2019-08 | 2019-07 | 2019-06 | 2019-05 | 2019-04 | 2019-03 | 2019-02 | 2019-01 | 2018-12 | 2018-11 | 2018-10 |
|---|---|---|---|---|---|---|---|---|---|---|---|---|---|---|---|---|---|---|---|---|
| pm25 | 30 (Moderate) | 40 (Unhealthy for Sensitive Groups) | 34 (Moderate) | 40 (Unhealthy for Sensitive Groups) | 58 (Unhealthy) | 72 (Unhealthy) | 54 (Unhealthy for Sensitive Groups) | 51 (Unhealthy for Sensitive Groups) | 41 (Unhealthy for Sensitive Groups) | 32 (Moderate) | 21 (Moderate) | 30 (Moderate) | 41 (Unhealthy for Sensitive Groups) | 37 (Unhealthy for Sensitive Groups) | 49 (Unhealthy for Sensitive Groups) | 46 (Unhealthy for Sensitive Groups) | 81 (Very Unhealthy) | 65 (Unhealthy) | 44 (Unhealthy for Sensitive Groups) | 39 (Unhealthy for Sensitive Groups) |
| co | 1 (Good) | 1 (Good) | 1 (Good) | 1 (Good) | 1 (Good) | 1 (Good) | 1 (Good) | 1 (Good) | 1 (Good) | 1 (Good) | 1 (Good) | 1 (Good) | 1 (Good) | 1 (Good) | 1 (Good) | 1 (Good) | 2 (Good) | 1 (Good) | 1 (Good) | 1 (Good) |
| no2 | 19 (Good) | 31 (Good) | 24 (Good) | 18 (Good) | 30 (Good) | 48 (Moderate) | 42 (Moderate) | 36 (Good) | 27 (Good) | 19 (Good) | 16 (Good) | 14 (Good) | 20 (Good) | 20 (Good) | 32 (Good) | 16 (Good) | 28 (Good) | 30 (Good) | 34 (Good) | 38 (Good) |
| o3 | 119 (Moderate) | 129 (Unhealthy for Sensitive Groups) | 74 (Moderate) | 69 (Good) | 48 (Good) | 65 (Good) | 112 (Moderate) | 127 (Unhealthy for Sensitive Groups) | 178 (Unhealthy) | 149 (Unhealthy for Sensitive Groups) | 105 (Moderate) | 111 (Moderate) | 108 (Moderate) | 83 (Moderate) | 74 (Moderate) | 37 (Good) | 36 (Good) | 27 (Good) | 62 (Good) | 82 (Moderate) |
| pm10 | 53 (Unhealthy for Sensitive Groups) | 68 (Unhealthy for Sensitive Groups) | 52 (Unhealthy for Sensitive Groups) | 54 (Unhealthy for Sensitive Groups) | 81 (Unhealthy) | 116 (Very Unhealthy) | 109 (Unhealthy) | 89 (Unhealthy) | 75 (Unhealthy for Sensitive Groups) | 58 (Unhealthy for Sensitive Groups) | 38 (Moderate) | 47 (Moderate) | 67 (Unhealthy for Sensitive Groups) | 54 (Unhealthy for Sensitive Groups) | 73 (Unhealthy for Sensitive Groups) | 61 (Unhealthy for Sensitive Groups) | 112 (Very Unhealthy) | 93 (Unhealthy) | 78 (Unhealthy for Sensitive Groups) | 76 (Unhealthy for Sensitive Groups) |
| so2 | 13 (Good) | 16 (Good) | 14 (Good) | 8.4 (Good) | 7.6 (Good) | 16 (Good) | 23 (Good) | 19 (Good) | 19 (Good) | 17 (Good) | 11 (Good) | 13 (Good) | 14 (Good) | 14 (Good) | 17 (Good) | 10 (Good) | 14 (Good) | 14 (Good) | 17 (Good) | 16 (Good) |
PM10 179 (Very bad Hazardous)
particulate matter (PM10) suspended dustPM2,5 35 (Unhealthy for Sensitive Groups)
particulate matter (PM2.5) dustO3 0.04 (Good)
ozone (O3)NO2 0 (Good)
nitrogen dioxide (NO2)SO2 0 (Good)
sulfur dioxide (SO2)中医院
| index | 2022-05-27 |
|---|---|
| pm10 | 56 |
| pm25 | 56 |
| o3 | 0.03 |
| no2 | 0 |
| so2 | 0 |
中医院

| index | 2020-05 | 2020-04 | 2020-03 | 2020-02 | 2020-01 | 2019-12 | 2019-11 | 2019-10 | 2019-09 | 2019-08 | 2019-07 | 2019-06 | 2019-05 | 2019-04 | 2019-03 | 2019-02 | 2019-01 | 2018-12 | 2018-11 | 2018-10 |
|---|---|---|---|---|---|---|---|---|---|---|---|---|---|---|---|---|---|---|---|---|
| pm25 | 30 | 40 | 34 | 40 | 58 | 72 | 54 | 51 | 41 | 32 | 21 | 30 | 41 | 37 | 49 | 46 | 81 | 65 | 44 | 39 |
| co | 1 | 1 | 1 | 1 | 1 | 1 | 1 | 1 | 1 | 1 | 1 | 1 | 1 | 1 | 1 | 1 | 2 | 1 | 1 | 1 |
| no2 | 19 | 31 | 24 | 18 | 30 | 48 | 42 | 36 | 27 | 19 | 16 | 14 | 20 | 20 | 32 | 16 | 28 | 30 | 34 | 38 |
| o3 | 119 | 129 | 74 | 69 | 48 | 65 | 112 | 127 | 178 | 149 | 105 | 111 | 108 | 83 | 74 | 37 | 36 | 27 | 62 | 82 |
| pm10 | 53 | 68 | 52 | 54 | 81 | 116 | 109 | 89 | 75 | 58 | 38 | 47 | 67 | 54 | 73 | 61 | 112 | 93 | 78 | 76 |
| so2 | 13 | 16 | 14 | 8.4 | 7.6 | 16 | 23 | 19 | 19 | 17 | 11 | 13 | 14 | 14 | 17 | 10 | 14 | 14 | 17 | 16 |