Air Pollution in Xiaochengezhuang: Real-time Air Quality Index and smog alert.
Pollution and air quality forecast for Xiaochengezhuang. Today is Saturday, June 13, 2026. The following air pollution values have been recorded for Xiaochengezhuang:- nitrogen dioxide (NO2) - 7 (Good)
- particulate matter (PM10) suspended dust - 19 (Good)
- ozone (O3) - 91 (Moderate)
- particulate matter (PM2.5) dust - 10 (Good)
- sulfur dioxide (SO2) - 0 (Good)
- carbon monoxide (CO) - 100 (Good)

What is the air quality in Xiaochengezhuang today? Is the air polluted in Xiaochengezhuang?. Is there smog?
How high is the level of NO2? (nitrogen dioxide (NO2))
7 (Good)
What is the level of PM10 today in Xiaochengezhuang? (particulate matter (PM10) suspended dust)
The current level of particulate matter PM10 in Xiaochengezhuang is:
19 (Good)
The highest PM10 values usually occur in month: 114 (November 2018).
The lowest value of particulate matter PM10 pollution in Xiaochengezhuang is usually recorded in: August (39).
How is the O3 level today in Xiaochengezhuang? (ozone (O3))
91 (Moderate)
What is the current level of PM2.5 in Xiaochengezhuang? (particulate matter (PM2.5) dust)
Today's PM2.5 level is:
10 (Good)
For comparison, the highest level of PM2.5 in Xiaochengezhuang in the last 7 days was: 20 (Friday, May 27, 2022) and the lowest: 20 (Friday, May 27, 2022).
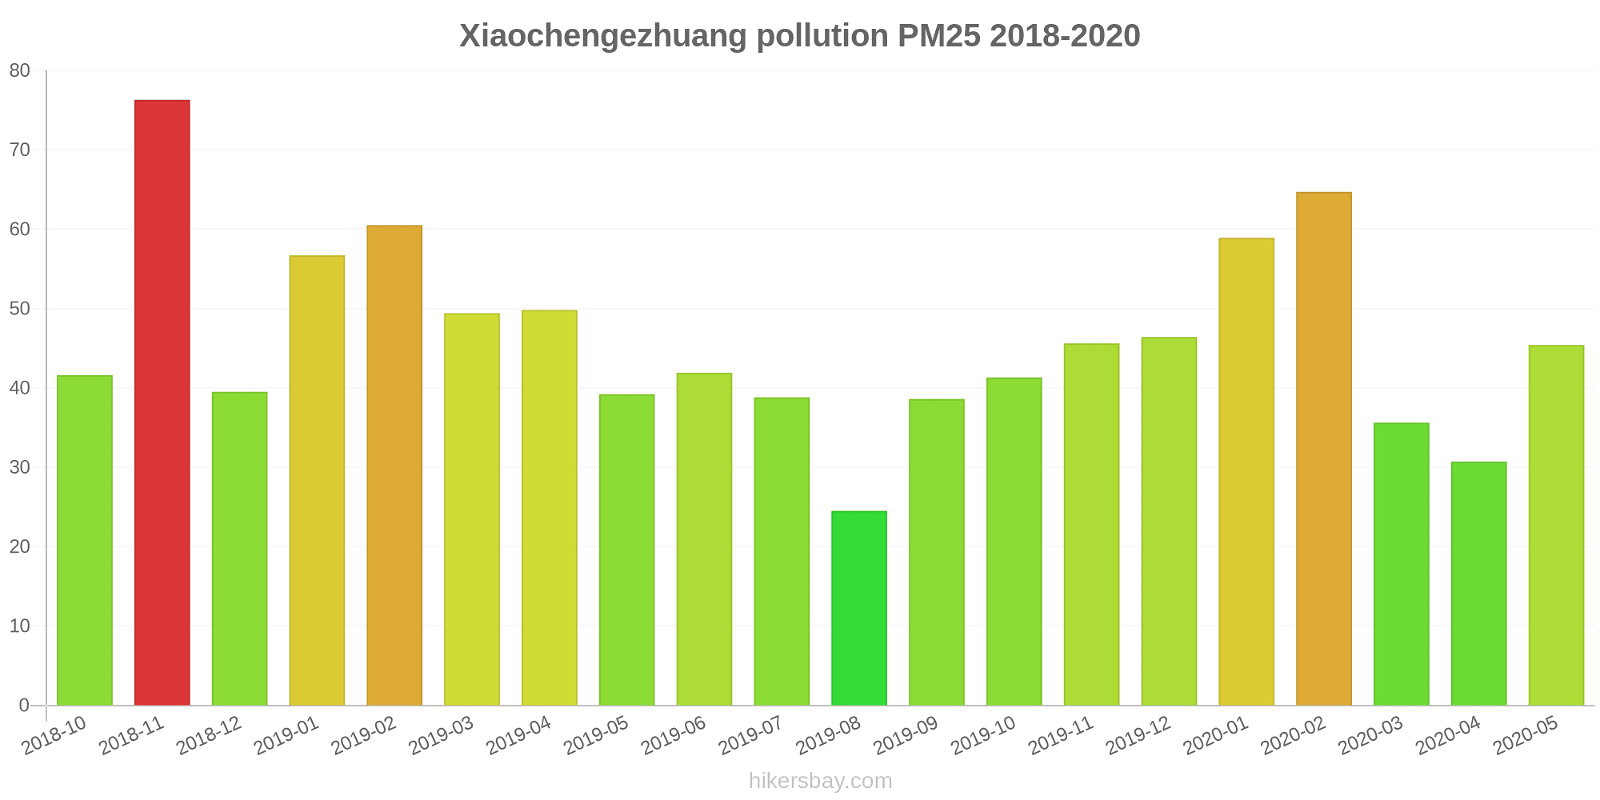
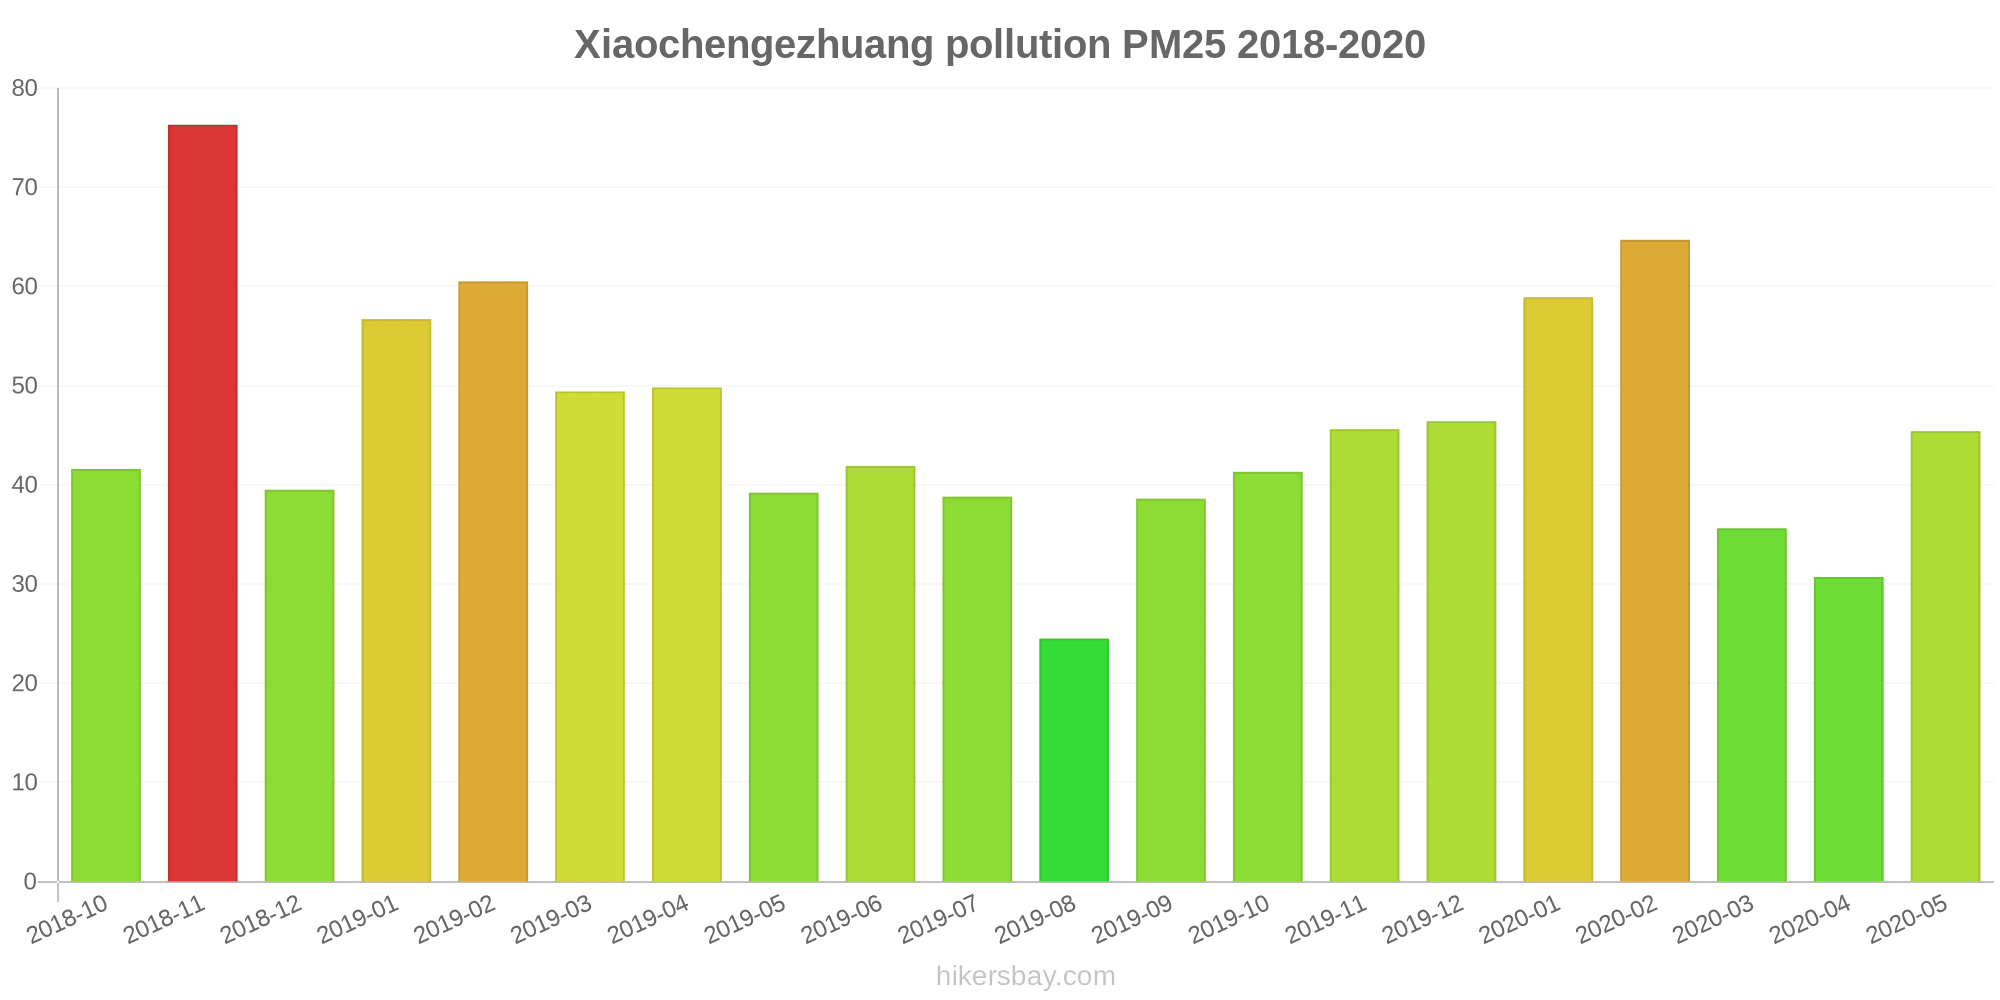
The highest PM2.5 values were recorded: 76 (November 2018).
The lowest level of particulate matter PM2.5 pollution occurs in month: August (25).
What is the level of SO2 pollution? (sulfur dioxide (SO2))
0 (Good)
How high is the CO level? (carbon monoxide (CO))
100 (Good)
Current data Friday, May 27, 2022, 12:00 PM
NO2 7 (Good)
PM10 19 (Good)
O3 91 (Moderate)
PM2,5 10 (Good)
SO2 0 (Good)
CO 100 (Good)
Data on air pollution from recent days in Xiaochengezhuang
index
2022-05-27
no2
20
Good
pm10
27
Moderate
o3
39
Good
pm25
20
Moderate
so2
5
Good
co
240
Good
data source »
Air pollution in Xiaochengezhuang from October 2018 to May 2020
index
2020-05
2020-04
2020-03
2020-02
2020-01
2019-12
2019-11
2019-10
2019-09
2019-08
2019-07
2019-06
2019-05
2019-04
2019-03
2019-02
2019-01
2018-12
2018-11
2018-10
pm25
45 (Unhealthy for Sensitive Groups)
31 (Moderate)
36 (Unhealthy for Sensitive Groups)
65 (Unhealthy)
59 (Unhealthy)
46 (Unhealthy for Sensitive Groups)
46 (Unhealthy for Sensitive Groups)
41 (Unhealthy for Sensitive Groups)
39 (Unhealthy for Sensitive Groups)
25 (Moderate)
39 (Unhealthy for Sensitive Groups)
42 (Unhealthy for Sensitive Groups)
39 (Unhealthy for Sensitive Groups)
50 (Unhealthy for Sensitive Groups)
49 (Unhealthy for Sensitive Groups)
61 (Unhealthy)
57 (Unhealthy)
40 (Unhealthy for Sensitive Groups)
76 (Very Unhealthy)
42 (Unhealthy for Sensitive Groups)
co
675 (Good)
413 (Good)
464 (Good)
926 (Good)
1 (Good)
914 (Good)
832 (Good)
773 (Good)
755 (Good)
610 (Good)
753 (Good)
855 (Good)
551 (Good)
636 (Good)
631 (Good)
896 (Good)
971 (Good)
825 (Good)
1 (Good)
781 (Good)
no2
22 (Good)
26 (Good)
26 (Good)
30 (Good)
44 (Moderate)
51 (Moderate)
50 (Moderate)
45 (Moderate)
38 (Good)
28 (Good)
28 (Good)
28 (Good)
34 (Good)
36 (Good)
43 (Moderate)
38 (Good)
53 (Moderate)
45 (Moderate)
65 (Moderate)
52 (Moderate)
o3
138 (Unhealthy for Sensitive Groups)
130 (Unhealthy for Sensitive Groups)
97 (Moderate)
83 (Moderate)
67 (Good)
47 (Good)
45 (Good)
75 (Moderate)
185 (Very Unhealthy)
148 (Unhealthy for Sensitive Groups)
198 (Very Unhealthy)
213 (Very Unhealthy)
169 (Unhealthy)
120 (Unhealthy for Sensitive Groups)
102 (Moderate)
72 (Moderate)
50 (Good)
46 (Good)
48 (Good)
69 (Good)
pm10
67 (Unhealthy for Sensitive Groups)
68 (Unhealthy for Sensitive Groups)
54 (Unhealthy for Sensitive Groups)
59 (Unhealthy for Sensitive Groups)
67 (Unhealthy for Sensitive Groups)
65 (Unhealthy for Sensitive Groups)
83 (Unhealthy)
70 (Unhealthy for Sensitive Groups)
61 (Unhealthy for Sensitive Groups)
39 (Moderate)
54 (Unhealthy for Sensitive Groups)
65 (Unhealthy for Sensitive Groups)
79 (Unhealthy for Sensitive Groups)
90 (Unhealthy)
82 (Unhealthy)
77 (Unhealthy for Sensitive Groups)
88 (Unhealthy)
82 (Unhealthy)
114 (Very Unhealthy)
68 (Unhealthy for Sensitive Groups)
so2
3.8 (Good)
3.8 (Good)
3.6 (Good)
4.5 (Good)
7.6 (Good)
4.8 (Good)
6 (Good)
3.3 (Good)
3.4 (Good)
2.6 (Good)
2.8 (Good)
4.6 (Good)
4.4 (Good)
5.3 (Good)
5.3 (Good)
6.7 (Good)
9.3 (Good)
8.2 (Good)
7.5 (Good)
5.2 (Good)
data source »
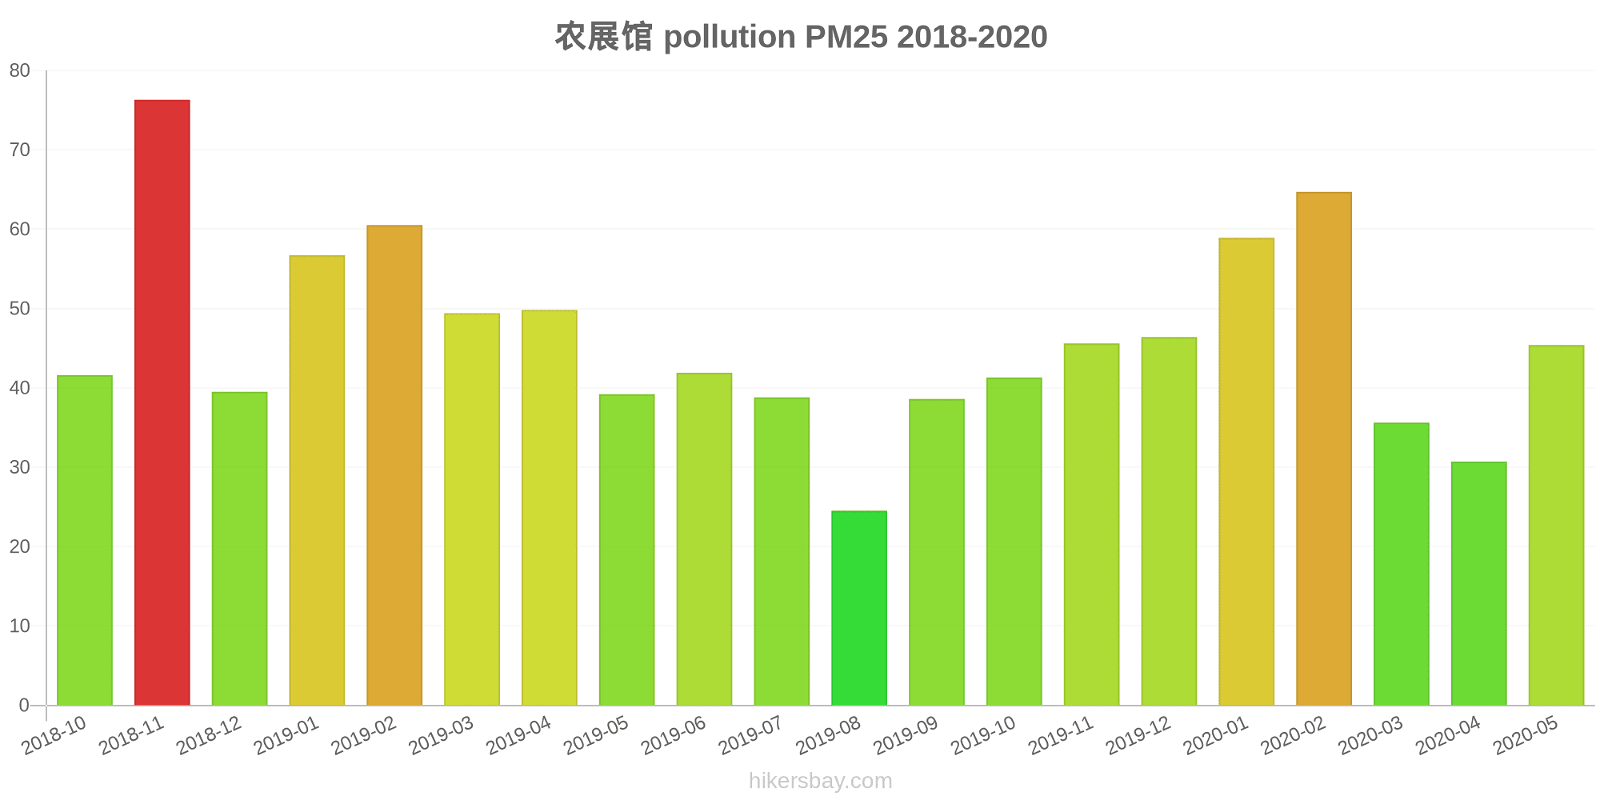
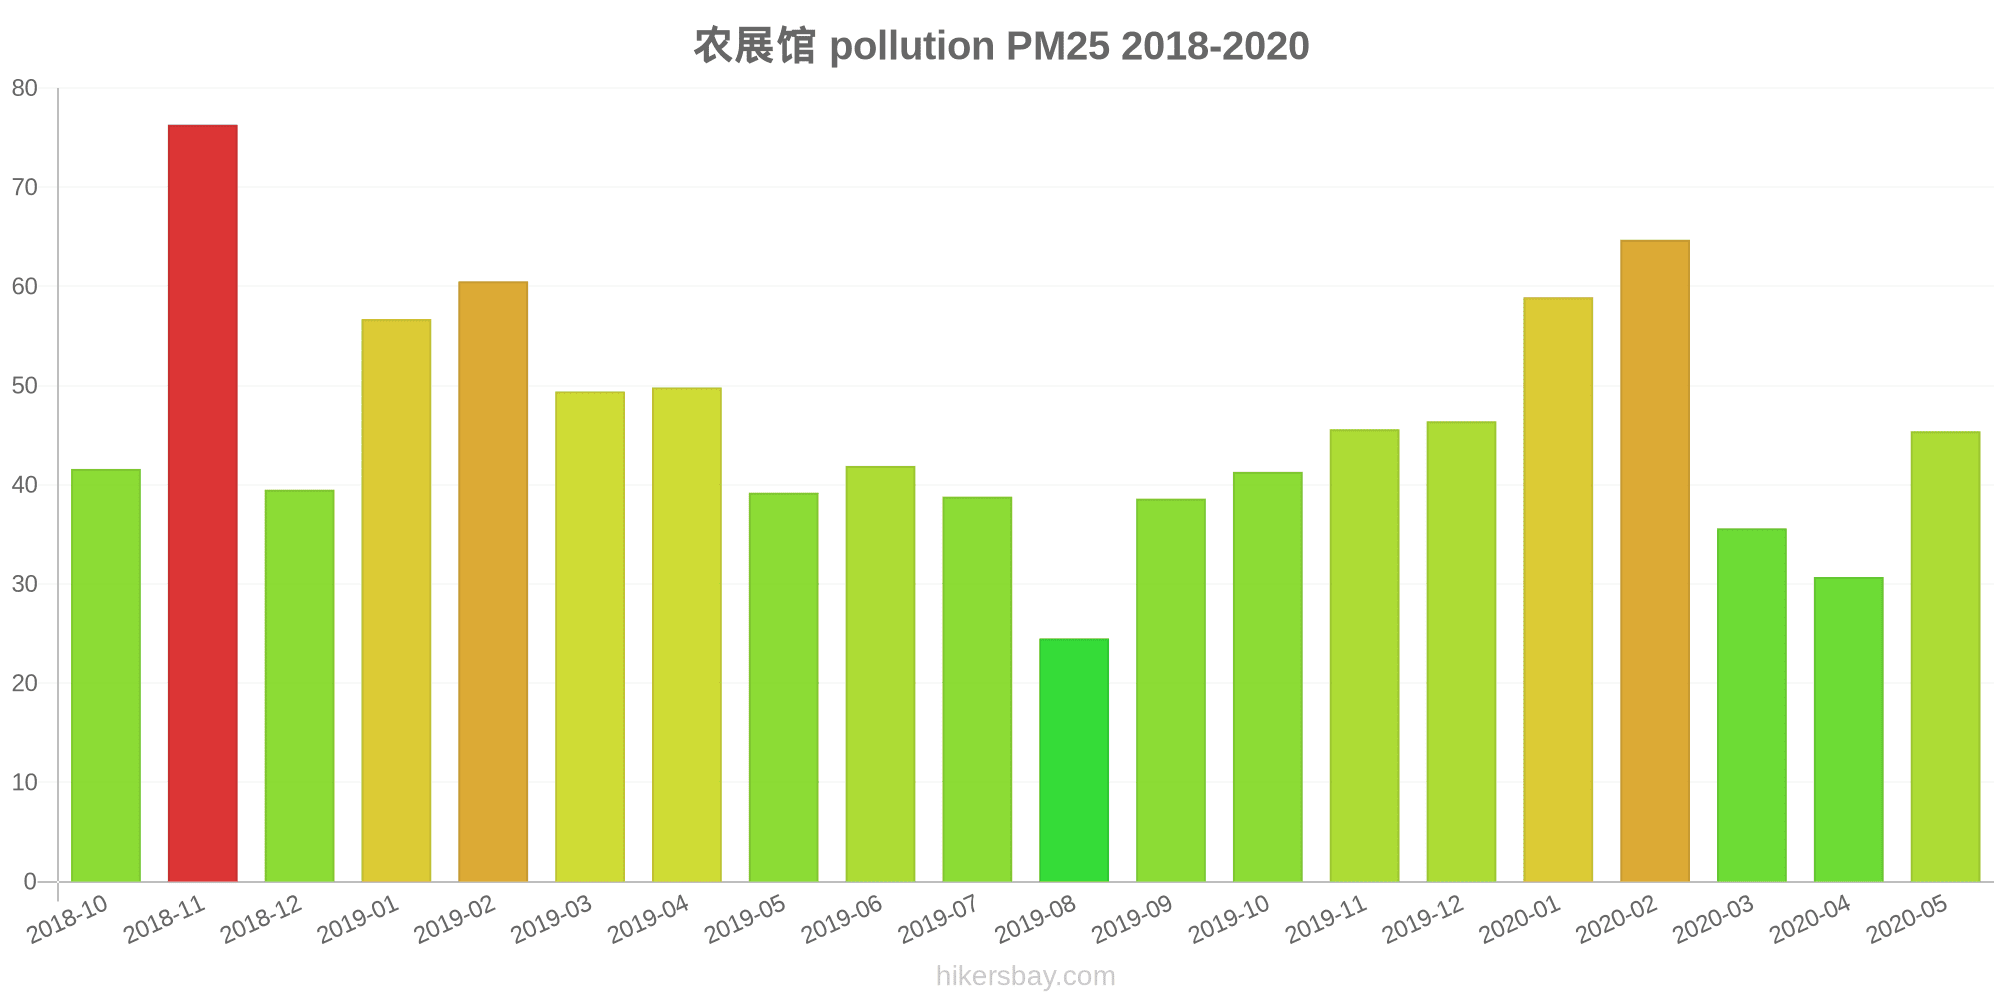
农展馆
Friday, May 27, 2022, 12:00 PM
NO2 7.3 (Good)
nitrogen dioxide (NO2)
PM10 19 (Good)
particulate matter (PM10) suspended dust
O3 91 (Moderate)
ozone (O3)
PM2,5 10 (Good)
particulate matter (PM2.5) dust
SO2 0.1 (Good)
sulfur dioxide (SO2)
CO 100 (Good)
carbon monoxide (CO)
农展馆
index
2022-05-27
no2
20
pm10
27
o3
39
pm25
20
so2
4.9
co
240
农展馆
2018-10 2020-05
index
2020-05
2020-04
2020-03
2020-02
2020-01
2019-12
2019-11
2019-10
2019-09
2019-08
2019-07
2019-06
2019-05
2019-04
2019-03
2019-02
2019-01
2018-12
2018-11
2018-10
pm25
45
31
36
65
59
46
46
41
39
25
39
42
39
50
49
61
57
40
76
42
co
675
413
464
926
1
914
832
773
755
610
753
855
551
636
631
896
971
825
1
781
no2
22
26
26
30
44
51
50
45
38
28
28
28
34
36
43
38
53
45
65
52
o3
138
130
97
83
67
47
45
75
185
148
198
213
169
120
102
72
50
46
48
69
pm10
67
68
54
59
67
65
83
70
61
39
54
65
79
90
82
77
88
82
114
68
so2
3.8
3.8
3.6
4.5
7.6
4.8
6
3.3
3.4
2.6
2.8
4.6
4.4
5.3
5.3
6.7
9.3
8.2
7.5
5.2
* Pollution data source:
https://openaq.org
(ChinaAQIData)
The data is licensed under CC-By 4.0
NO2 7 (Good)
PM10 19 (Good)
O3 91 (Moderate)
PM2,5 10 (Good)
SO2 0 (Good)
CO 100 (Good)
Data on air pollution from recent days in Xiaochengezhuang
| index | 2022-05-27 |
|---|---|
| no2 | 20 Good |
| pm10 | 27 Moderate |
| o3 | 39 Good |
| pm25 | 20 Moderate |
| so2 | 5 Good |
| co | 240 Good |
| index | 2020-05 | 2020-04 | 2020-03 | 2020-02 | 2020-01 | 2019-12 | 2019-11 | 2019-10 | 2019-09 | 2019-08 | 2019-07 | 2019-06 | 2019-05 | 2019-04 | 2019-03 | 2019-02 | 2019-01 | 2018-12 | 2018-11 | 2018-10 |
|---|---|---|---|---|---|---|---|---|---|---|---|---|---|---|---|---|---|---|---|---|
| pm25 | 45 (Unhealthy for Sensitive Groups) | 31 (Moderate) | 36 (Unhealthy for Sensitive Groups) | 65 (Unhealthy) | 59 (Unhealthy) | 46 (Unhealthy for Sensitive Groups) | 46 (Unhealthy for Sensitive Groups) | 41 (Unhealthy for Sensitive Groups) | 39 (Unhealthy for Sensitive Groups) | 25 (Moderate) | 39 (Unhealthy for Sensitive Groups) | 42 (Unhealthy for Sensitive Groups) | 39 (Unhealthy for Sensitive Groups) | 50 (Unhealthy for Sensitive Groups) | 49 (Unhealthy for Sensitive Groups) | 61 (Unhealthy) | 57 (Unhealthy) | 40 (Unhealthy for Sensitive Groups) | 76 (Very Unhealthy) | 42 (Unhealthy for Sensitive Groups) |
| co | 675 (Good) | 413 (Good) | 464 (Good) | 926 (Good) | 1 (Good) | 914 (Good) | 832 (Good) | 773 (Good) | 755 (Good) | 610 (Good) | 753 (Good) | 855 (Good) | 551 (Good) | 636 (Good) | 631 (Good) | 896 (Good) | 971 (Good) | 825 (Good) | 1 (Good) | 781 (Good) |
| no2 | 22 (Good) | 26 (Good) | 26 (Good) | 30 (Good) | 44 (Moderate) | 51 (Moderate) | 50 (Moderate) | 45 (Moderate) | 38 (Good) | 28 (Good) | 28 (Good) | 28 (Good) | 34 (Good) | 36 (Good) | 43 (Moderate) | 38 (Good) | 53 (Moderate) | 45 (Moderate) | 65 (Moderate) | 52 (Moderate) |
| o3 | 138 (Unhealthy for Sensitive Groups) | 130 (Unhealthy for Sensitive Groups) | 97 (Moderate) | 83 (Moderate) | 67 (Good) | 47 (Good) | 45 (Good) | 75 (Moderate) | 185 (Very Unhealthy) | 148 (Unhealthy for Sensitive Groups) | 198 (Very Unhealthy) | 213 (Very Unhealthy) | 169 (Unhealthy) | 120 (Unhealthy for Sensitive Groups) | 102 (Moderate) | 72 (Moderate) | 50 (Good) | 46 (Good) | 48 (Good) | 69 (Good) |
| pm10 | 67 (Unhealthy for Sensitive Groups) | 68 (Unhealthy for Sensitive Groups) | 54 (Unhealthy for Sensitive Groups) | 59 (Unhealthy for Sensitive Groups) | 67 (Unhealthy for Sensitive Groups) | 65 (Unhealthy for Sensitive Groups) | 83 (Unhealthy) | 70 (Unhealthy for Sensitive Groups) | 61 (Unhealthy for Sensitive Groups) | 39 (Moderate) | 54 (Unhealthy for Sensitive Groups) | 65 (Unhealthy for Sensitive Groups) | 79 (Unhealthy for Sensitive Groups) | 90 (Unhealthy) | 82 (Unhealthy) | 77 (Unhealthy for Sensitive Groups) | 88 (Unhealthy) | 82 (Unhealthy) | 114 (Very Unhealthy) | 68 (Unhealthy for Sensitive Groups) |
| so2 | 3.8 (Good) | 3.8 (Good) | 3.6 (Good) | 4.5 (Good) | 7.6 (Good) | 4.8 (Good) | 6 (Good) | 3.3 (Good) | 3.4 (Good) | 2.6 (Good) | 2.8 (Good) | 4.6 (Good) | 4.4 (Good) | 5.3 (Good) | 5.3 (Good) | 6.7 (Good) | 9.3 (Good) | 8.2 (Good) | 7.5 (Good) | 5.2 (Good) |
NO2 7.3 (Good)
nitrogen dioxide (NO2)PM10 19 (Good)
particulate matter (PM10) suspended dustO3 91 (Moderate)
ozone (O3)PM2,5 10 (Good)
particulate matter (PM2.5) dustSO2 0.1 (Good)
sulfur dioxide (SO2)CO 100 (Good)
carbon monoxide (CO)农展馆
| index | 2022-05-27 |
|---|---|
| no2 | 20 |
| pm10 | 27 |
| o3 | 39 |
| pm25 | 20 |
| so2 | 4.9 |
| co | 240 |
农展馆
| index | 2020-05 | 2020-04 | 2020-03 | 2020-02 | 2020-01 | 2019-12 | 2019-11 | 2019-10 | 2019-09 | 2019-08 | 2019-07 | 2019-06 | 2019-05 | 2019-04 | 2019-03 | 2019-02 | 2019-01 | 2018-12 | 2018-11 | 2018-10 |
|---|---|---|---|---|---|---|---|---|---|---|---|---|---|---|---|---|---|---|---|---|
| pm25 | 45 | 31 | 36 | 65 | 59 | 46 | 46 | 41 | 39 | 25 | 39 | 42 | 39 | 50 | 49 | 61 | 57 | 40 | 76 | 42 |
| co | 675 | 413 | 464 | 926 | 1 | 914 | 832 | 773 | 755 | 610 | 753 | 855 | 551 | 636 | 631 | 896 | 971 | 825 | 1 | 781 |
| no2 | 22 | 26 | 26 | 30 | 44 | 51 | 50 | 45 | 38 | 28 | 28 | 28 | 34 | 36 | 43 | 38 | 53 | 45 | 65 | 52 |
| o3 | 138 | 130 | 97 | 83 | 67 | 47 | 45 | 75 | 185 | 148 | 198 | 213 | 169 | 120 | 102 | 72 | 50 | 46 | 48 | 69 |
| pm10 | 67 | 68 | 54 | 59 | 67 | 65 | 83 | 70 | 61 | 39 | 54 | 65 | 79 | 90 | 82 | 77 | 88 | 82 | 114 | 68 |
| so2 | 3.8 | 3.8 | 3.6 | 4.5 | 7.6 | 4.8 | 6 | 3.3 | 3.4 | 2.6 | 2.8 | 4.6 | 4.4 | 5.3 | 5.3 | 6.7 | 9.3 | 8.2 | 7.5 | 5.2 |