Air Pollution in Lujing: Real-time Air Quality Index and smog alert.
Pollution and air quality forecast for Lujing. Today is Saturday, June 13, 2026. The following air pollution values have been recorded for Lujing:- nitrogen dioxide (NO2) - 7 (Good)
- particulate matter (PM10) suspended dust - 19 (Good)
- ozone (O3) - 91 (Moderate)
- particulate matter (PM2.5) dust - 10 (Good)
- sulfur dioxide (SO2) - 0 (Good)
- carbon monoxide (CO) - 100 (Good)

What is the air quality in Lujing today? Is the air polluted in Lujing?. Is there smog?
How high is the level of NO2? (nitrogen dioxide (NO2))
7 (Good)
What is the level of PM10 today in Lujing? (particulate matter (PM10) suspended dust)
The current level of particulate matter PM10 in Lujing is:
19 (Good)
The highest PM10 values usually occur in month: 127 (January 2019).
The lowest value of particulate matter PM10 pollution in Lujing is usually recorded in: August (46).
How is the O3 level today in Lujing? (ozone (O3))
91 (Moderate)
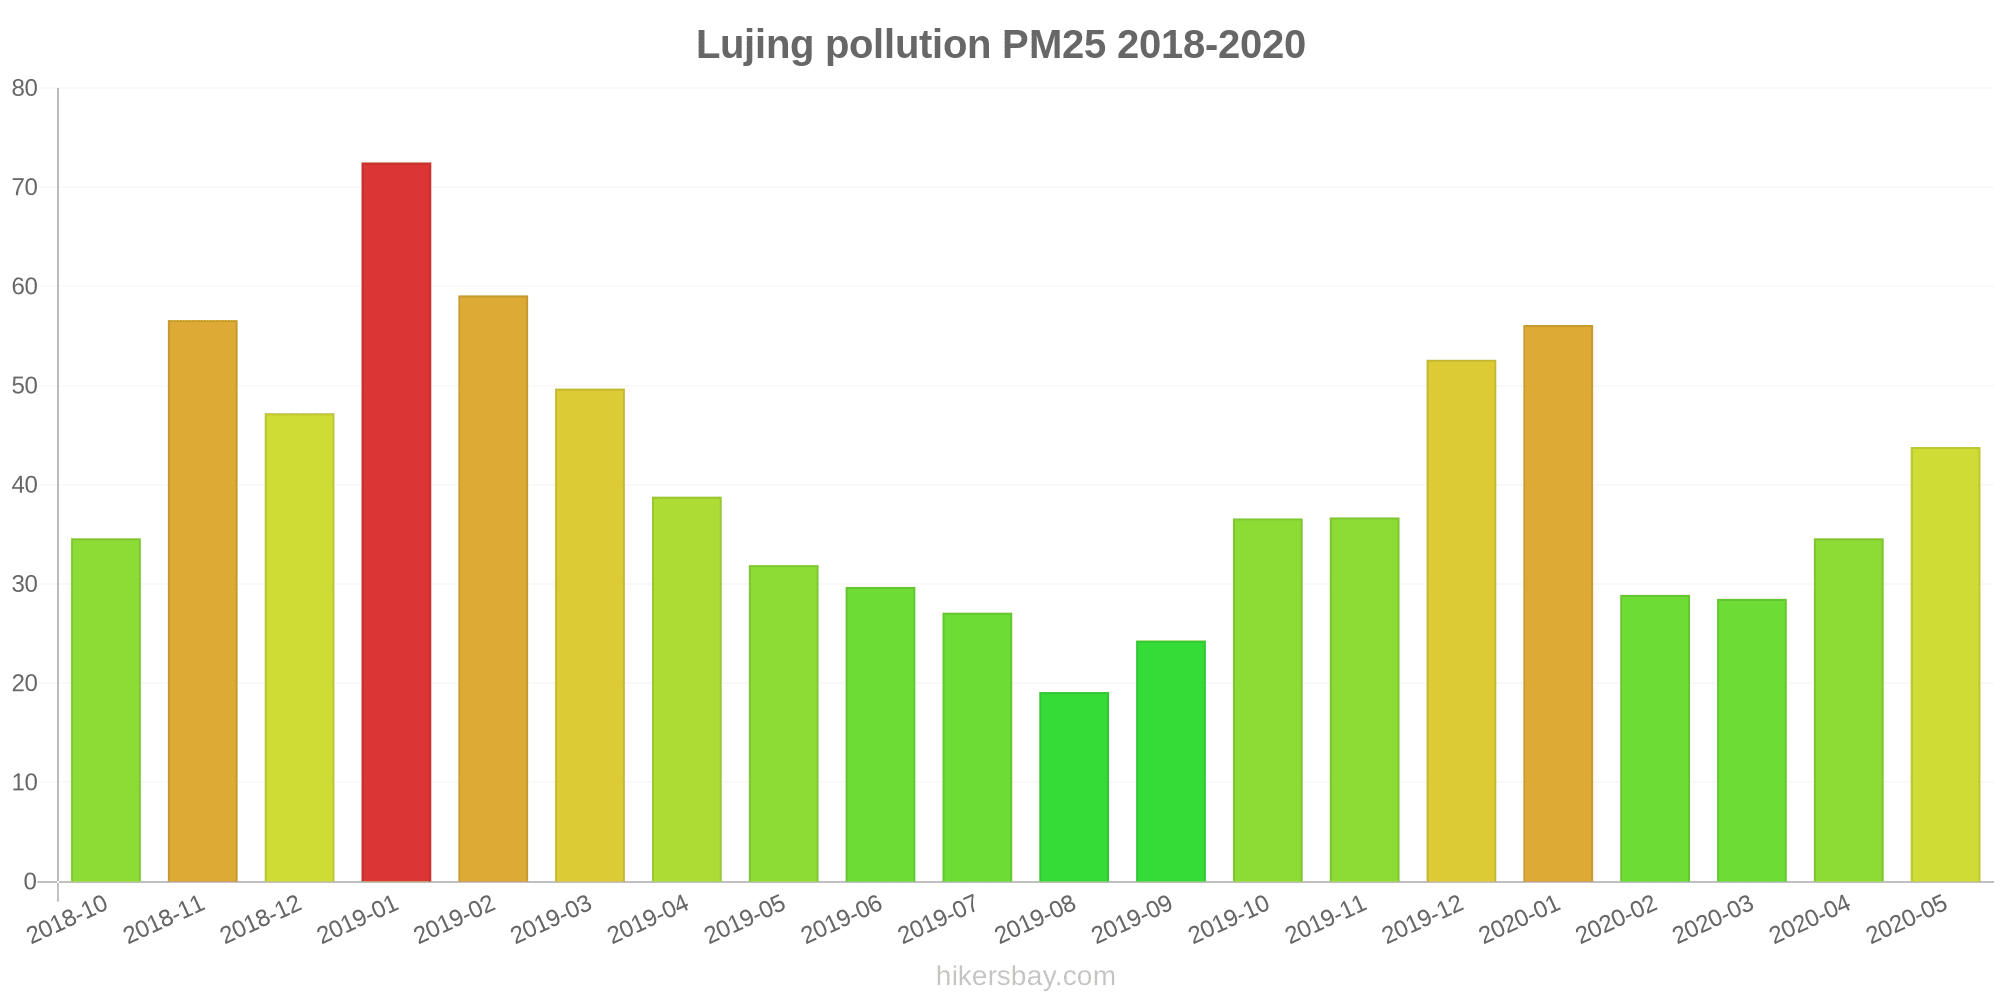
What is the current level of PM2.5 in Lujing? (particulate matter (PM2.5) dust)
Today's PM2.5 level is:
10 (Good)
For comparison, the highest level of PM2.5 in Lujing in the last 7 days was: 20 (Friday, May 27, 2022) and the lowest: 20 (Friday, May 27, 2022).
The highest PM2.5 values were recorded: 73 (January 2019).
The lowest level of particulate matter PM2.5 pollution occurs in month: August (19).
What is the level of SO2 pollution? (sulfur dioxide (SO2))
0 (Good)
How high is the CO level? (carbon monoxide (CO))
100 (Good)
Current data Friday, May 27, 2022, 12:00 PM
NO2 7 (Good)
PM10 19 (Good)
O3 91 (Moderate)
PM2,5 10 (Good)
SO2 0 (Good)
CO 100 (Good)
Data on air pollution from recent days in Lujing
index
2022-05-27
no2
20
Good
pm10
27
Moderate
o3
39
Good
pm25
20
Moderate
so2
5
Good
co
240
Good
data source »
Air pollution in Lujing from October 2018 to May 2020

index
2020-05
2020-04
2020-03
2020-02
2020-01
2019-12
2019-11
2019-10
2019-09
2019-08
2019-07
2019-06
2019-05
2019-04
2019-03
2019-02
2019-01
2018-12
2018-11
2018-10
pm25
44 (Unhealthy for Sensitive Groups)
35 (Moderate)
29 (Moderate)
29 (Moderate)
56 (Unhealthy)
53 (Unhealthy for Sensitive Groups)
37 (Unhealthy for Sensitive Groups)
37 (Unhealthy for Sensitive Groups)
24 (Moderate)
19 (Moderate)
27 (Moderate)
30 (Moderate)
32 (Moderate)
39 (Unhealthy for Sensitive Groups)
50 (Unhealthy for Sensitive Groups)
59 (Unhealthy)
73 (Unhealthy)
47 (Unhealthy for Sensitive Groups)
57 (Unhealthy)
35 (Moderate)
co
682 (Good)
866 (Good)
741 (Good)
574 (Good)
683 (Good)
1 (Good)
846 (Good)
736 (Good)
582 (Good)
459 (Good)
599 (Good)
558 (Good)
547 (Good)
614 (Good)
823 (Good)
668 (Good)
736 (Good)
641 (Good)
793 (Good)
639 (Good)
no2
30 (Good)
45 (Moderate)
48 (Moderate)
31 (Good)
46 (Moderate)
68 (Moderate)
62 (Moderate)
53 (Moderate)
36 (Good)
24 (Good)
29 (Good)
33 (Good)
47 (Moderate)
45 (Moderate)
60 (Moderate)
40 (Good)
55 (Moderate)
47 (Moderate)
58 (Moderate)
47 (Moderate)
o3
172 (Unhealthy)
144 (Unhealthy for Sensitive Groups)
117 (Moderate)
96 (Moderate)
72 (Moderate)
75 (Moderate)
104 (Moderate)
127 (Unhealthy for Sensitive Groups)
167 (Unhealthy)
168 (Unhealthy)
172 (Unhealthy)
198 (Very Unhealthy)
163 (Unhealthy)
133 (Unhealthy for Sensitive Groups)
107 (Moderate)
89 (Moderate)
67 (Good)
52 (Good)
98 (Moderate)
120 (Unhealthy for Sensitive Groups)
pm10
71 (Unhealthy for Sensitive Groups)
78 (Unhealthy for Sensitive Groups)
67 (Unhealthy for Sensitive Groups)
52 (Unhealthy for Sensitive Groups)
86 (Unhealthy)
95 (Unhealthy)
98 (Unhealthy)
95 (Unhealthy)
56 (Unhealthy for Sensitive Groups)
46 (Moderate)
53 (Unhealthy for Sensitive Groups)
63 (Unhealthy for Sensitive Groups)
83 (Unhealthy)
84 (Unhealthy)
109 (Unhealthy)
95 (Unhealthy)
127 (Very Unhealthy)
94 (Unhealthy)
109 (Unhealthy)
89 (Unhealthy)
so2
5.1 (Good)
5.4 (Good)
6 (Good)
4 (Good)
3.7 (Good)
8 (Good)
8.6 (Good)
9.5 (Good)
7 (Good)
7.2 (Good)
10 (Good)
7.7 (Good)
16 (Good)
13 (Good)
14 (Good)
10 (Good)
13 (Good)
11 (Good)
9.2 (Good)
7.6 (Good)
data source »
奥体中心
Friday, May 27, 2022, 12:00 PM
NO2 7.3 (Good)
nitrogen dioxide (NO2)
PM10 19 (Good)
particulate matter (PM10) suspended dust
O3 91 (Moderate)
ozone (O3)
PM2,5 10 (Good)
particulate matter (PM2.5) dust
SO2 0.1 (Good)
sulfur dioxide (SO2)
CO 100 (Good)
carbon monoxide (CO)
奥体中心
index
2022-05-27
no2
20
pm10
27
o3
39
pm25
20
so2
4.9
co
240
奥体中心
2018-10 2020-05

index
2020-05
2020-04
2020-03
2020-02
2020-01
2019-12
2019-11
2019-10
2019-09
2019-08
2019-07
2019-06
2019-05
2019-04
2019-03
2019-02
2019-01
2018-12
2018-11
2018-10
pm25
44
35
29
29
56
53
37
37
24
19
27
30
32
39
50
59
73
47
57
35
co
682
866
741
574
683
1
846
736
582
459
599
558
547
614
823
668
736
641
793
639
no2
30
45
48
31
46
68
62
53
36
24
29
33
47
45
60
40
55
47
58
47
o3
172
144
117
96
72
75
104
127
167
168
172
198
163
133
107
89
67
52
98
120
pm10
71
78
67
52
86
95
98
95
56
46
53
63
83
84
109
95
127
94
109
89
so2
5.1
5.4
6
4
3.7
8
8.6
9.5
7
7.2
10
7.7
16
13
14
10
13
11
9.2
7.6
* Pollution data source:
https://openaq.org
(ChinaAQIData)
The data is licensed under CC-By 4.0
NO2 7 (Good)
PM10 19 (Good)
O3 91 (Moderate)
PM2,5 10 (Good)
SO2 0 (Good)
CO 100 (Good)
Data on air pollution from recent days in Lujing
| index | 2022-05-27 |
|---|---|
| no2 | 20 Good |
| pm10 | 27 Moderate |
| o3 | 39 Good |
| pm25 | 20 Moderate |
| so2 | 5 Good |
| co | 240 Good |
| index | 2020-05 | 2020-04 | 2020-03 | 2020-02 | 2020-01 | 2019-12 | 2019-11 | 2019-10 | 2019-09 | 2019-08 | 2019-07 | 2019-06 | 2019-05 | 2019-04 | 2019-03 | 2019-02 | 2019-01 | 2018-12 | 2018-11 | 2018-10 |
|---|---|---|---|---|---|---|---|---|---|---|---|---|---|---|---|---|---|---|---|---|
| pm25 | 44 (Unhealthy for Sensitive Groups) | 35 (Moderate) | 29 (Moderate) | 29 (Moderate) | 56 (Unhealthy) | 53 (Unhealthy for Sensitive Groups) | 37 (Unhealthy for Sensitive Groups) | 37 (Unhealthy for Sensitive Groups) | 24 (Moderate) | 19 (Moderate) | 27 (Moderate) | 30 (Moderate) | 32 (Moderate) | 39 (Unhealthy for Sensitive Groups) | 50 (Unhealthy for Sensitive Groups) | 59 (Unhealthy) | 73 (Unhealthy) | 47 (Unhealthy for Sensitive Groups) | 57 (Unhealthy) | 35 (Moderate) |
| co | 682 (Good) | 866 (Good) | 741 (Good) | 574 (Good) | 683 (Good) | 1 (Good) | 846 (Good) | 736 (Good) | 582 (Good) | 459 (Good) | 599 (Good) | 558 (Good) | 547 (Good) | 614 (Good) | 823 (Good) | 668 (Good) | 736 (Good) | 641 (Good) | 793 (Good) | 639 (Good) |
| no2 | 30 (Good) | 45 (Moderate) | 48 (Moderate) | 31 (Good) | 46 (Moderate) | 68 (Moderate) | 62 (Moderate) | 53 (Moderate) | 36 (Good) | 24 (Good) | 29 (Good) | 33 (Good) | 47 (Moderate) | 45 (Moderate) | 60 (Moderate) | 40 (Good) | 55 (Moderate) | 47 (Moderate) | 58 (Moderate) | 47 (Moderate) |
| o3 | 172 (Unhealthy) | 144 (Unhealthy for Sensitive Groups) | 117 (Moderate) | 96 (Moderate) | 72 (Moderate) | 75 (Moderate) | 104 (Moderate) | 127 (Unhealthy for Sensitive Groups) | 167 (Unhealthy) | 168 (Unhealthy) | 172 (Unhealthy) | 198 (Very Unhealthy) | 163 (Unhealthy) | 133 (Unhealthy for Sensitive Groups) | 107 (Moderate) | 89 (Moderate) | 67 (Good) | 52 (Good) | 98 (Moderate) | 120 (Unhealthy for Sensitive Groups) |
| pm10 | 71 (Unhealthy for Sensitive Groups) | 78 (Unhealthy for Sensitive Groups) | 67 (Unhealthy for Sensitive Groups) | 52 (Unhealthy for Sensitive Groups) | 86 (Unhealthy) | 95 (Unhealthy) | 98 (Unhealthy) | 95 (Unhealthy) | 56 (Unhealthy for Sensitive Groups) | 46 (Moderate) | 53 (Unhealthy for Sensitive Groups) | 63 (Unhealthy for Sensitive Groups) | 83 (Unhealthy) | 84 (Unhealthy) | 109 (Unhealthy) | 95 (Unhealthy) | 127 (Very Unhealthy) | 94 (Unhealthy) | 109 (Unhealthy) | 89 (Unhealthy) |
| so2 | 5.1 (Good) | 5.4 (Good) | 6 (Good) | 4 (Good) | 3.7 (Good) | 8 (Good) | 8.6 (Good) | 9.5 (Good) | 7 (Good) | 7.2 (Good) | 10 (Good) | 7.7 (Good) | 16 (Good) | 13 (Good) | 14 (Good) | 10 (Good) | 13 (Good) | 11 (Good) | 9.2 (Good) | 7.6 (Good) |
NO2 7.3 (Good)
nitrogen dioxide (NO2)PM10 19 (Good)
particulate matter (PM10) suspended dustO3 91 (Moderate)
ozone (O3)PM2,5 10 (Good)
particulate matter (PM2.5) dustSO2 0.1 (Good)
sulfur dioxide (SO2)CO 100 (Good)
carbon monoxide (CO)奥体中心
| index | 2022-05-27 |
|---|---|
| no2 | 20 |
| pm10 | 27 |
| o3 | 39 |
| pm25 | 20 |
| so2 | 4.9 |
| co | 240 |
奥体中心

| index | 2020-05 | 2020-04 | 2020-03 | 2020-02 | 2020-01 | 2019-12 | 2019-11 | 2019-10 | 2019-09 | 2019-08 | 2019-07 | 2019-06 | 2019-05 | 2019-04 | 2019-03 | 2019-02 | 2019-01 | 2018-12 | 2018-11 | 2018-10 |
|---|---|---|---|---|---|---|---|---|---|---|---|---|---|---|---|---|---|---|---|---|
| pm25 | 44 | 35 | 29 | 29 | 56 | 53 | 37 | 37 | 24 | 19 | 27 | 30 | 32 | 39 | 50 | 59 | 73 | 47 | 57 | 35 |
| co | 682 | 866 | 741 | 574 | 683 | 1 | 846 | 736 | 582 | 459 | 599 | 558 | 547 | 614 | 823 | 668 | 736 | 641 | 793 | 639 |
| no2 | 30 | 45 | 48 | 31 | 46 | 68 | 62 | 53 | 36 | 24 | 29 | 33 | 47 | 45 | 60 | 40 | 55 | 47 | 58 | 47 |
| o3 | 172 | 144 | 117 | 96 | 72 | 75 | 104 | 127 | 167 | 168 | 172 | 198 | 163 | 133 | 107 | 89 | 67 | 52 | 98 | 120 |
| pm10 | 71 | 78 | 67 | 52 | 86 | 95 | 98 | 95 | 56 | 46 | 53 | 63 | 83 | 84 | 109 | 95 | 127 | 94 | 109 | 89 |
| so2 | 5.1 | 5.4 | 6 | 4 | 3.7 | 8 | 8.6 | 9.5 | 7 | 7.2 | 10 | 7.7 | 16 | 13 | 14 | 10 | 13 | 11 | 9.2 | 7.6 |