Air Pollution in Wanjiazui: Real-time Air Quality Index and smog alert.
Pollution and air quality forecast for Wanjiazui. Today is Tuesday, June 2, 2026. The following air pollution values have been recorded for Wanjiazui:- particulate matter (PM10) suspended dust - 179 (Very bad Hazardous)
- particulate matter (PM2.5) dust - 35 (Unhealthy for Sensitive Groups)
- ozone (O3) - 0 (Good)
- nitrogen dioxide (NO2) - 0 (Good)
- sulfur dioxide (SO2) - 0 (Good)

What is the air quality in Wanjiazui today? Is the air polluted in Wanjiazui?. Is there smog?
What is the level of PM10 today in Wanjiazui? (particulate matter (PM10) suspended dust)
The current level of particulate matter PM10 in Wanjiazui is:
179 (Very bad Hazardous)
The highest PM10 values usually occur in month: 115 (January 2019).
The lowest value of particulate matter PM10 pollution in Wanjiazui is usually recorded in: August (47).
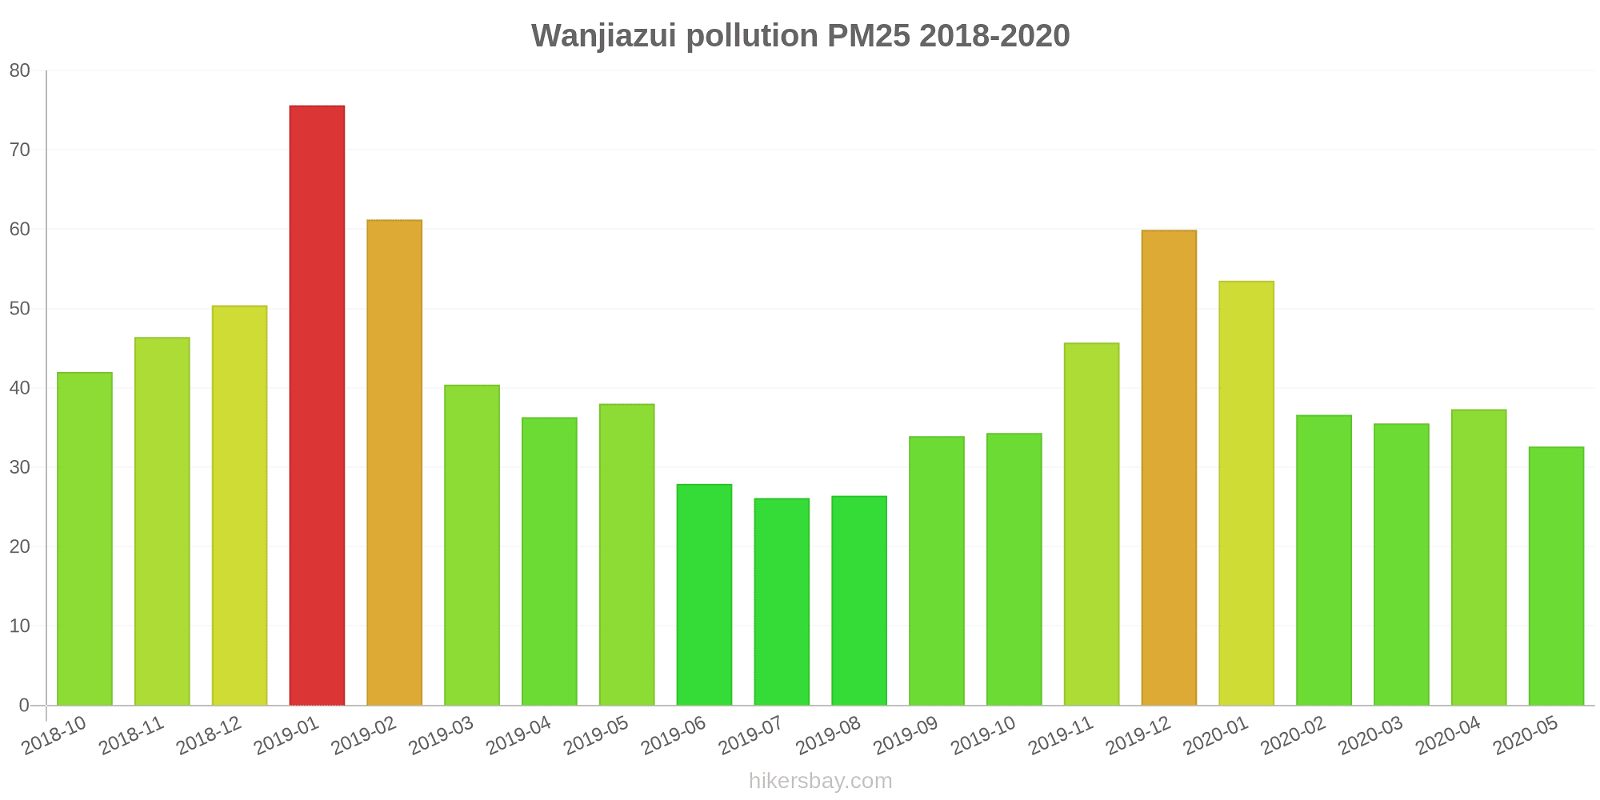
What is the current level of PM2.5 in Wanjiazui? (particulate matter (PM2.5) dust)
Today's PM2.5 level is:
35 (Unhealthy for Sensitive Groups)
For comparison, the highest level of PM2.5 in Wanjiazui in the last 7 days was: 56 (Friday, May 27, 2022) and the lowest: 56 (Friday, May 27, 2022).
The highest PM2.5 values were recorded: 76 (January 2019).
The lowest level of particulate matter PM2.5 pollution occurs in month: July (26).
How is the O3 level today in Wanjiazui? (ozone (O3))
0 (Good)
How high is the level of NO2? (nitrogen dioxide (NO2))
0 (Good)
What is the level of SO2 pollution? (sulfur dioxide (SO2))
0 (Good)
Current data Friday, May 27, 2022, 12:00 PM
PM10 179 (Very bad Hazardous)
PM2,5 35 (Unhealthy for Sensitive Groups)
O3 0 (Good)
NO2 0 (Good)
SO2 0 (Good)
Data on air pollution from recent days in Wanjiazui
index
2022-05-27
pm10
56
Unhealthy for Sensitive Groups
pm25
56
Unhealthy
o3
0
Good
no2
0
Good
so2
0
Good
data source »
Air pollution in Wanjiazui from October 2018 to May 2020
index
2020-05
2020-04
2020-03
2020-02
2020-01
2019-12
2019-11
2019-10
2019-09
2019-08
2019-07
2019-06
2019-05
2019-04
2019-03
2019-02
2019-01
2018-12
2018-11
2018-10
pm25
33 (Moderate)
37 (Unhealthy for Sensitive Groups)
36 (Unhealthy for Sensitive Groups)
37 (Unhealthy for Sensitive Groups)
54 (Unhealthy for Sensitive Groups)
60 (Unhealthy)
46 (Unhealthy for Sensitive Groups)
34 (Moderate)
34 (Moderate)
26 (Moderate)
26 (Moderate)
28 (Moderate)
38 (Unhealthy for Sensitive Groups)
36 (Unhealthy for Sensitive Groups)
40 (Unhealthy for Sensitive Groups)
61 (Unhealthy)
76 (Very Unhealthy)
50 (Unhealthy for Sensitive Groups)
46 (Unhealthy for Sensitive Groups)
42 (Unhealthy for Sensitive Groups)
co
1 (Good)
788 (Good)
1 (Good)
928 (Good)
979 (Good)
1 (Good)
917 (Good)
830 (Good)
871 (Good)
842 (Good)
740 (Good)
840 (Good)
969 (Good)
1 (Good)
859 (Good)
915 (Good)
1 (Good)
857 (Good)
942 (Good)
819 (Good)
no2
18 (Good)
28 (Good)
19 (Good)
16 (Good)
29 (Good)
47 (Moderate)
38 (Good)
28 (Good)
22 (Good)
11 (Good)
15 (Good)
18 (Good)
25 (Good)
23 (Good)
29 (Good)
21 (Good)
35 (Good)
27 (Good)
31 (Good)
32 (Good)
o3
134 (Unhealthy for Sensitive Groups)
129 (Unhealthy for Sensitive Groups)
102 (Moderate)
85 (Moderate)
58 (Good)
65 (Good)
96 (Moderate)
119 (Moderate)
161 (Unhealthy)
160 (Unhealthy)
148 (Unhealthy for Sensitive Groups)
174 (Unhealthy)
151 (Unhealthy)
123 (Unhealthy for Sensitive Groups)
105 (Moderate)
60 (Good)
63 (Good)
55 (Good)
88 (Moderate)
120 (Unhealthy for Sensitive Groups)
pm10
65 (Unhealthy for Sensitive Groups)
73 (Unhealthy for Sensitive Groups)
66 (Unhealthy for Sensitive Groups)
57 (Unhealthy for Sensitive Groups)
76 (Unhealthy for Sensitive Groups)
94 (Unhealthy)
90 (Unhealthy)
69 (Unhealthy for Sensitive Groups)
64 (Unhealthy for Sensitive Groups)
47 (Moderate)
49 (Moderate)
53 (Unhealthy for Sensitive Groups)
84 (Unhealthy)
68 (Unhealthy for Sensitive Groups)
79 (Unhealthy for Sensitive Groups)
88 (Unhealthy)
115 (Very Unhealthy)
85 (Unhealthy)
78 (Unhealthy for Sensitive Groups)
78 (Unhealthy for Sensitive Groups)
so2
18 (Good)
17 (Good)
10 (Good)
6.9 (Good)
6.8 (Good)
13 (Good)
14 (Good)
11 (Good)
12 (Good)
8.6 (Good)
11 (Good)
14 (Good)
11 (Good)
9.4 (Good)
6.8 (Good)
4.4 (Good)
5.5 (Good)
6.5 (Good)
8.6 (Good)
8.5 (Good)
data source »
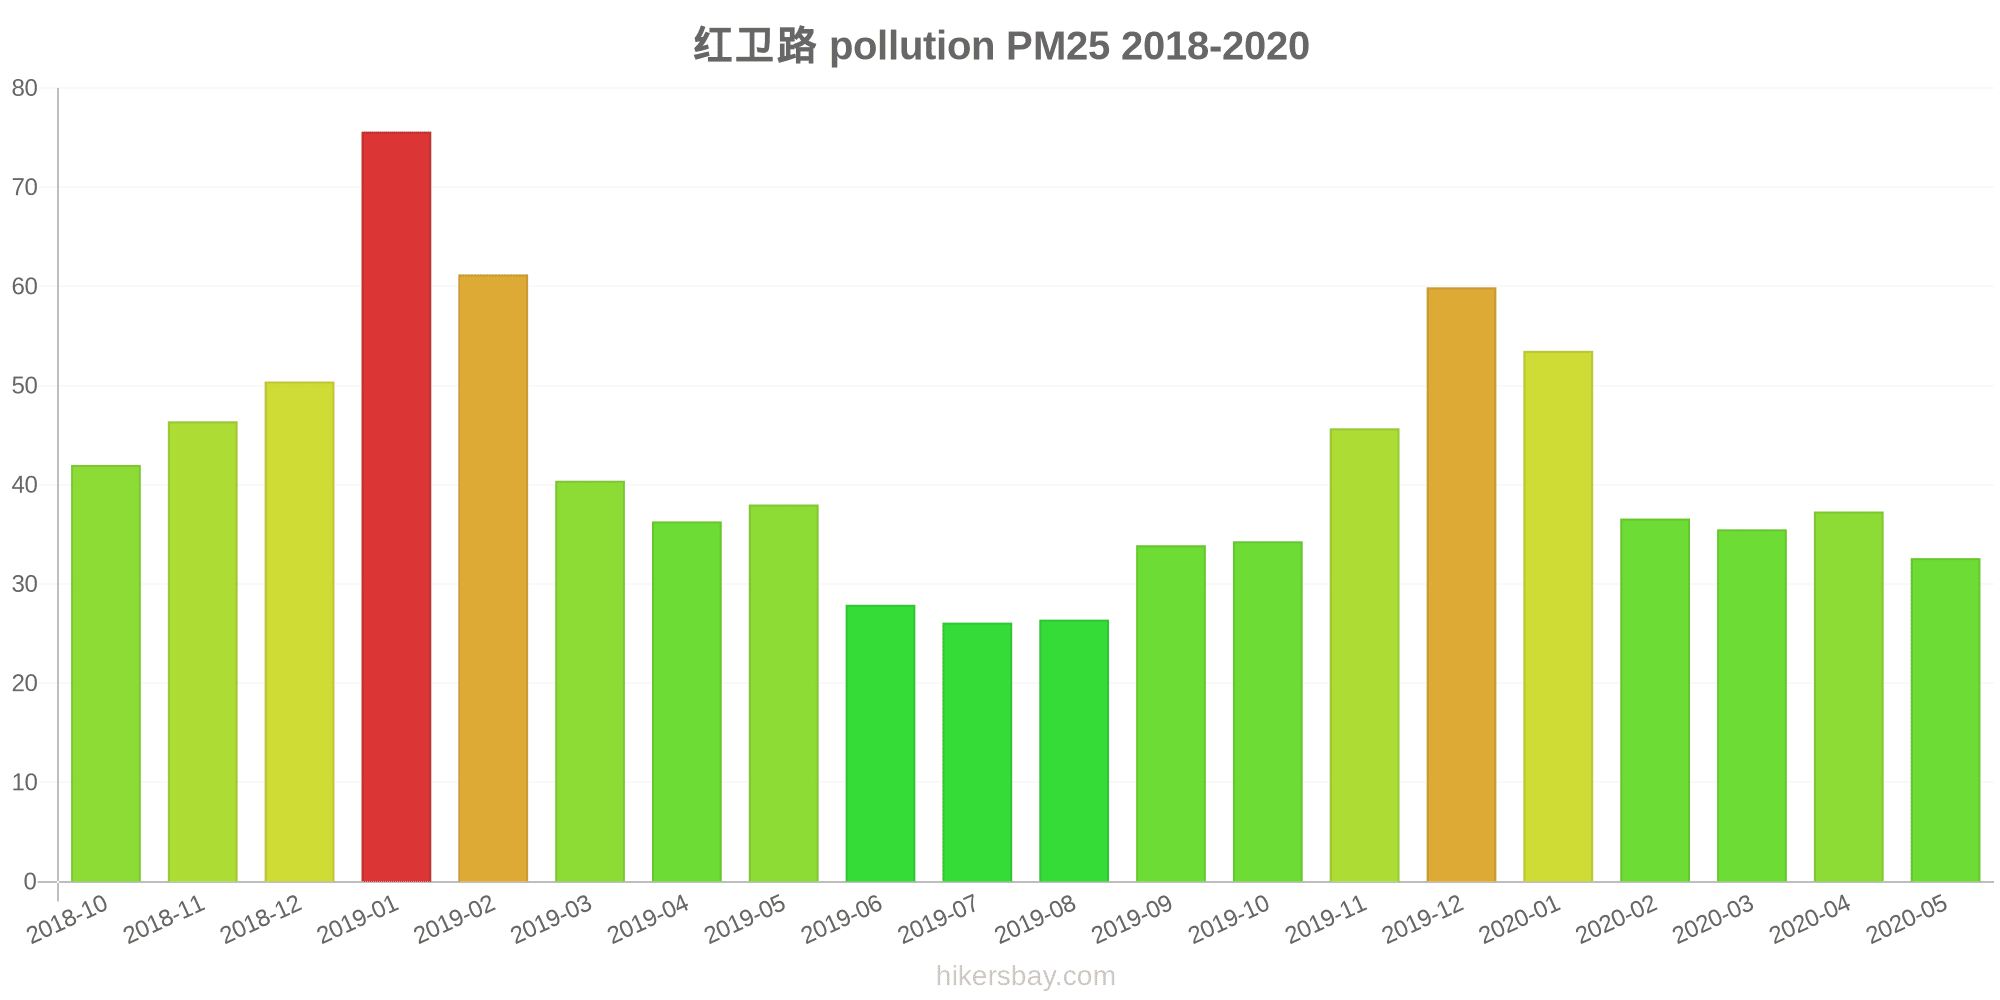
红卫路
Friday, May 27, 2022, 12:00 PM
PM10 179 (Very bad Hazardous)
particulate matter (PM10) suspended dust
PM2,5 35 (Unhealthy for Sensitive Groups)
particulate matter (PM2.5) dust
O3 0.04 (Good)
ozone (O3)
NO2 0 (Good)
nitrogen dioxide (NO2)
SO2 0 (Good)
sulfur dioxide (SO2)
红卫路
index
2022-05-27
pm10
56
pm25
56
o3
0.03
no2
0
so2
0
红卫路
2018-10 2020-05

index
2020-05
2020-04
2020-03
2020-02
2020-01
2019-12
2019-11
2019-10
2019-09
2019-08
2019-07
2019-06
2019-05
2019-04
2019-03
2019-02
2019-01
2018-12
2018-11
2018-10
pm25
33
37
36
37
54
60
46
34
34
26
26
28
38
36
40
61
76
50
46
42
co
1
788
1
928
979
1
917
830
871
842
740
840
969
1
859
915
1
857
942
819
no2
18
28
19
16
29
47
38
28
22
11
15
18
25
23
29
21
35
27
31
32
o3
134
129
102
85
58
65
96
119
161
160
148
174
151
123
105
60
63
55
88
120
pm10
65
73
66
57
76
94
90
69
64
47
49
53
84
68
79
88
115
85
78
78
so2
18
17
10
6.9
6.8
13
14
11
12
8.6
11
14
11
9.4
6.8
4.4
5.5
6.5
8.6
8.5
* Pollution data source:
https://openaq.org
(ChinaAQIData)
The data is licensed under CC-By 4.0
PM10 179 (Very bad Hazardous)
PM2,5 35 (Unhealthy for Sensitive Groups)
O3 0 (Good)
NO2 0 (Good)
SO2 0 (Good)
Data on air pollution from recent days in Wanjiazui
| index | 2022-05-27 |
|---|---|
| pm10 | 56 Unhealthy for Sensitive Groups |
| pm25 | 56 Unhealthy |
| o3 | 0 Good |
| no2 | 0 Good |
| so2 | 0 Good |

| index | 2020-05 | 2020-04 | 2020-03 | 2020-02 | 2020-01 | 2019-12 | 2019-11 | 2019-10 | 2019-09 | 2019-08 | 2019-07 | 2019-06 | 2019-05 | 2019-04 | 2019-03 | 2019-02 | 2019-01 | 2018-12 | 2018-11 | 2018-10 |
|---|---|---|---|---|---|---|---|---|---|---|---|---|---|---|---|---|---|---|---|---|
| pm25 | 33 (Moderate) | 37 (Unhealthy for Sensitive Groups) | 36 (Unhealthy for Sensitive Groups) | 37 (Unhealthy for Sensitive Groups) | 54 (Unhealthy for Sensitive Groups) | 60 (Unhealthy) | 46 (Unhealthy for Sensitive Groups) | 34 (Moderate) | 34 (Moderate) | 26 (Moderate) | 26 (Moderate) | 28 (Moderate) | 38 (Unhealthy for Sensitive Groups) | 36 (Unhealthy for Sensitive Groups) | 40 (Unhealthy for Sensitive Groups) | 61 (Unhealthy) | 76 (Very Unhealthy) | 50 (Unhealthy for Sensitive Groups) | 46 (Unhealthy for Sensitive Groups) | 42 (Unhealthy for Sensitive Groups) |
| co | 1 (Good) | 788 (Good) | 1 (Good) | 928 (Good) | 979 (Good) | 1 (Good) | 917 (Good) | 830 (Good) | 871 (Good) | 842 (Good) | 740 (Good) | 840 (Good) | 969 (Good) | 1 (Good) | 859 (Good) | 915 (Good) | 1 (Good) | 857 (Good) | 942 (Good) | 819 (Good) |
| no2 | 18 (Good) | 28 (Good) | 19 (Good) | 16 (Good) | 29 (Good) | 47 (Moderate) | 38 (Good) | 28 (Good) | 22 (Good) | 11 (Good) | 15 (Good) | 18 (Good) | 25 (Good) | 23 (Good) | 29 (Good) | 21 (Good) | 35 (Good) | 27 (Good) | 31 (Good) | 32 (Good) |
| o3 | 134 (Unhealthy for Sensitive Groups) | 129 (Unhealthy for Sensitive Groups) | 102 (Moderate) | 85 (Moderate) | 58 (Good) | 65 (Good) | 96 (Moderate) | 119 (Moderate) | 161 (Unhealthy) | 160 (Unhealthy) | 148 (Unhealthy for Sensitive Groups) | 174 (Unhealthy) | 151 (Unhealthy) | 123 (Unhealthy for Sensitive Groups) | 105 (Moderate) | 60 (Good) | 63 (Good) | 55 (Good) | 88 (Moderate) | 120 (Unhealthy for Sensitive Groups) |
| pm10 | 65 (Unhealthy for Sensitive Groups) | 73 (Unhealthy for Sensitive Groups) | 66 (Unhealthy for Sensitive Groups) | 57 (Unhealthy for Sensitive Groups) | 76 (Unhealthy for Sensitive Groups) | 94 (Unhealthy) | 90 (Unhealthy) | 69 (Unhealthy for Sensitive Groups) | 64 (Unhealthy for Sensitive Groups) | 47 (Moderate) | 49 (Moderate) | 53 (Unhealthy for Sensitive Groups) | 84 (Unhealthy) | 68 (Unhealthy for Sensitive Groups) | 79 (Unhealthy for Sensitive Groups) | 88 (Unhealthy) | 115 (Very Unhealthy) | 85 (Unhealthy) | 78 (Unhealthy for Sensitive Groups) | 78 (Unhealthy for Sensitive Groups) |
| so2 | 18 (Good) | 17 (Good) | 10 (Good) | 6.9 (Good) | 6.8 (Good) | 13 (Good) | 14 (Good) | 11 (Good) | 12 (Good) | 8.6 (Good) | 11 (Good) | 14 (Good) | 11 (Good) | 9.4 (Good) | 6.8 (Good) | 4.4 (Good) | 5.5 (Good) | 6.5 (Good) | 8.6 (Good) | 8.5 (Good) |
PM10 179 (Very bad Hazardous)
particulate matter (PM10) suspended dustPM2,5 35 (Unhealthy for Sensitive Groups)
particulate matter (PM2.5) dustO3 0.04 (Good)
ozone (O3)NO2 0 (Good)
nitrogen dioxide (NO2)SO2 0 (Good)
sulfur dioxide (SO2)红卫路
| index | 2022-05-27 |
|---|---|
| pm10 | 56 |
| pm25 | 56 |
| o3 | 0.03 |
| no2 | 0 |
| so2 | 0 |
红卫路
| index | 2020-05 | 2020-04 | 2020-03 | 2020-02 | 2020-01 | 2019-12 | 2019-11 | 2019-10 | 2019-09 | 2019-08 | 2019-07 | 2019-06 | 2019-05 | 2019-04 | 2019-03 | 2019-02 | 2019-01 | 2018-12 | 2018-11 | 2018-10 |
|---|---|---|---|---|---|---|---|---|---|---|---|---|---|---|---|---|---|---|---|---|
| pm25 | 33 | 37 | 36 | 37 | 54 | 60 | 46 | 34 | 34 | 26 | 26 | 28 | 38 | 36 | 40 | 61 | 76 | 50 | 46 | 42 |
| co | 1 | 788 | 1 | 928 | 979 | 1 | 917 | 830 | 871 | 842 | 740 | 840 | 969 | 1 | 859 | 915 | 1 | 857 | 942 | 819 |
| no2 | 18 | 28 | 19 | 16 | 29 | 47 | 38 | 28 | 22 | 11 | 15 | 18 | 25 | 23 | 29 | 21 | 35 | 27 | 31 | 32 |
| o3 | 134 | 129 | 102 | 85 | 58 | 65 | 96 | 119 | 161 | 160 | 148 | 174 | 151 | 123 | 105 | 60 | 63 | 55 | 88 | 120 |
| pm10 | 65 | 73 | 66 | 57 | 76 | 94 | 90 | 69 | 64 | 47 | 49 | 53 | 84 | 68 | 79 | 88 | 115 | 85 | 78 | 78 |
| so2 | 18 | 17 | 10 | 6.9 | 6.8 | 13 | 14 | 11 | 12 | 8.6 | 11 | 14 | 11 | 9.4 | 6.8 | 4.4 | 5.5 | 6.5 | 8.6 | 8.5 |