Air Pollution in Shashanling: Real-time Air Quality Index and smog alert.
Pollution and air quality forecast for Shashanling. Today is Tuesday, June 16, 2026. The following air pollution values have been recorded for Shashanling:- particulate matter (PM10) suspended dust - 179 (Very bad Hazardous)
- particulate matter (PM2.5) dust - 35 (Unhealthy for Sensitive Groups)
- ozone (O3) - 0 (Good)
- nitrogen dioxide (NO2) - 0 (Good)
- sulfur dioxide (SO2) - 0 (Good)

What is the air quality in Shashanling today? Is the air polluted in Shashanling?. Is there smog?
What is the level of PM10 today in Shashanling? (particulate matter (PM10) suspended dust)
The current level of particulate matter PM10 in Shashanling is:
179 (Very bad Hazardous)
The highest PM10 values usually occur in month: 81 (January 2019).
The lowest value of particulate matter PM10 pollution in Shashanling is usually recorded in: March (27).
What is the current level of PM2.5 in Shashanling? (particulate matter (PM2.5) dust)
Today's PM2.5 level is:
35 (Unhealthy for Sensitive Groups)
For comparison, the highest level of PM2.5 in Shashanling in the last 7 days was: 56 (Friday, May 27, 2022) and the lowest: 56 (Friday, May 27, 2022).
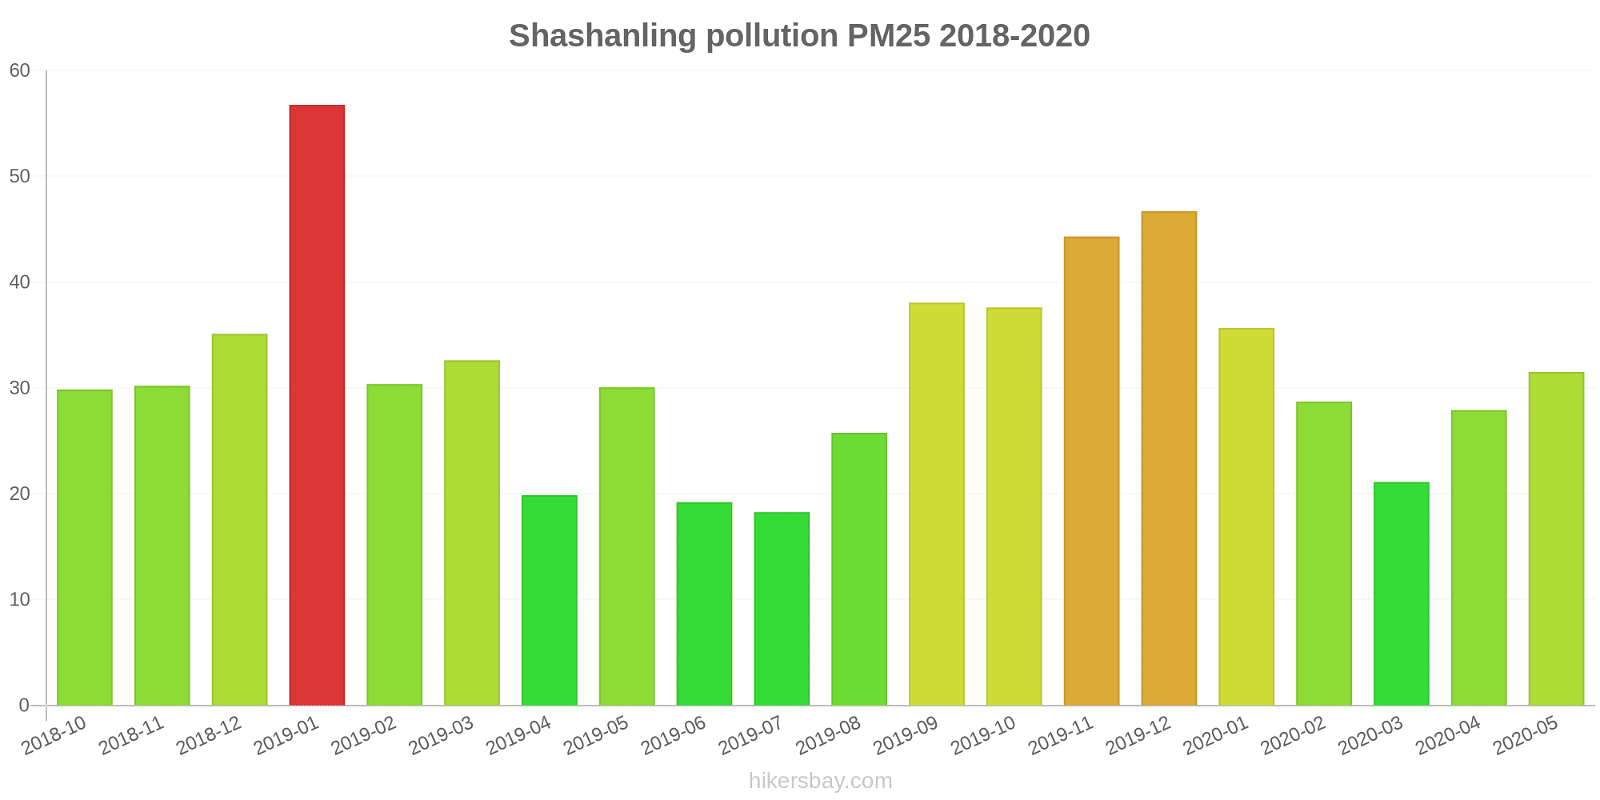
The highest PM2.5 values were recorded: 57 (January 2019).
The lowest level of particulate matter PM2.5 pollution occurs in month: July (18).
How is the O3 level today in Shashanling? (ozone (O3))
0 (Good)
How high is the level of NO2? (nitrogen dioxide (NO2))
0 (Good)
What is the level of SO2 pollution? (sulfur dioxide (SO2))
0 (Good)
Current data Friday, May 27, 2022, 12:00 PM
PM10 179 (Very bad Hazardous)
PM2,5 35 (Unhealthy for Sensitive Groups)
O3 0 (Good)
NO2 0 (Good)
SO2 0 (Good)
Data on air pollution from recent days in Shashanling
index
2022-05-27
pm10
56
Unhealthy for Sensitive Groups
pm25
56
Unhealthy
o3
0
Good
no2
0
Good
so2
0
Good
data source »
Air pollution in Shashanling from October 2018 to May 2020
index
2020-05
2020-04
2020-03
2020-02
2020-01
2019-12
2019-11
2019-10
2019-09
2019-08
2019-07
2019-06
2019-05
2019-04
2019-03
2019-02
2019-01
2018-12
2018-11
2018-10
pm25
32 (Moderate)
28 (Moderate)
21 (Moderate)
29 (Moderate)
36 (Unhealthy for Sensitive Groups)
47 (Unhealthy for Sensitive Groups)
44 (Unhealthy for Sensitive Groups)
38 (Unhealthy for Sensitive Groups)
38 (Unhealthy for Sensitive Groups)
26 (Moderate)
18 (Moderate)
19 (Moderate)
30 (Moderate)
20 (Moderate)
33 (Moderate)
30 (Moderate)
57 (Unhealthy)
35 (Unhealthy for Sensitive Groups)
30 (Moderate)
30 (Moderate)
co
709 (Good)
676 (Good)
734 (Good)
720 (Good)
876 (Good)
440 (Good)
818 (Good)
828 (Good)
797 (Good)
697 (Good)
657 (Good)
730 (Good)
371 (Good)
353 (Good)
394 (Good)
479 (Good)
1 (Good)
1 (Good)
1 (Good)
1 (Good)
no2
13 (Good)
19 (Good)
14 (Good)
11 (Good)
20 (Good)
34 (Good)
34 (Good)
26 (Good)
26 (Good)
17 (Good)
14 (Good)
13 (Good)
18 (Good)
20 (Good)
22 (Good)
17 (Good)
35 (Good)
30 (Good)
28 (Good)
28 (Good)
o3
119 (Moderate)
113 (Moderate)
69 (Good)
72 (Moderate)
58 (Good)
76 (Moderate)
113 (Moderate)
105 (Moderate)
159 (Unhealthy)
134 (Unhealthy for Sensitive Groups)
100 (Moderate)
99 (Moderate)
103 (Moderate)
90 (Moderate)
79 (Moderate)
50 (Good)
54 (Good)
39 (Good)
74 (Moderate)
80 (Moderate)
pm10
46 (Moderate)
41 (Moderate)
27 (Moderate)
34 (Moderate)
42 (Moderate)
62 (Unhealthy for Sensitive Groups)
69 (Unhealthy for Sensitive Groups)
52 (Unhealthy for Sensitive Groups)
56 (Unhealthy for Sensitive Groups)
43 (Moderate)
33 (Moderate)
36 (Moderate)
55 (Unhealthy for Sensitive Groups)
42 (Moderate)
53 (Unhealthy for Sensitive Groups)
45 (Moderate)
81 (Unhealthy)
57 (Unhealthy for Sensitive Groups)
55 (Unhealthy for Sensitive Groups)
56 (Unhealthy for Sensitive Groups)
so2
13 (Good)
13 (Good)
9.3 (Good)
7.3 (Good)
8.6 (Good)
12 (Good)
11 (Good)
9.2 (Good)
9.4 (Good)
10 (Good)
11 (Good)
9.9 (Good)
13 (Good)
11 (Good)
8.7 (Good)
7 (Good)
12 (Good)
8.7 (Good)
9.6 (Good)
8.1 (Good)
data source »
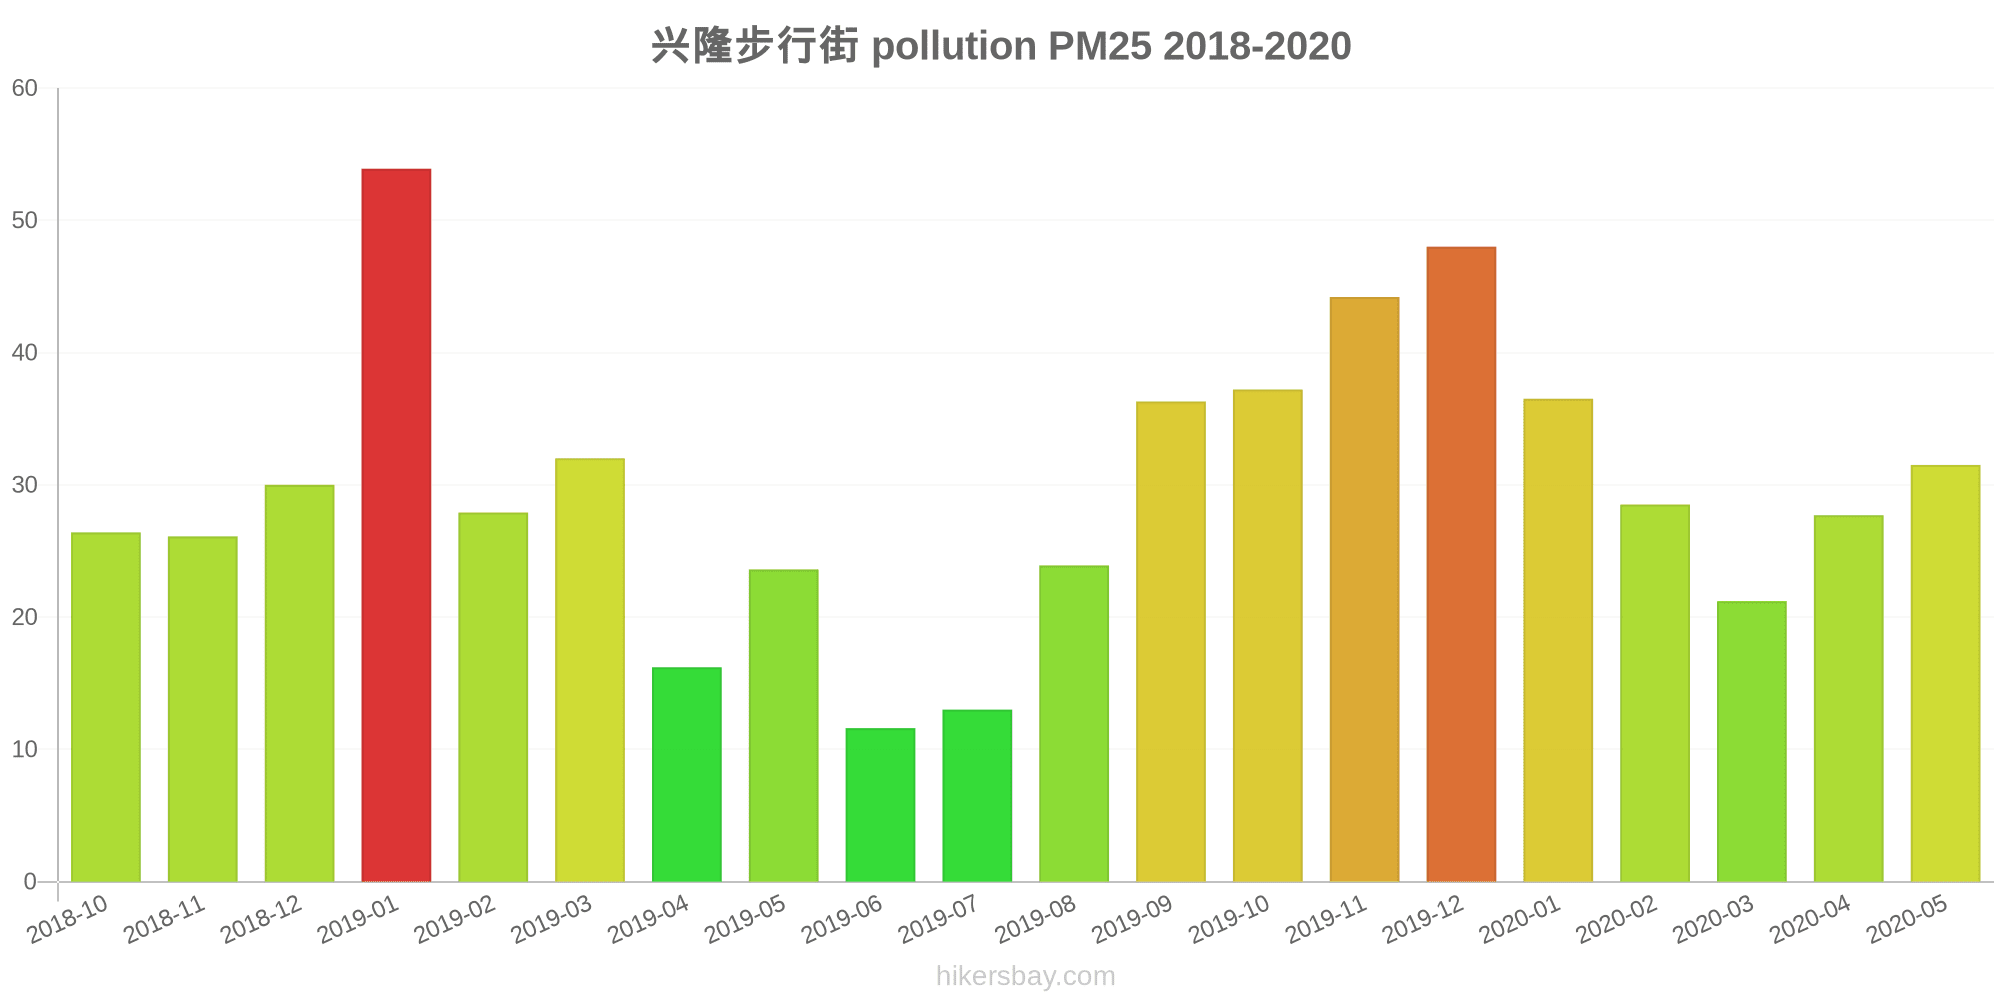
兴隆步行街
Friday, May 27, 2022, 12:00 PM
PM10 179 (Very bad Hazardous)
particulate matter (PM10) suspended dust
PM2,5 35 (Unhealthy for Sensitive Groups)
particulate matter (PM2.5) dust
O3 0.04 (Good)
ozone (O3)
NO2 0 (Good)
nitrogen dioxide (NO2)
SO2 0 (Good)
sulfur dioxide (SO2)
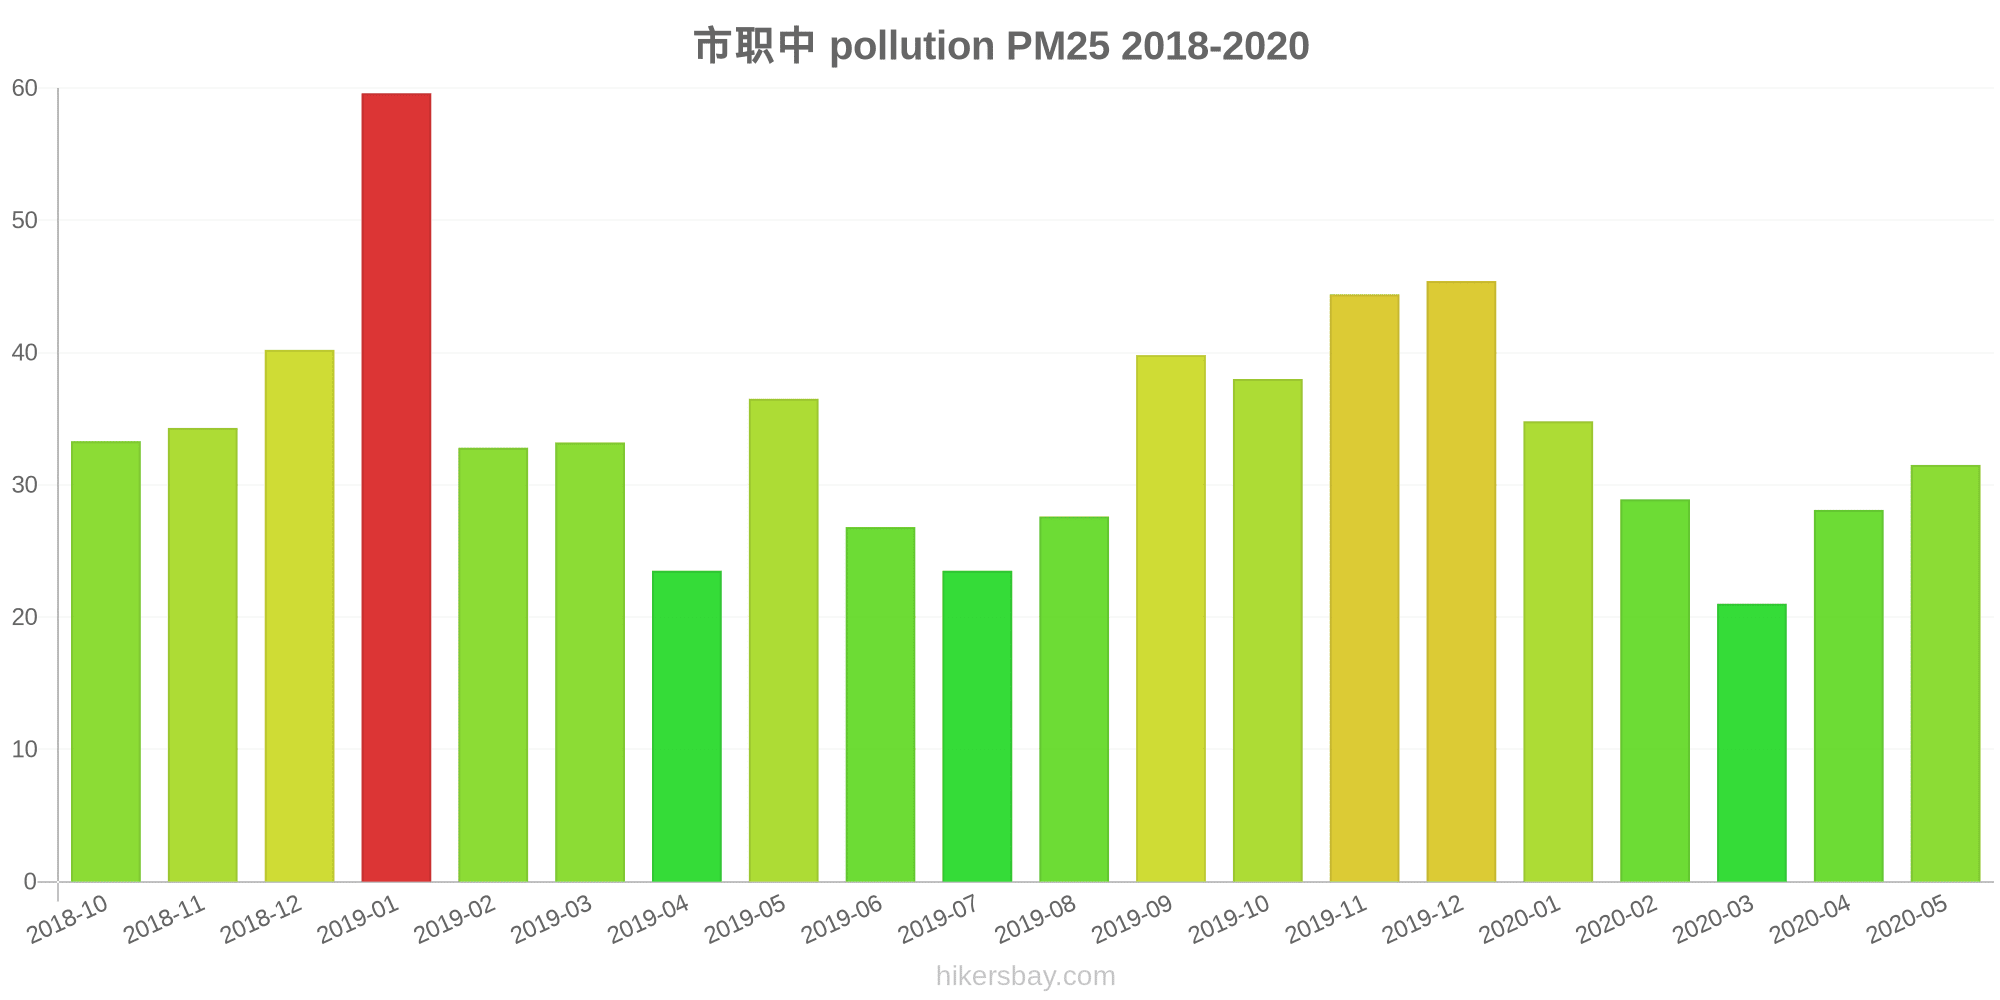
市职中
Friday, May 27, 2022, 12:00 PM
PM10 179 (Very bad Hazardous)
particulate matter (PM10) suspended dust
PM2,5 35 (Unhealthy for Sensitive Groups)
particulate matter (PM2.5) dust
O3 0.04 (Good)
ozone (O3)
NO2 0 (Good)
nitrogen dioxide (NO2)
SO2 0 (Good)
sulfur dioxide (SO2)
兴隆步行街
index
2022-05-27
pm10
56
pm25
56
o3
0.03
no2
0
so2
0
市职中
index
2022-05-27
pm10
56
pm25
56
o3
0.03
no2
0
so2
0
兴隆步行街
2018-10 2020-05

index
2020-05
2020-04
2020-03
2020-02
2020-01
2019-12
2019-11
2019-10
2019-09
2019-08
2019-07
2019-06
2019-05
2019-04
2019-03
2019-02
2019-01
2018-12
2018-11
2018-10
pm25
32
28
21
29
37
48
44
37
36
24
13
12
24
16
32
28
54
30
26
26
co
868
766
838
824
877
1
937
933
882
872
845
987
1
1
1
1
1
1
1
1
no2
13
20
14
10
17
32
34
25
27
17
14
14
17
20
22
16
31
28
28
28
o3
120
114
71
76
60
77
115
106
158
133
95
105
101
91
78
47
50
37
70
73
pm10
47
41
28
35
43
64
72
54
59
44
32
30
50
40
52
36
82
60
58
60
so2
15
13
11
8.3
8.9
11
11
9.2
9
12
12
9.8
13
13
9.7
6.6
12
9.1
11
8.4
市职中
2018-10 2020-05

index
2020-05
2020-04
2020-03
2020-02
2020-01
2019-12
2019-11
2019-10
2019-09
2019-08
2019-07
2019-06
2019-05
2019-04
2019-03
2019-02
2019-01
2018-12
2018-11
2018-10
pm25
32
28
21
29
35
45
44
38
40
28
24
27
37
24
33
33
60
40
34
33
co
550
585
629
616
875
879
698
722
711
521
468
472
741
704
787
956
1
1
1
1
no2
13
18
15
11
22
37
34
27
24
16
15
11
19
20
22
19
39
31
29
29
o3
118
111
67
69
56
75
111
103
159
135
106
93
104
90
80
53
57
42
78
86
pm10
46
41
26
33
41
59
66
50
53
43
34
42
61
44
55
54
79
54
53
53
so2
12
12
8.1
6.3
8.2
12
11
9.2
9.8
9.3
11
10
13
9.7
7.7
7.5
12
8.3
8.4
7.7
* Pollution data source:
https://openaq.org
(ChinaAQIData)
The data is licensed under CC-By 4.0
PM10 179 (Very bad Hazardous)
PM2,5 35 (Unhealthy for Sensitive Groups)
O3 0 (Good)
NO2 0 (Good)
SO2 0 (Good)
Data on air pollution from recent days in Shashanling
| index | 2022-05-27 |
|---|---|
| pm10 | 56 Unhealthy for Sensitive Groups |
| pm25 | 56 Unhealthy |
| o3 | 0 Good |
| no2 | 0 Good |
| so2 | 0 Good |

| index | 2020-05 | 2020-04 | 2020-03 | 2020-02 | 2020-01 | 2019-12 | 2019-11 | 2019-10 | 2019-09 | 2019-08 | 2019-07 | 2019-06 | 2019-05 | 2019-04 | 2019-03 | 2019-02 | 2019-01 | 2018-12 | 2018-11 | 2018-10 |
|---|---|---|---|---|---|---|---|---|---|---|---|---|---|---|---|---|---|---|---|---|
| pm25 | 32 (Moderate) | 28 (Moderate) | 21 (Moderate) | 29 (Moderate) | 36 (Unhealthy for Sensitive Groups) | 47 (Unhealthy for Sensitive Groups) | 44 (Unhealthy for Sensitive Groups) | 38 (Unhealthy for Sensitive Groups) | 38 (Unhealthy for Sensitive Groups) | 26 (Moderate) | 18 (Moderate) | 19 (Moderate) | 30 (Moderate) | 20 (Moderate) | 33 (Moderate) | 30 (Moderate) | 57 (Unhealthy) | 35 (Unhealthy for Sensitive Groups) | 30 (Moderate) | 30 (Moderate) |
| co | 709 (Good) | 676 (Good) | 734 (Good) | 720 (Good) | 876 (Good) | 440 (Good) | 818 (Good) | 828 (Good) | 797 (Good) | 697 (Good) | 657 (Good) | 730 (Good) | 371 (Good) | 353 (Good) | 394 (Good) | 479 (Good) | 1 (Good) | 1 (Good) | 1 (Good) | 1 (Good) |
| no2 | 13 (Good) | 19 (Good) | 14 (Good) | 11 (Good) | 20 (Good) | 34 (Good) | 34 (Good) | 26 (Good) | 26 (Good) | 17 (Good) | 14 (Good) | 13 (Good) | 18 (Good) | 20 (Good) | 22 (Good) | 17 (Good) | 35 (Good) | 30 (Good) | 28 (Good) | 28 (Good) |
| o3 | 119 (Moderate) | 113 (Moderate) | 69 (Good) | 72 (Moderate) | 58 (Good) | 76 (Moderate) | 113 (Moderate) | 105 (Moderate) | 159 (Unhealthy) | 134 (Unhealthy for Sensitive Groups) | 100 (Moderate) | 99 (Moderate) | 103 (Moderate) | 90 (Moderate) | 79 (Moderate) | 50 (Good) | 54 (Good) | 39 (Good) | 74 (Moderate) | 80 (Moderate) |
| pm10 | 46 (Moderate) | 41 (Moderate) | 27 (Moderate) | 34 (Moderate) | 42 (Moderate) | 62 (Unhealthy for Sensitive Groups) | 69 (Unhealthy for Sensitive Groups) | 52 (Unhealthy for Sensitive Groups) | 56 (Unhealthy for Sensitive Groups) | 43 (Moderate) | 33 (Moderate) | 36 (Moderate) | 55 (Unhealthy for Sensitive Groups) | 42 (Moderate) | 53 (Unhealthy for Sensitive Groups) | 45 (Moderate) | 81 (Unhealthy) | 57 (Unhealthy for Sensitive Groups) | 55 (Unhealthy for Sensitive Groups) | 56 (Unhealthy for Sensitive Groups) |
| so2 | 13 (Good) | 13 (Good) | 9.3 (Good) | 7.3 (Good) | 8.6 (Good) | 12 (Good) | 11 (Good) | 9.2 (Good) | 9.4 (Good) | 10 (Good) | 11 (Good) | 9.9 (Good) | 13 (Good) | 11 (Good) | 8.7 (Good) | 7 (Good) | 12 (Good) | 8.7 (Good) | 9.6 (Good) | 8.1 (Good) |
PM10 179 (Very bad Hazardous)
particulate matter (PM10) suspended dustPM2,5 35 (Unhealthy for Sensitive Groups)
particulate matter (PM2.5) dustO3 0.04 (Good)
ozone (O3)NO2 0 (Good)
nitrogen dioxide (NO2)SO2 0 (Good)
sulfur dioxide (SO2)PM10 179 (Very bad Hazardous)
particulate matter (PM10) suspended dustPM2,5 35 (Unhealthy for Sensitive Groups)
particulate matter (PM2.5) dustO3 0.04 (Good)
ozone (O3)NO2 0 (Good)
nitrogen dioxide (NO2)SO2 0 (Good)
sulfur dioxide (SO2)兴隆步行街
| index | 2022-05-27 |
|---|---|
| pm10 | 56 |
| pm25 | 56 |
| o3 | 0.03 |
| no2 | 0 |
| so2 | 0 |
市职中
| index | 2022-05-27 |
|---|---|
| pm10 | 56 |
| pm25 | 56 |
| o3 | 0.03 |
| no2 | 0 |
| so2 | 0 |
兴隆步行街
| index | 2020-05 | 2020-04 | 2020-03 | 2020-02 | 2020-01 | 2019-12 | 2019-11 | 2019-10 | 2019-09 | 2019-08 | 2019-07 | 2019-06 | 2019-05 | 2019-04 | 2019-03 | 2019-02 | 2019-01 | 2018-12 | 2018-11 | 2018-10 |
|---|---|---|---|---|---|---|---|---|---|---|---|---|---|---|---|---|---|---|---|---|
| pm25 | 32 | 28 | 21 | 29 | 37 | 48 | 44 | 37 | 36 | 24 | 13 | 12 | 24 | 16 | 32 | 28 | 54 | 30 | 26 | 26 |
| co | 868 | 766 | 838 | 824 | 877 | 1 | 937 | 933 | 882 | 872 | 845 | 987 | 1 | 1 | 1 | 1 | 1 | 1 | 1 | 1 |
| no2 | 13 | 20 | 14 | 10 | 17 | 32 | 34 | 25 | 27 | 17 | 14 | 14 | 17 | 20 | 22 | 16 | 31 | 28 | 28 | 28 |
| o3 | 120 | 114 | 71 | 76 | 60 | 77 | 115 | 106 | 158 | 133 | 95 | 105 | 101 | 91 | 78 | 47 | 50 | 37 | 70 | 73 |
| pm10 | 47 | 41 | 28 | 35 | 43 | 64 | 72 | 54 | 59 | 44 | 32 | 30 | 50 | 40 | 52 | 36 | 82 | 60 | 58 | 60 |
| so2 | 15 | 13 | 11 | 8.3 | 8.9 | 11 | 11 | 9.2 | 9 | 12 | 12 | 9.8 | 13 | 13 | 9.7 | 6.6 | 12 | 9.1 | 11 | 8.4 |
市职中
| index | 2020-05 | 2020-04 | 2020-03 | 2020-02 | 2020-01 | 2019-12 | 2019-11 | 2019-10 | 2019-09 | 2019-08 | 2019-07 | 2019-06 | 2019-05 | 2019-04 | 2019-03 | 2019-02 | 2019-01 | 2018-12 | 2018-11 | 2018-10 |
|---|---|---|---|---|---|---|---|---|---|---|---|---|---|---|---|---|---|---|---|---|
| pm25 | 32 | 28 | 21 | 29 | 35 | 45 | 44 | 38 | 40 | 28 | 24 | 27 | 37 | 24 | 33 | 33 | 60 | 40 | 34 | 33 |
| co | 550 | 585 | 629 | 616 | 875 | 879 | 698 | 722 | 711 | 521 | 468 | 472 | 741 | 704 | 787 | 956 | 1 | 1 | 1 | 1 |
| no2 | 13 | 18 | 15 | 11 | 22 | 37 | 34 | 27 | 24 | 16 | 15 | 11 | 19 | 20 | 22 | 19 | 39 | 31 | 29 | 29 |
| o3 | 118 | 111 | 67 | 69 | 56 | 75 | 111 | 103 | 159 | 135 | 106 | 93 | 104 | 90 | 80 | 53 | 57 | 42 | 78 | 86 |
| pm10 | 46 | 41 | 26 | 33 | 41 | 59 | 66 | 50 | 53 | 43 | 34 | 42 | 61 | 44 | 55 | 54 | 79 | 54 | 53 | 53 |
| so2 | 12 | 12 | 8.1 | 6.3 | 8.2 | 12 | 11 | 9.2 | 9.8 | 9.3 | 11 | 10 | 13 | 9.7 | 7.7 | 7.5 | 12 | 8.3 | 8.4 | 7.7 |