Air Pollution in Shangxibianling: Real-time Air Quality Index and smog alert.
Pollution and air quality forecast for Shangxibianling. Today is Tuesday, June 16, 2026. The following air pollution values have been recorded for Shangxibianling:- particulate matter (PM10) suspended dust - 179 (Very bad Hazardous)
- particulate matter (PM2.5) dust - 35 (Unhealthy for Sensitive Groups)
- ozone (O3) - 0 (Good)
- nitrogen dioxide (NO2) - 0 (Good)
- sulfur dioxide (SO2) - 0 (Good)

What is the air quality in Shangxibianling today? Is the air polluted in Shangxibianling?. Is there smog?
What is the level of PM10 today in Shangxibianling? (particulate matter (PM10) suspended dust)
The current level of particulate matter PM10 in Shangxibianling is:
179 (Very bad Hazardous)
The highest PM10 values usually occur in month: 66 (November 2019).
The lowest value of particulate matter PM10 pollution in Shangxibianling is usually recorded in: July (25).
What is the current level of PM2.5 in Shangxibianling? (particulate matter (PM2.5) dust)
Today's PM2.5 level is:
35 (Unhealthy for Sensitive Groups)
For comparison, the highest level of PM2.5 in Shangxibianling in the last 7 days was: 56 (Friday, May 27, 2022) and the lowest: 56 (Friday, May 27, 2022).
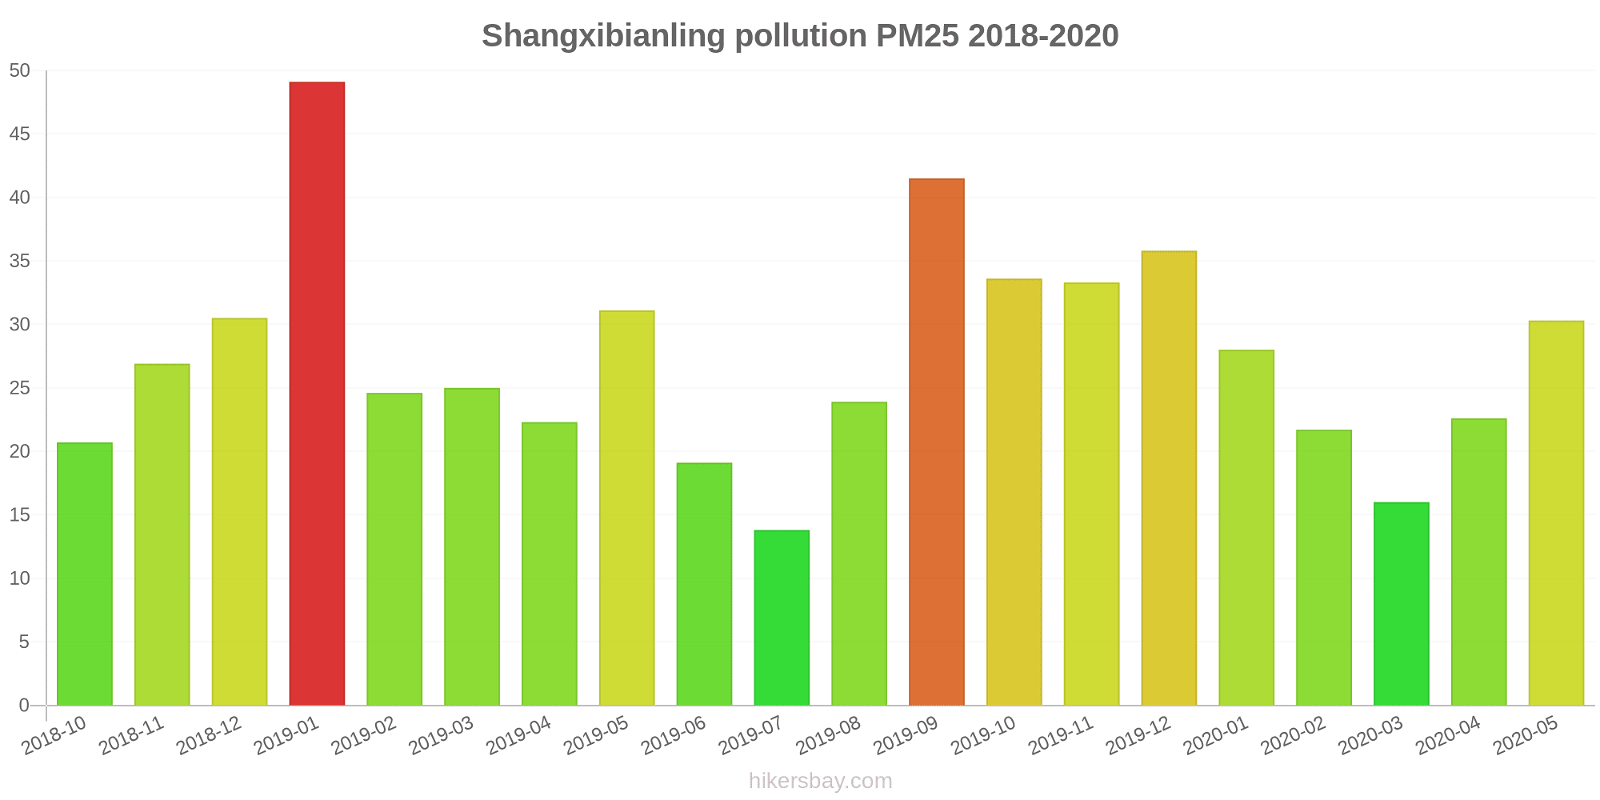
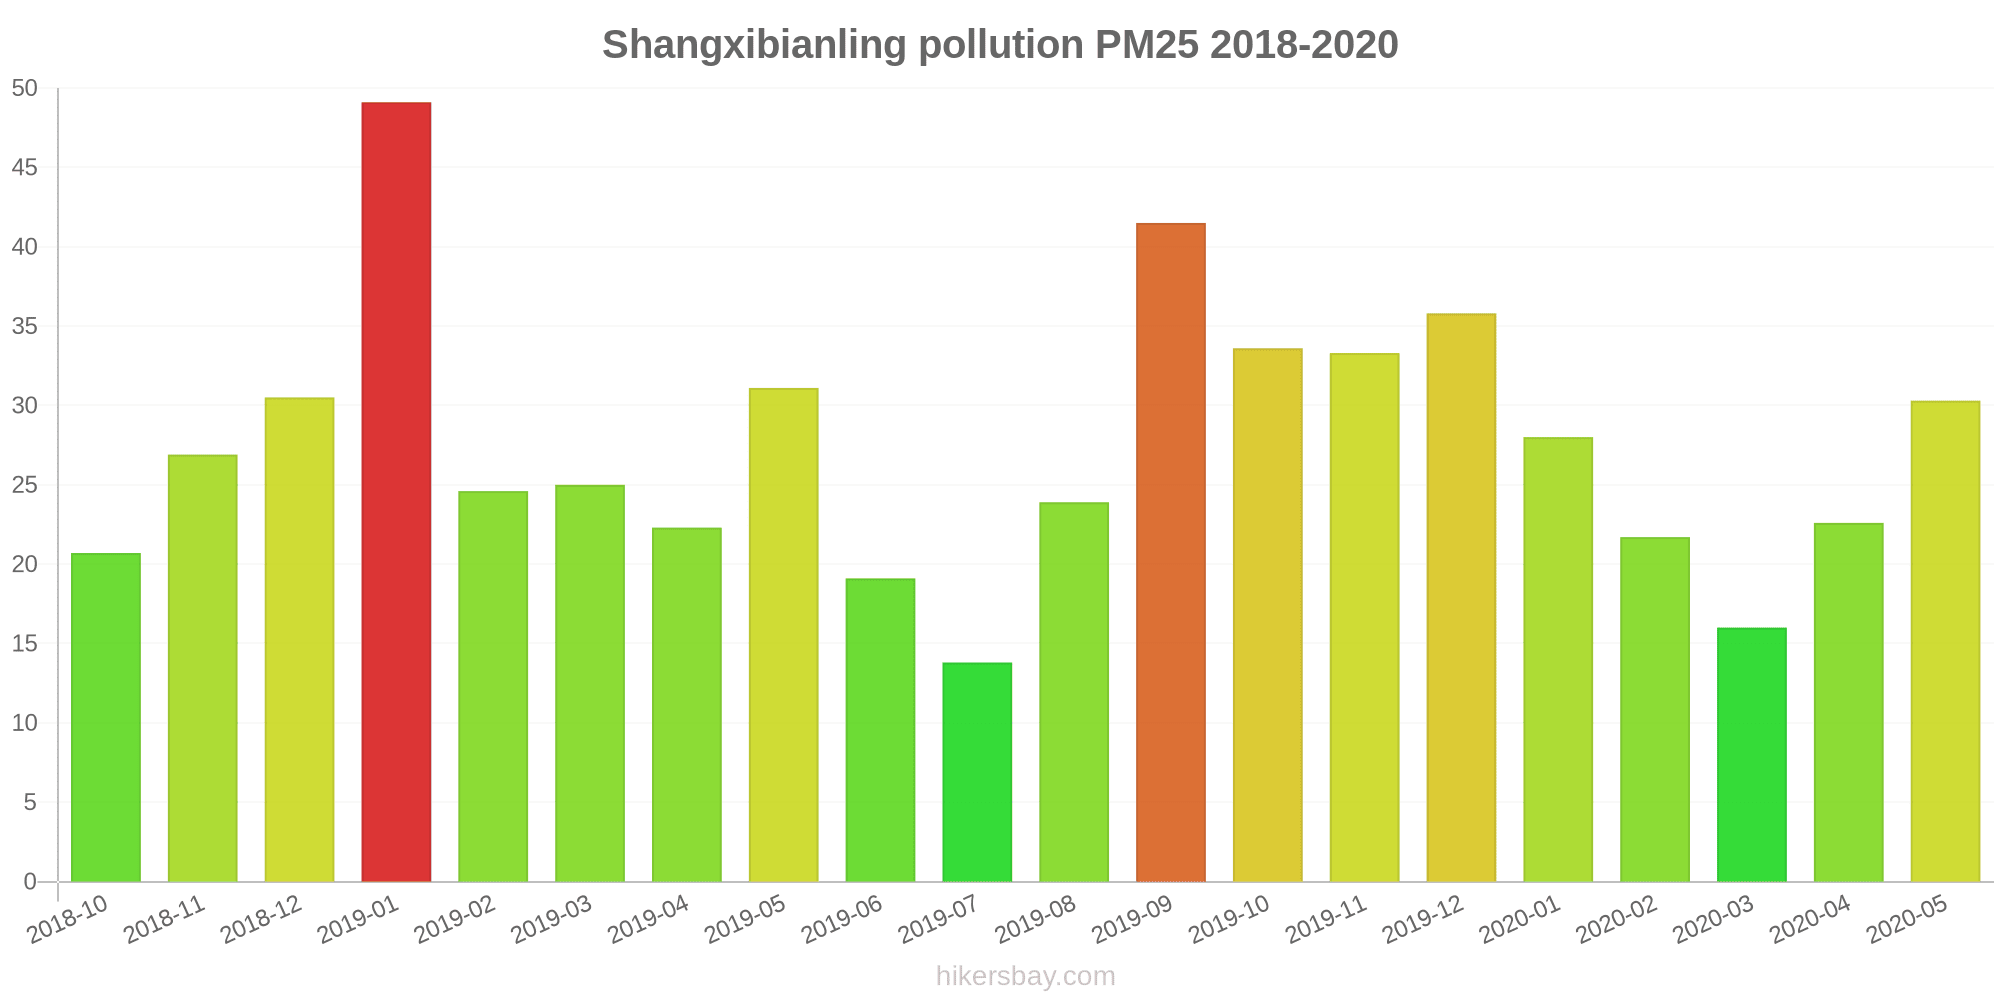
The highest PM2.5 values were recorded: 49 (January 2019).
The lowest level of particulate matter PM2.5 pollution occurs in month: July (14).
How is the O3 level today in Shangxibianling? (ozone (O3))
0 (Good)
How high is the level of NO2? (nitrogen dioxide (NO2))
0 (Good)
What is the level of SO2 pollution? (sulfur dioxide (SO2))
0 (Good)
Current data Friday, May 27, 2022, 12:00 PM
PM10 179 (Very bad Hazardous)
PM2,5 35 (Unhealthy for Sensitive Groups)
O3 0 (Good)
NO2 0 (Good)
SO2 0 (Good)
Data on air pollution from recent days in Shangxibianling
index
2022-05-27
pm10
56
Unhealthy for Sensitive Groups
pm25
56
Unhealthy
o3
0
Good
no2
0
Good
so2
0
Good
data source »
Air pollution in Shangxibianling from October 2018 to May 2020
index
2020-05
2020-04
2020-03
2020-02
2020-01
2019-12
2019-11
2019-10
2019-09
2019-08
2019-07
2019-06
2019-05
2019-04
2019-03
2019-02
2019-01
2018-12
2018-11
2018-10
pm25
30 (Moderate)
23 (Moderate)
16 (Moderate)
22 (Moderate)
28 (Moderate)
36 (Unhealthy for Sensitive Groups)
33 (Moderate)
34 (Moderate)
42 (Unhealthy for Sensitive Groups)
24 (Moderate)
14 (Moderate)
19 (Moderate)
31 (Moderate)
22 (Moderate)
25 (Moderate)
25 (Moderate)
49 (Unhealthy for Sensitive Groups)
31 (Moderate)
27 (Moderate)
21 (Moderate)
co
699 (Good)
590 (Good)
760 (Good)
592 (Good)
829 (Good)
847 (Good)
710 (Good)
750 (Good)
672 (Good)
694 (Good)
796 (Good)
1 (Good)
998 (Good)
906 (Good)
837 (Good)
988 (Good)
1 (Good)
1 (Good)
1 (Good)
1 (Good)
no2
17 (Good)
16 (Good)
16 (Good)
11 (Good)
19 (Good)
32 (Good)
27 (Good)
21 (Good)
27 (Good)
21 (Good)
19 (Good)
17 (Good)
22 (Good)
21 (Good)
22 (Good)
20 (Good)
35 (Good)
32 (Good)
29 (Good)
28 (Good)
o3
125 (Unhealthy for Sensitive Groups)
119 (Moderate)
68 (Good)
72 (Moderate)
58 (Good)
73 (Moderate)
103 (Moderate)
101 (Moderate)
153 (Unhealthy)
116 (Moderate)
93 (Moderate)
97 (Moderate)
99 (Moderate)
87 (Moderate)
83 (Moderate)
50 (Good)
56 (Good)
45 (Good)
74 (Moderate)
84 (Moderate)
pm10
49 (Moderate)
38 (Moderate)
28 (Moderate)
33 (Moderate)
43 (Moderate)
62 (Unhealthy for Sensitive Groups)
66 (Unhealthy for Sensitive Groups)
47 (Moderate)
51 (Unhealthy for Sensitive Groups)
33 (Moderate)
25 (Moderate)
28 (Moderate)
43 (Moderate)
30 (Moderate)
37 (Moderate)
35 (Moderate)
64 (Unhealthy for Sensitive Groups)
42 (Moderate)
38 (Moderate)
36 (Moderate)
so2
14 (Good)
11 (Good)
7.2 (Good)
7.9 (Good)
6.8 (Good)
13 (Good)
13 (Good)
8.2 (Good)
8.7 (Good)
8.6 (Good)
6.7 (Good)
7.8 (Good)
11 (Good)
12 (Good)
8.9 (Good)
6.4 (Good)
9.5 (Good)
7.7 (Good)
10 (Good)
9.6 (Good)
data source »
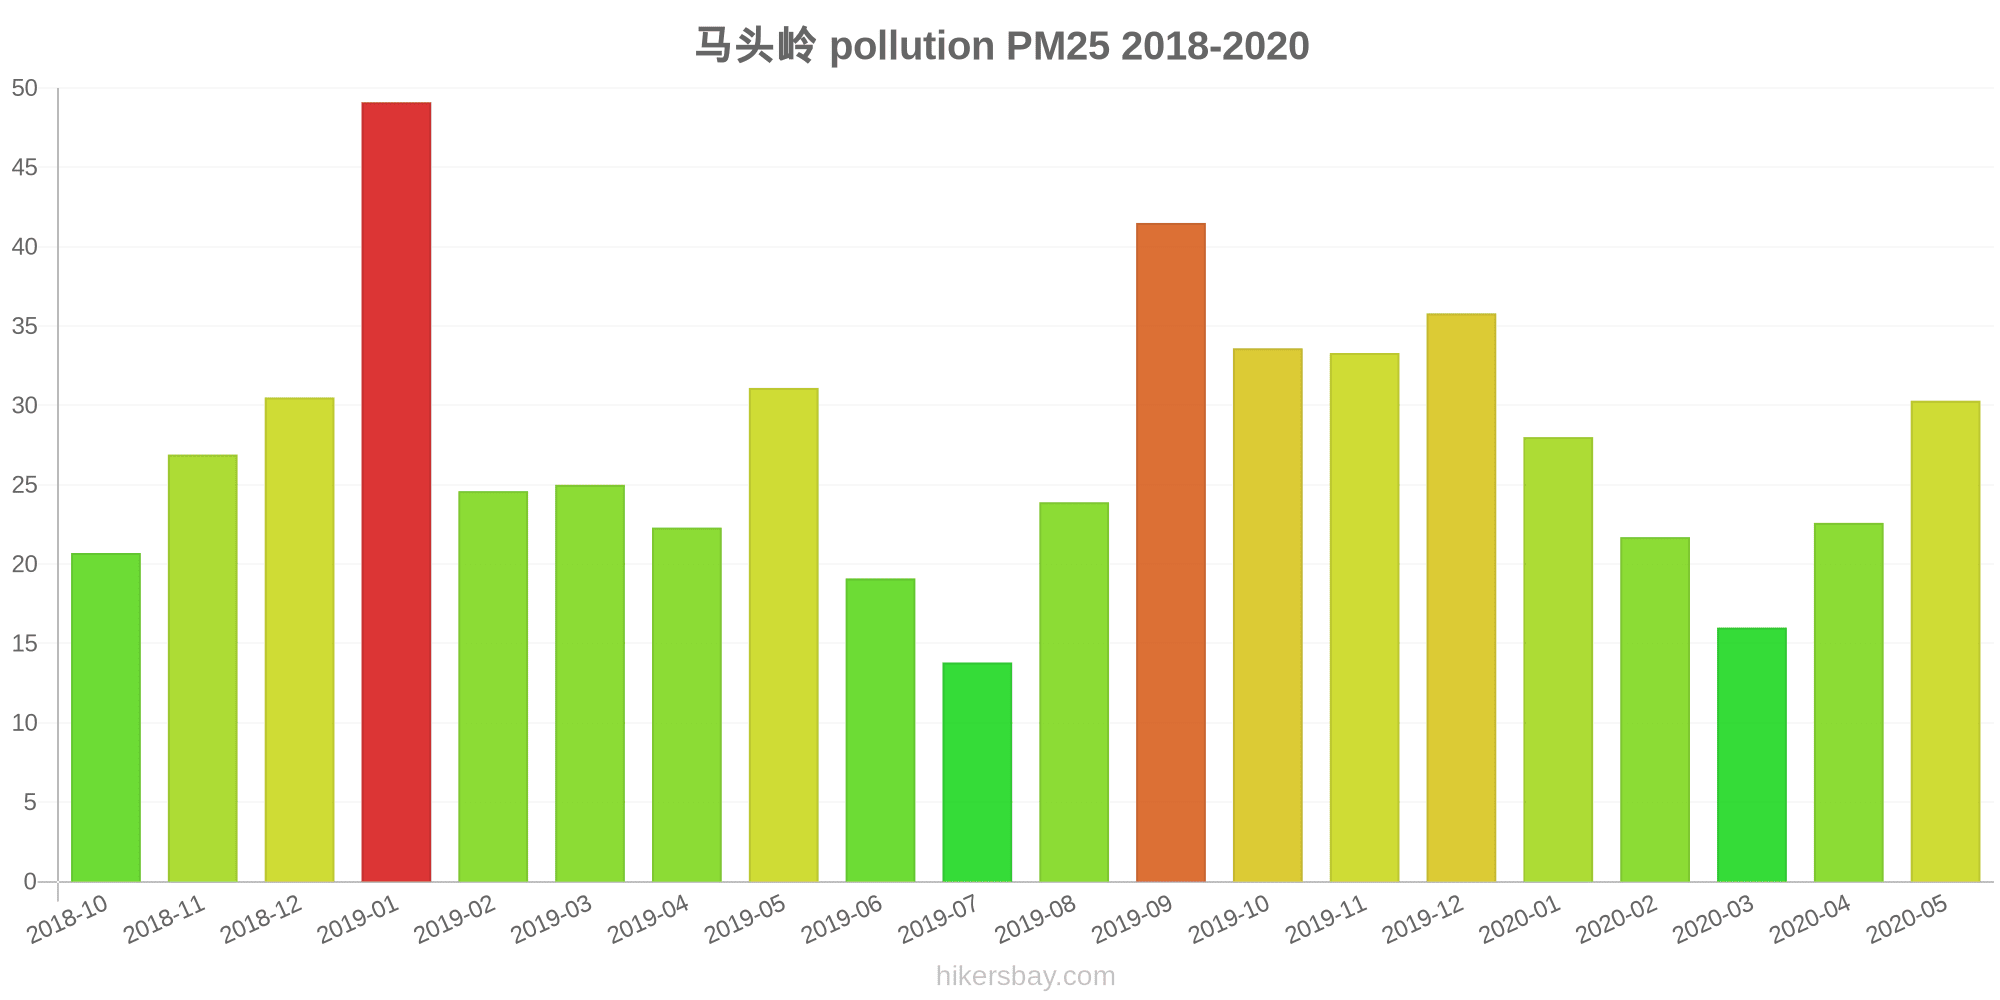
马头岭
Friday, May 27, 2022, 12:00 PM
PM10 179 (Very bad Hazardous)
particulate matter (PM10) suspended dust
PM2,5 35 (Unhealthy for Sensitive Groups)
particulate matter (PM2.5) dust
O3 0.04 (Good)
ozone (O3)
NO2 0 (Good)
nitrogen dioxide (NO2)
SO2 0 (Good)
sulfur dioxide (SO2)
马头岭
index
2022-05-27
pm10
56
pm25
56
o3
0.03
no2
0
so2
0
马头岭
2018-10 2020-05

index
2020-05
2020-04
2020-03
2020-02
2020-01
2019-12
2019-11
2019-10
2019-09
2019-08
2019-07
2019-06
2019-05
2019-04
2019-03
2019-02
2019-01
2018-12
2018-11
2018-10
pm25
30
23
16
22
28
36
33
34
42
24
14
19
31
22
25
25
49
31
27
21
co
699
590
760
592
829
847
710
750
672
694
796
1
998
906
837
988
1
1
1
1
no2
17
16
16
11
19
32
27
21
27
21
19
17
22
21
22
20
35
32
29
28
o3
125
119
68
72
58
73
103
101
153
116
93
97
99
87
83
50
56
45
74
84
pm10
49
38
28
33
43
62
66
47
51
33
25
28
43
30
37
35
64
42
38
36
so2
14
11
7.2
7.9
6.8
13
13
8.2
8.7
8.6
6.7
7.8
11
12
8.9
6.4
9.5
7.7
10
9.6
* Pollution data source:
https://openaq.org
(ChinaAQIData)
The data is licensed under CC-By 4.0
PM10 179 (Very bad Hazardous)
PM2,5 35 (Unhealthy for Sensitive Groups)
O3 0 (Good)
NO2 0 (Good)
SO2 0 (Good)
Data on air pollution from recent days in Shangxibianling
| index | 2022-05-27 |
|---|---|
| pm10 | 56 Unhealthy for Sensitive Groups |
| pm25 | 56 Unhealthy |
| o3 | 0 Good |
| no2 | 0 Good |
| so2 | 0 Good |
| index | 2020-05 | 2020-04 | 2020-03 | 2020-02 | 2020-01 | 2019-12 | 2019-11 | 2019-10 | 2019-09 | 2019-08 | 2019-07 | 2019-06 | 2019-05 | 2019-04 | 2019-03 | 2019-02 | 2019-01 | 2018-12 | 2018-11 | 2018-10 |
|---|---|---|---|---|---|---|---|---|---|---|---|---|---|---|---|---|---|---|---|---|
| pm25 | 30 (Moderate) | 23 (Moderate) | 16 (Moderate) | 22 (Moderate) | 28 (Moderate) | 36 (Unhealthy for Sensitive Groups) | 33 (Moderate) | 34 (Moderate) | 42 (Unhealthy for Sensitive Groups) | 24 (Moderate) | 14 (Moderate) | 19 (Moderate) | 31 (Moderate) | 22 (Moderate) | 25 (Moderate) | 25 (Moderate) | 49 (Unhealthy for Sensitive Groups) | 31 (Moderate) | 27 (Moderate) | 21 (Moderate) |
| co | 699 (Good) | 590 (Good) | 760 (Good) | 592 (Good) | 829 (Good) | 847 (Good) | 710 (Good) | 750 (Good) | 672 (Good) | 694 (Good) | 796 (Good) | 1 (Good) | 998 (Good) | 906 (Good) | 837 (Good) | 988 (Good) | 1 (Good) | 1 (Good) | 1 (Good) | 1 (Good) |
| no2 | 17 (Good) | 16 (Good) | 16 (Good) | 11 (Good) | 19 (Good) | 32 (Good) | 27 (Good) | 21 (Good) | 27 (Good) | 21 (Good) | 19 (Good) | 17 (Good) | 22 (Good) | 21 (Good) | 22 (Good) | 20 (Good) | 35 (Good) | 32 (Good) | 29 (Good) | 28 (Good) |
| o3 | 125 (Unhealthy for Sensitive Groups) | 119 (Moderate) | 68 (Good) | 72 (Moderate) | 58 (Good) | 73 (Moderate) | 103 (Moderate) | 101 (Moderate) | 153 (Unhealthy) | 116 (Moderate) | 93 (Moderate) | 97 (Moderate) | 99 (Moderate) | 87 (Moderate) | 83 (Moderate) | 50 (Good) | 56 (Good) | 45 (Good) | 74 (Moderate) | 84 (Moderate) |
| pm10 | 49 (Moderate) | 38 (Moderate) | 28 (Moderate) | 33 (Moderate) | 43 (Moderate) | 62 (Unhealthy for Sensitive Groups) | 66 (Unhealthy for Sensitive Groups) | 47 (Moderate) | 51 (Unhealthy for Sensitive Groups) | 33 (Moderate) | 25 (Moderate) | 28 (Moderate) | 43 (Moderate) | 30 (Moderate) | 37 (Moderate) | 35 (Moderate) | 64 (Unhealthy for Sensitive Groups) | 42 (Moderate) | 38 (Moderate) | 36 (Moderate) |
| so2 | 14 (Good) | 11 (Good) | 7.2 (Good) | 7.9 (Good) | 6.8 (Good) | 13 (Good) | 13 (Good) | 8.2 (Good) | 8.7 (Good) | 8.6 (Good) | 6.7 (Good) | 7.8 (Good) | 11 (Good) | 12 (Good) | 8.9 (Good) | 6.4 (Good) | 9.5 (Good) | 7.7 (Good) | 10 (Good) | 9.6 (Good) |
PM10 179 (Very bad Hazardous)
particulate matter (PM10) suspended dustPM2,5 35 (Unhealthy for Sensitive Groups)
particulate matter (PM2.5) dustO3 0.04 (Good)
ozone (O3)NO2 0 (Good)
nitrogen dioxide (NO2)SO2 0 (Good)
sulfur dioxide (SO2)马头岭
| index | 2022-05-27 |
|---|---|
| pm10 | 56 |
| pm25 | 56 |
| o3 | 0.03 |
| no2 | 0 |
| so2 | 0 |
马头岭
| index | 2020-05 | 2020-04 | 2020-03 | 2020-02 | 2020-01 | 2019-12 | 2019-11 | 2019-10 | 2019-09 | 2019-08 | 2019-07 | 2019-06 | 2019-05 | 2019-04 | 2019-03 | 2019-02 | 2019-01 | 2018-12 | 2018-11 | 2018-10 |
|---|---|---|---|---|---|---|---|---|---|---|---|---|---|---|---|---|---|---|---|---|
| pm25 | 30 | 23 | 16 | 22 | 28 | 36 | 33 | 34 | 42 | 24 | 14 | 19 | 31 | 22 | 25 | 25 | 49 | 31 | 27 | 21 |
| co | 699 | 590 | 760 | 592 | 829 | 847 | 710 | 750 | 672 | 694 | 796 | 1 | 998 | 906 | 837 | 988 | 1 | 1 | 1 | 1 |
| no2 | 17 | 16 | 16 | 11 | 19 | 32 | 27 | 21 | 27 | 21 | 19 | 17 | 22 | 21 | 22 | 20 | 35 | 32 | 29 | 28 |
| o3 | 125 | 119 | 68 | 72 | 58 | 73 | 103 | 101 | 153 | 116 | 93 | 97 | 99 | 87 | 83 | 50 | 56 | 45 | 74 | 84 |
| pm10 | 49 | 38 | 28 | 33 | 43 | 62 | 66 | 47 | 51 | 33 | 25 | 28 | 43 | 30 | 37 | 35 | 64 | 42 | 38 | 36 |
| so2 | 14 | 11 | 7.2 | 7.9 | 6.8 | 13 | 13 | 8.2 | 8.7 | 8.6 | 6.7 | 7.8 | 11 | 12 | 8.9 | 6.4 | 9.5 | 7.7 | 10 | 9.6 |