Air Pollution in Xishuangbanna Dai Autonomous Prefecture: Real-time Air Quality Index and smog alert.
Pollution and air quality forecast for Xishuangbanna Dai Autonomous Prefecture. Today is Tuesday, June 16, 2026. The following air pollution values have been recorded for Xishuangbanna Dai Autonomous Prefecture:- particulate matter (PM2.5) dust - 61 (Unhealthy)
- nitrogen dioxide (NO2) - 22 (Good)
- particulate matter (PM10) suspended dust - 69 (Unhealthy for Sensitive Groups)
- carbon monoxide (CO) - 219 (Good)
- ozone (O3) - 0 (Good)
- sulfur dioxide (SO2) - 8 (Good)

What is the air quality in Xishuangbanna Dai Autonomous Prefecture today? Is the air polluted in Xishuangbanna Dai Autonomous Prefecture?. Is there smog?
What is the current level of PM2.5 in Xishuangbanna Dai Autonomous Prefecture? (particulate matter (PM2.5) dust)
Today's PM2.5 level is:
61 (Unhealthy)
For comparison, the highest level of PM2.5 in Xishuangbanna Dai Autonomous Prefecture in the last 7 days was: 28 (Friday, May 27, 2022) and the lowest: 28 (Friday, May 27, 2022).
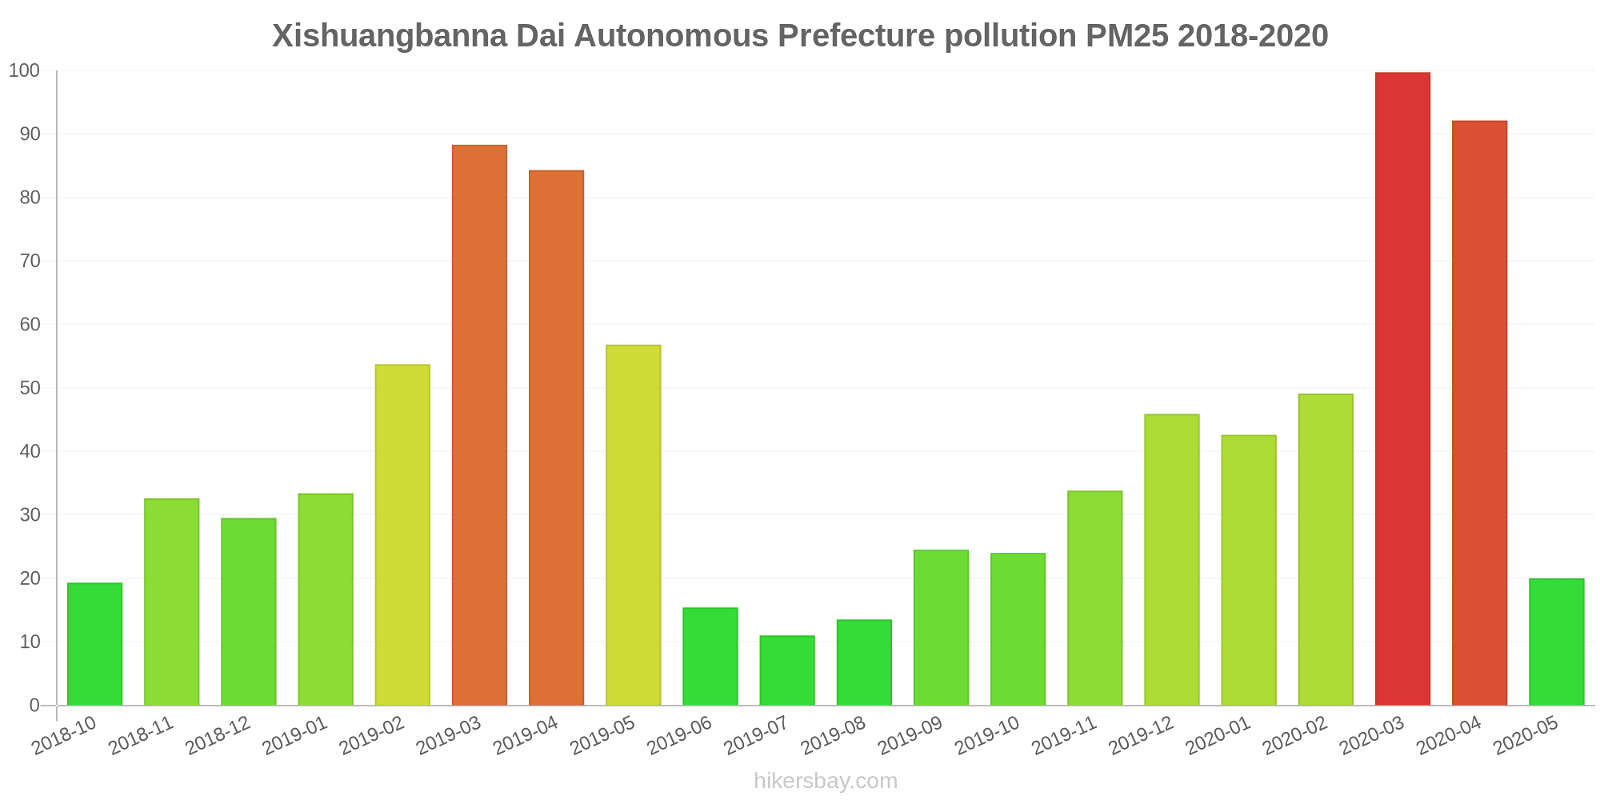
The highest PM2.5 values were recorded: 100 (March 2020).
The lowest level of particulate matter PM2.5 pollution occurs in month: July (11).
How high is the level of NO2? (nitrogen dioxide (NO2))
22 (Good)
What is the level of PM10 today in Xishuangbanna Dai Autonomous Prefecture? (particulate matter (PM10) suspended dust)
The current level of particulate matter PM10 in Xishuangbanna Dai Autonomous Prefecture is:
69 (Unhealthy for Sensitive Groups)
The highest PM10 values usually occur in month: 136 (April 2019).
The lowest value of particulate matter PM10 pollution in Xishuangbanna Dai Autonomous Prefecture is usually recorded in: July (28).
How high is the CO level? (carbon monoxide (CO))
219 (Good)
How is the O3 level today in Xishuangbanna Dai Autonomous Prefecture? (ozone (O3))
0 (Good)
What is the level of SO2 pollution? (sulfur dioxide (SO2))
8 (Good)
Current data Friday, May 27, 2022, 3:00 PM
PM2,5 61 (Unhealthy)
NO2 22 (Good)
PM10 69 (Unhealthy for Sensitive Groups)
CO 219 (Good)
O3 0 (Good)
SO2 8 (Good)
Data on air pollution from recent days in Xishuangbanna Dai Autonomous Prefecture
index
2022-05-27
pm25
28
Moderate
no2
22
Good
pm10
35
Moderate
co
579
Good
o3
22
Good
so2
5
Good
data source »
Air pollution in Xishuangbanna Dai Autonomous Prefecture from October 2018 to May 2020
index
2020-05
2020-04
2020-03
2020-02
2020-01
2019-12
2019-11
2019-10
2019-09
2019-08
2019-07
2019-06
2019-05
2019-04
2019-03
2019-02
2019-01
2018-12
2018-11
2018-10
pm25
20 (Moderate)
92 (Very Unhealthy)
100 (Very Unhealthy)
49 (Unhealthy for Sensitive Groups)
43 (Unhealthy for Sensitive Groups)
46 (Unhealthy for Sensitive Groups)
34 (Moderate)
24 (Moderate)
25 (Moderate)
14 (Moderate)
11 (Good)
15 (Moderate)
57 (Unhealthy)
84 (Very Unhealthy)
88 (Very Unhealthy)
54 (Unhealthy for Sensitive Groups)
33 (Moderate)
30 (Moderate)
33 (Moderate)
19 (Moderate)
co
522 (Good)
1 (Good)
1 (Good)
870 (Good)
877 (Good)
1 (Good)
745 (Good)
690 (Good)
690 (Good)
637 (Good)
491 (Good)
468 (Good)
796 (Good)
1 (Good)
1 (Good)
709 (Good)
869 (Good)
783 (Good)
672 (Good)
557 (Good)
no2
17 (Good)
30 (Good)
33 (Good)
13 (Good)
25 (Good)
31 (Good)
24 (Good)
18 (Good)
17 (Good)
13 (Good)
12 (Good)
15 (Good)
28 (Good)
38 (Good)
41 (Moderate)
31 (Good)
27 (Good)
25 (Good)
24 (Good)
17 (Good)
o3
93 (Moderate)
141 (Unhealthy for Sensitive Groups)
157 (Unhealthy)
109 (Moderate)
97 (Moderate)
87 (Moderate)
87 (Moderate)
86 (Moderate)
80 (Moderate)
74 (Moderate)
53 (Good)
75 (Moderate)
144 (Unhealthy for Sensitive Groups)
165 (Unhealthy)
139 (Unhealthy for Sensitive Groups)
115 (Moderate)
77 (Moderate)
68 (Good)
85 (Moderate)
74 (Moderate)
pm10
40 (Moderate)
100 (Unhealthy)
131 (Very Unhealthy)
62 (Unhealthy for Sensitive Groups)
68 (Unhealthy for Sensitive Groups)
83 (Unhealthy)
61 (Unhealthy for Sensitive Groups)
44 (Moderate)
47 (Moderate)
31 (Moderate)
28 (Moderate)
47 (Moderate)
114 (Very Unhealthy)
136 (Very Unhealthy)
129 (Very Unhealthy)
77 (Unhealthy for Sensitive Groups)
58 (Unhealthy for Sensitive Groups)
57 (Unhealthy for Sensitive Groups)
59 (Unhealthy for Sensitive Groups)
37 (Moderate)
so2
6.6 (Good)
5.6 (Good)
6.5 (Good)
5.5 (Good)
5.2 (Good)
5.1 (Good)
3.7 (Good)
4.3 (Good)
5 (Good)
3.8 (Good)
4.2 (Good)
3.5 (Good)
7.8 (Good)
5.6 (Good)
5.4 (Good)
5.5 (Good)
5.1 (Good)
6.1 (Good)
6.3 (Good)
5.3 (Good)
data source »
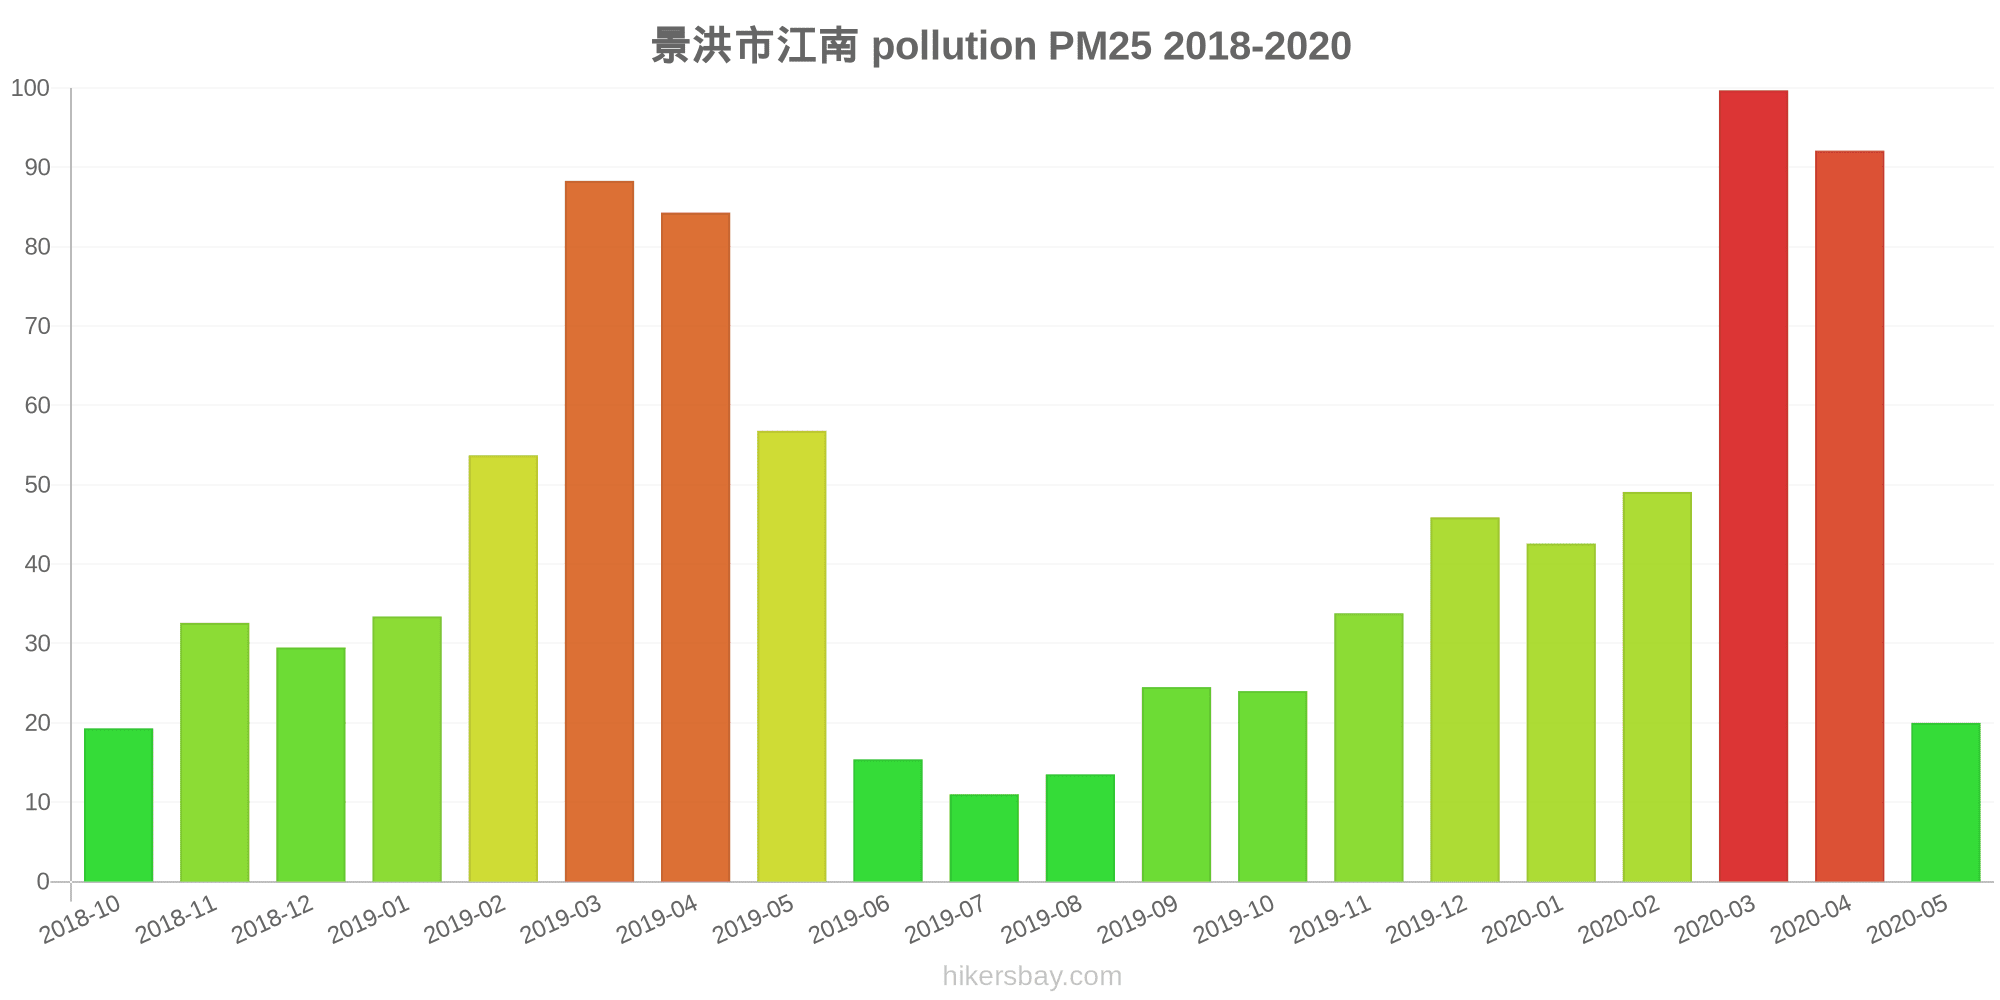
景洪市江南
Friday, May 27, 2022, 3:00 PM
PM2,5 61 (Unhealthy)
particulate matter (PM2.5) dust
NO2 22 (Good)
nitrogen dioxide (NO2)
PM10 69 (Unhealthy for Sensitive Groups)
particulate matter (PM10) suspended dust
CO 219 (Good)
carbon monoxide (CO)
O3 0.05 (Good)
ozone (O3)
SO2 7.7 (Good)
sulfur dioxide (SO2)
景洪市江南
index
2022-05-27
pm25
28
no2
22
pm10
35
co
579
o3
22
so2
4.6
景洪市江南
2018-10 2020-05

index
2020-05
2020-04
2020-03
2020-02
2020-01
2019-12
2019-11
2019-10
2019-09
2019-08
2019-07
2019-06
2019-05
2019-04
2019-03
2019-02
2019-01
2018-12
2018-11
2018-10
pm25
20
92
100
49
43
46
34
24
25
14
11
15
57
84
88
54
33
30
33
19
co
522
1
1
870
877
1
745
690
690
637
491
468
796
1
1
709
869
783
672
557
no2
17
30
33
13
25
31
24
18
17
13
12
15
28
38
41
31
27
25
24
17
o3
93
141
157
109
97
87
87
86
80
74
53
75
144
165
139
115
77
68
85
74
pm10
40
100
131
62
68
83
61
44
47
31
28
47
114
136
129
77
58
57
59
37
so2
6.6
5.6
6.5
5.5
5.2
5.1
3.7
4.3
5
3.8
4.2
3.5
7.8
5.6
5.4
5.5
5.1
6.1
6.3
5.3
* Pollution data source:
https://openaq.org
(ChinaAQIData)
The data is licensed under CC-By 4.0
PM2,5 61 (Unhealthy)
NO2 22 (Good)
PM10 69 (Unhealthy for Sensitive Groups)
CO 219 (Good)
O3 0 (Good)
SO2 8 (Good)
Data on air pollution from recent days in Xishuangbanna Dai Autonomous Prefecture
| index | 2022-05-27 |
|---|---|
| pm25 | 28 Moderate |
| no2 | 22 Good |
| pm10 | 35 Moderate |
| co | 579 Good |
| o3 | 22 Good |
| so2 | 5 Good |

| index | 2020-05 | 2020-04 | 2020-03 | 2020-02 | 2020-01 | 2019-12 | 2019-11 | 2019-10 | 2019-09 | 2019-08 | 2019-07 | 2019-06 | 2019-05 | 2019-04 | 2019-03 | 2019-02 | 2019-01 | 2018-12 | 2018-11 | 2018-10 |
|---|---|---|---|---|---|---|---|---|---|---|---|---|---|---|---|---|---|---|---|---|
| pm25 | 20 (Moderate) | 92 (Very Unhealthy) | 100 (Very Unhealthy) | 49 (Unhealthy for Sensitive Groups) | 43 (Unhealthy for Sensitive Groups) | 46 (Unhealthy for Sensitive Groups) | 34 (Moderate) | 24 (Moderate) | 25 (Moderate) | 14 (Moderate) | 11 (Good) | 15 (Moderate) | 57 (Unhealthy) | 84 (Very Unhealthy) | 88 (Very Unhealthy) | 54 (Unhealthy for Sensitive Groups) | 33 (Moderate) | 30 (Moderate) | 33 (Moderate) | 19 (Moderate) |
| co | 522 (Good) | 1 (Good) | 1 (Good) | 870 (Good) | 877 (Good) | 1 (Good) | 745 (Good) | 690 (Good) | 690 (Good) | 637 (Good) | 491 (Good) | 468 (Good) | 796 (Good) | 1 (Good) | 1 (Good) | 709 (Good) | 869 (Good) | 783 (Good) | 672 (Good) | 557 (Good) |
| no2 | 17 (Good) | 30 (Good) | 33 (Good) | 13 (Good) | 25 (Good) | 31 (Good) | 24 (Good) | 18 (Good) | 17 (Good) | 13 (Good) | 12 (Good) | 15 (Good) | 28 (Good) | 38 (Good) | 41 (Moderate) | 31 (Good) | 27 (Good) | 25 (Good) | 24 (Good) | 17 (Good) |
| o3 | 93 (Moderate) | 141 (Unhealthy for Sensitive Groups) | 157 (Unhealthy) | 109 (Moderate) | 97 (Moderate) | 87 (Moderate) | 87 (Moderate) | 86 (Moderate) | 80 (Moderate) | 74 (Moderate) | 53 (Good) | 75 (Moderate) | 144 (Unhealthy for Sensitive Groups) | 165 (Unhealthy) | 139 (Unhealthy for Sensitive Groups) | 115 (Moderate) | 77 (Moderate) | 68 (Good) | 85 (Moderate) | 74 (Moderate) |
| pm10 | 40 (Moderate) | 100 (Unhealthy) | 131 (Very Unhealthy) | 62 (Unhealthy for Sensitive Groups) | 68 (Unhealthy for Sensitive Groups) | 83 (Unhealthy) | 61 (Unhealthy for Sensitive Groups) | 44 (Moderate) | 47 (Moderate) | 31 (Moderate) | 28 (Moderate) | 47 (Moderate) | 114 (Very Unhealthy) | 136 (Very Unhealthy) | 129 (Very Unhealthy) | 77 (Unhealthy for Sensitive Groups) | 58 (Unhealthy for Sensitive Groups) | 57 (Unhealthy for Sensitive Groups) | 59 (Unhealthy for Sensitive Groups) | 37 (Moderate) |
| so2 | 6.6 (Good) | 5.6 (Good) | 6.5 (Good) | 5.5 (Good) | 5.2 (Good) | 5.1 (Good) | 3.7 (Good) | 4.3 (Good) | 5 (Good) | 3.8 (Good) | 4.2 (Good) | 3.5 (Good) | 7.8 (Good) | 5.6 (Good) | 5.4 (Good) | 5.5 (Good) | 5.1 (Good) | 6.1 (Good) | 6.3 (Good) | 5.3 (Good) |
PM2,5 61 (Unhealthy)
particulate matter (PM2.5) dustNO2 22 (Good)
nitrogen dioxide (NO2)PM10 69 (Unhealthy for Sensitive Groups)
particulate matter (PM10) suspended dustCO 219 (Good)
carbon monoxide (CO)O3 0.05 (Good)
ozone (O3)SO2 7.7 (Good)
sulfur dioxide (SO2)景洪市江南
| index | 2022-05-27 |
|---|---|
| pm25 | 28 |
| no2 | 22 |
| pm10 | 35 |
| co | 579 |
| o3 | 22 |
| so2 | 4.6 |
景洪市江南
| index | 2020-05 | 2020-04 | 2020-03 | 2020-02 | 2020-01 | 2019-12 | 2019-11 | 2019-10 | 2019-09 | 2019-08 | 2019-07 | 2019-06 | 2019-05 | 2019-04 | 2019-03 | 2019-02 | 2019-01 | 2018-12 | 2018-11 | 2018-10 |
|---|---|---|---|---|---|---|---|---|---|---|---|---|---|---|---|---|---|---|---|---|
| pm25 | 20 | 92 | 100 | 49 | 43 | 46 | 34 | 24 | 25 | 14 | 11 | 15 | 57 | 84 | 88 | 54 | 33 | 30 | 33 | 19 |
| co | 522 | 1 | 1 | 870 | 877 | 1 | 745 | 690 | 690 | 637 | 491 | 468 | 796 | 1 | 1 | 709 | 869 | 783 | 672 | 557 |
| no2 | 17 | 30 | 33 | 13 | 25 | 31 | 24 | 18 | 17 | 13 | 12 | 15 | 28 | 38 | 41 | 31 | 27 | 25 | 24 | 17 |
| o3 | 93 | 141 | 157 | 109 | 97 | 87 | 87 | 86 | 80 | 74 | 53 | 75 | 144 | 165 | 139 | 115 | 77 | 68 | 85 | 74 |
| pm10 | 40 | 100 | 131 | 62 | 68 | 83 | 61 | 44 | 47 | 31 | 28 | 47 | 114 | 136 | 129 | 77 | 58 | 57 | 59 | 37 |
| so2 | 6.6 | 5.6 | 6.5 | 5.5 | 5.2 | 5.1 | 3.7 | 4.3 | 5 | 3.8 | 4.2 | 3.5 | 7.8 | 5.6 | 5.4 | 5.5 | 5.1 | 6.1 | 6.3 | 5.3 |