Air Pollution in Xueying: Real-time Air Quality Index and smog alert.
Pollution and air quality forecast for Xueying. Today is Tuesday, June 2, 2026. The following air pollution values have been recorded for Xueying:- particulate matter (PM10) suspended dust - 179 (Very bad Hazardous)
- particulate matter (PM2.5) dust - 35 (Unhealthy for Sensitive Groups)
- ozone (O3) - 0 (Good)
- nitrogen dioxide (NO2) - 0 (Good)
- sulfur dioxide (SO2) - 0 (Good)

What is the air quality in Xueying today? Is the air polluted in Xueying?. Is there smog?
What is the level of PM10 today in Xueying? (particulate matter (PM10) suspended dust)
The current level of particulate matter PM10 in Xueying is:
179 (Very bad Hazardous)
The highest PM10 values usually occur in month: 147 (November 2018).
The lowest value of particulate matter PM10 pollution in Xueying is usually recorded in: August (46).
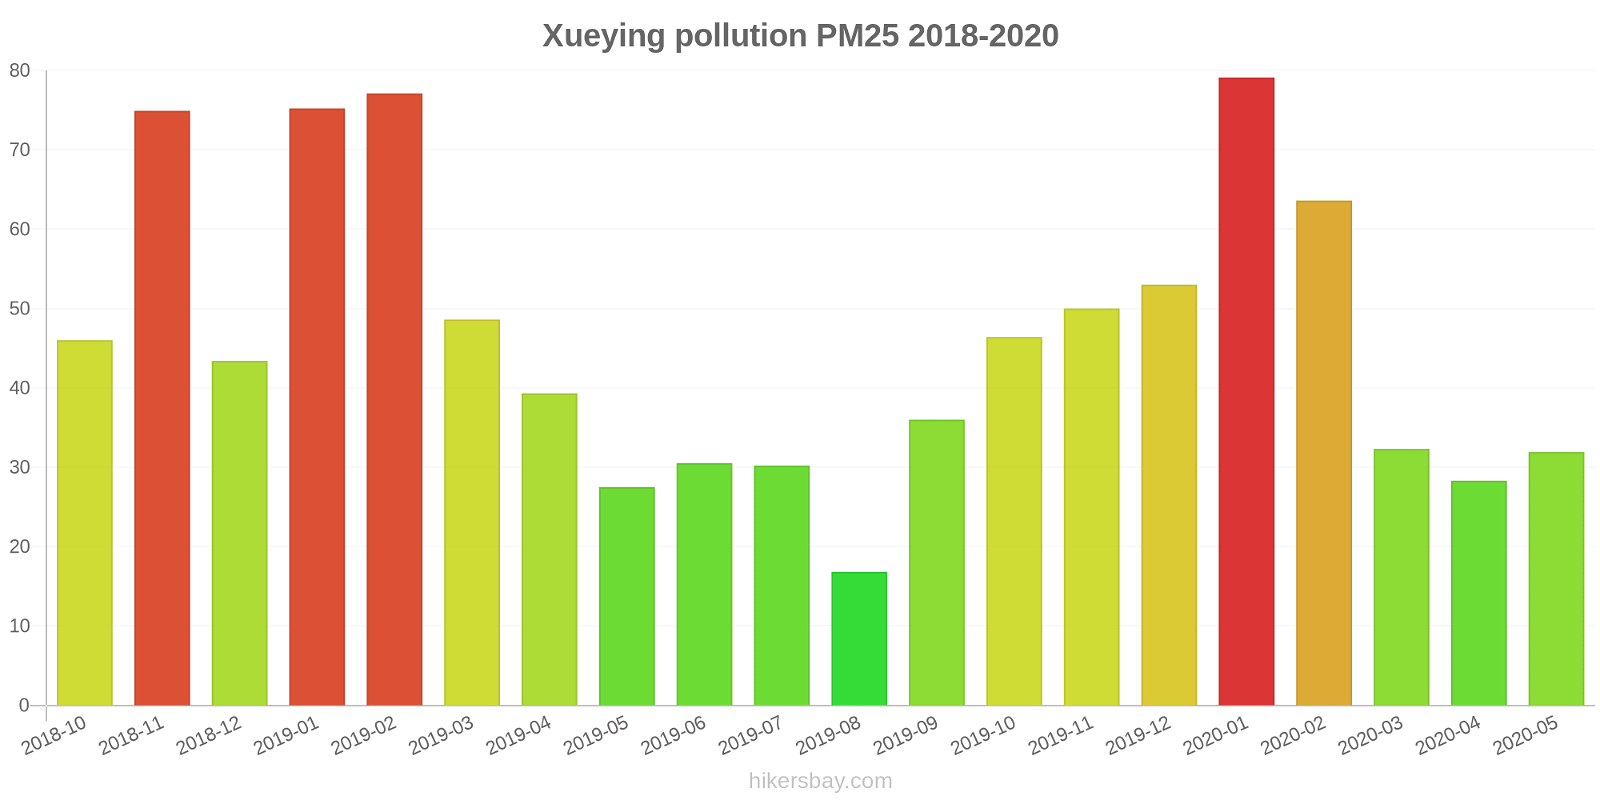
What is the current level of PM2.5 in Xueying? (particulate matter (PM2.5) dust)
Today's PM2.5 level is:
35 (Unhealthy for Sensitive Groups)
For comparison, the highest level of PM2.5 in Xueying in the last 7 days was: 56 (Friday, May 27, 2022) and the lowest: 56 (Friday, May 27, 2022).
The highest PM2.5 values were recorded: 79 (January 2020).
The lowest level of particulate matter PM2.5 pollution occurs in month: August (17).
How is the O3 level today in Xueying? (ozone (O3))
0 (Good)
How high is the level of NO2? (nitrogen dioxide (NO2))
0 (Good)
What is the level of SO2 pollution? (sulfur dioxide (SO2))
0 (Good)
Current data Friday, May 27, 2022, 12:00 PM
PM10 179 (Very bad Hazardous)
PM2,5 35 (Unhealthy for Sensitive Groups)
O3 0 (Good)
NO2 0 (Good)
SO2 0 (Good)
Data on air pollution from recent days in Xueying
index
2022-05-27
pm10
56
Unhealthy for Sensitive Groups
pm25
56
Unhealthy
o3
0
Good
no2
0
Good
so2
0
Good
data source »
Air pollution in Xueying from October 2018 to May 2020
index
2020-05
2020-04
2020-03
2020-02
2020-01
2019-12
2019-11
2019-10
2019-09
2019-08
2019-07
2019-06
2019-05
2019-04
2019-03
2019-02
2019-01
2018-12
2018-11
2018-10
pm25
32 (Moderate)
28 (Moderate)
32 (Moderate)
64 (Unhealthy)
79 (Very Unhealthy)
53 (Unhealthy for Sensitive Groups)
50 (Unhealthy for Sensitive Groups)
46 (Unhealthy for Sensitive Groups)
36 (Unhealthy for Sensitive Groups)
17 (Moderate)
30 (Moderate)
31 (Moderate)
28 (Moderate)
39 (Unhealthy for Sensitive Groups)
49 (Unhealthy for Sensitive Groups)
77 (Very Unhealthy)
75 (Very Unhealthy)
43 (Unhealthy for Sensitive Groups)
75 (Unhealthy)
46 (Unhealthy for Sensitive Groups)
co
607 (Good)
496 (Good)
494 (Good)
992 (Good)
1 (Good)
1 (Good)
861 (Good)
618 (Good)
607 (Good)
415 (Good)
767 (Good)
801 (Good)
676 (Good)
779 (Good)
800 (Good)
1 (Good)
1 (Good)
1 (Good)
1 (Good)
1 (Good)
no2
23 (Good)
29 (Good)
28 (Good)
28 (Good)
50 (Moderate)
54 (Moderate)
52 (Moderate)
47 (Moderate)
35 (Good)
29 (Good)
26 (Good)
26 (Good)
29 (Good)
34 (Good)
37 (Good)
37 (Good)
54 (Moderate)
53 (Moderate)
71 (Moderate)
69 (Moderate)
o3
150 (Unhealthy)
138 (Unhealthy for Sensitive Groups)
101 (Moderate)
80 (Moderate)
67 (Good)
56 (Good)
51 (Good)
96 (Moderate)
177 (Unhealthy)
135 (Unhealthy for Sensitive Groups)
195 (Very Unhealthy)
196 (Very Unhealthy)
179 (Unhealthy)
130 (Unhealthy for Sensitive Groups)
114 (Moderate)
87 (Moderate)
55 (Good)
48 (Good)
60 (Good)
81 (Moderate)
pm10
69 (Unhealthy for Sensitive Groups)
73 (Unhealthy for Sensitive Groups)
68 (Unhealthy for Sensitive Groups)
88 (Unhealthy)
113 (Very Unhealthy)
87 (Unhealthy)
98 (Unhealthy)
87 (Unhealthy)
74 (Unhealthy for Sensitive Groups)
46 (Moderate)
71 (Unhealthy for Sensitive Groups)
80 (Unhealthy)
82 (Unhealthy)
95 (Unhealthy)
100 (Unhealthy)
128 (Very Unhealthy)
126 (Very Unhealthy)
99 (Unhealthy)
147 (Very Unhealthy)
100 (Unhealthy)
so2
5.1 (Good)
6 (Good)
6.5 (Good)
6.6 (Good)
11 (Good)
9.3 (Good)
9.4 (Good)
6.5 (Good)
6.5 (Good)
3.8 (Good)
3 (Good)
5.9 (Good)
6.7 (Good)
8.3 (Good)
7.7 (Good)
10 (Good)
18 (Good)
13 (Good)
15 (Good)
10 (Good)
data source »
河北工业大学
Friday, May 27, 2022, 12:00 PM
PM10 179 (Very bad Hazardous)
particulate matter (PM10) suspended dust
PM2,5 35 (Unhealthy for Sensitive Groups)
particulate matter (PM2.5) dust
O3 0.04 (Good)
ozone (O3)
NO2 0 (Good)
nitrogen dioxide (NO2)
SO2 0 (Good)
sulfur dioxide (SO2)
河北工业大学
index
2022-05-27
pm10
56
pm25
56
o3
0.03
no2
0
so2
0
河北工业大学
2018-10 2020-05

index
2020-05
2020-04
2020-03
2020-02
2020-01
2019-12
2019-11
2019-10
2019-09
2019-08
2019-07
2019-06
2019-05
2019-04
2019-03
2019-02
2019-01
2018-12
2018-11
2018-10
pm25
32
28
32
64
79
53
50
46
36
17
30
31
28
39
49
77
75
43
75
46
co
607
496
494
992
1
1
861
618
607
415
767
801
676
779
800
1
1
1
1
1
no2
23
29
28
28
50
54
52
47
35
29
26
26
29
34
37
37
54
53
71
69
o3
150
138
101
80
67
56
51
96
177
135
195
196
179
130
114
87
55
48
60
81
pm10
69
73
68
88
113
87
98
87
74
46
71
80
82
95
100
128
126
99
147
100
so2
5.1
6
6.5
6.6
11
9.3
9.4
6.5
6.5
3.8
3
5.9
6.7
8.3
7.7
10
18
13
15
10
* Pollution data source:
https://openaq.org
(ChinaAQIData)
The data is licensed under CC-By 4.0
PM10 179 (Very bad Hazardous)
PM2,5 35 (Unhealthy for Sensitive Groups)
O3 0 (Good)
NO2 0 (Good)
SO2 0 (Good)
Data on air pollution from recent days in Xueying
| index | 2022-05-27 |
|---|---|
| pm10 | 56 Unhealthy for Sensitive Groups |
| pm25 | 56 Unhealthy |
| o3 | 0 Good |
| no2 | 0 Good |
| so2 | 0 Good |

| index | 2020-05 | 2020-04 | 2020-03 | 2020-02 | 2020-01 | 2019-12 | 2019-11 | 2019-10 | 2019-09 | 2019-08 | 2019-07 | 2019-06 | 2019-05 | 2019-04 | 2019-03 | 2019-02 | 2019-01 | 2018-12 | 2018-11 | 2018-10 |
|---|---|---|---|---|---|---|---|---|---|---|---|---|---|---|---|---|---|---|---|---|
| pm25 | 32 (Moderate) | 28 (Moderate) | 32 (Moderate) | 64 (Unhealthy) | 79 (Very Unhealthy) | 53 (Unhealthy for Sensitive Groups) | 50 (Unhealthy for Sensitive Groups) | 46 (Unhealthy for Sensitive Groups) | 36 (Unhealthy for Sensitive Groups) | 17 (Moderate) | 30 (Moderate) | 31 (Moderate) | 28 (Moderate) | 39 (Unhealthy for Sensitive Groups) | 49 (Unhealthy for Sensitive Groups) | 77 (Very Unhealthy) | 75 (Very Unhealthy) | 43 (Unhealthy for Sensitive Groups) | 75 (Unhealthy) | 46 (Unhealthy for Sensitive Groups) |
| co | 607 (Good) | 496 (Good) | 494 (Good) | 992 (Good) | 1 (Good) | 1 (Good) | 861 (Good) | 618 (Good) | 607 (Good) | 415 (Good) | 767 (Good) | 801 (Good) | 676 (Good) | 779 (Good) | 800 (Good) | 1 (Good) | 1 (Good) | 1 (Good) | 1 (Good) | 1 (Good) |
| no2 | 23 (Good) | 29 (Good) | 28 (Good) | 28 (Good) | 50 (Moderate) | 54 (Moderate) | 52 (Moderate) | 47 (Moderate) | 35 (Good) | 29 (Good) | 26 (Good) | 26 (Good) | 29 (Good) | 34 (Good) | 37 (Good) | 37 (Good) | 54 (Moderate) | 53 (Moderate) | 71 (Moderate) | 69 (Moderate) |
| o3 | 150 (Unhealthy) | 138 (Unhealthy for Sensitive Groups) | 101 (Moderate) | 80 (Moderate) | 67 (Good) | 56 (Good) | 51 (Good) | 96 (Moderate) | 177 (Unhealthy) | 135 (Unhealthy for Sensitive Groups) | 195 (Very Unhealthy) | 196 (Very Unhealthy) | 179 (Unhealthy) | 130 (Unhealthy for Sensitive Groups) | 114 (Moderate) | 87 (Moderate) | 55 (Good) | 48 (Good) | 60 (Good) | 81 (Moderate) |
| pm10 | 69 (Unhealthy for Sensitive Groups) | 73 (Unhealthy for Sensitive Groups) | 68 (Unhealthy for Sensitive Groups) | 88 (Unhealthy) | 113 (Very Unhealthy) | 87 (Unhealthy) | 98 (Unhealthy) | 87 (Unhealthy) | 74 (Unhealthy for Sensitive Groups) | 46 (Moderate) | 71 (Unhealthy for Sensitive Groups) | 80 (Unhealthy) | 82 (Unhealthy) | 95 (Unhealthy) | 100 (Unhealthy) | 128 (Very Unhealthy) | 126 (Very Unhealthy) | 99 (Unhealthy) | 147 (Very Unhealthy) | 100 (Unhealthy) |
| so2 | 5.1 (Good) | 6 (Good) | 6.5 (Good) | 6.6 (Good) | 11 (Good) | 9.3 (Good) | 9.4 (Good) | 6.5 (Good) | 6.5 (Good) | 3.8 (Good) | 3 (Good) | 5.9 (Good) | 6.7 (Good) | 8.3 (Good) | 7.7 (Good) | 10 (Good) | 18 (Good) | 13 (Good) | 15 (Good) | 10 (Good) |
PM10 179 (Very bad Hazardous)
particulate matter (PM10) suspended dustPM2,5 35 (Unhealthy for Sensitive Groups)
particulate matter (PM2.5) dustO3 0.04 (Good)
ozone (O3)NO2 0 (Good)
nitrogen dioxide (NO2)SO2 0 (Good)
sulfur dioxide (SO2)河北工业大学
| index | 2022-05-27 |
|---|---|
| pm10 | 56 |
| pm25 | 56 |
| o3 | 0.03 |
| no2 | 0 |
| so2 | 0 |
河北工业大学

| index | 2020-05 | 2020-04 | 2020-03 | 2020-02 | 2020-01 | 2019-12 | 2019-11 | 2019-10 | 2019-09 | 2019-08 | 2019-07 | 2019-06 | 2019-05 | 2019-04 | 2019-03 | 2019-02 | 2019-01 | 2018-12 | 2018-11 | 2018-10 |
|---|---|---|---|---|---|---|---|---|---|---|---|---|---|---|---|---|---|---|---|---|
| pm25 | 32 | 28 | 32 | 64 | 79 | 53 | 50 | 46 | 36 | 17 | 30 | 31 | 28 | 39 | 49 | 77 | 75 | 43 | 75 | 46 |
| co | 607 | 496 | 494 | 992 | 1 | 1 | 861 | 618 | 607 | 415 | 767 | 801 | 676 | 779 | 800 | 1 | 1 | 1 | 1 | 1 |
| no2 | 23 | 29 | 28 | 28 | 50 | 54 | 52 | 47 | 35 | 29 | 26 | 26 | 29 | 34 | 37 | 37 | 54 | 53 | 71 | 69 |
| o3 | 150 | 138 | 101 | 80 | 67 | 56 | 51 | 96 | 177 | 135 | 195 | 196 | 179 | 130 | 114 | 87 | 55 | 48 | 60 | 81 |
| pm10 | 69 | 73 | 68 | 88 | 113 | 87 | 98 | 87 | 74 | 46 | 71 | 80 | 82 | 95 | 100 | 128 | 126 | 99 | 147 | 100 |
| so2 | 5.1 | 6 | 6.5 | 6.6 | 11 | 9.3 | 9.4 | 6.5 | 6.5 | 3.8 | 3 | 5.9 | 6.7 | 8.3 | 7.7 | 10 | 18 | 13 | 15 | 10 |