Air Pollution in Hutun: Real-time Air Quality Index and smog alert.
Pollution and air quality forecast for Hutun. Today is Tuesday, June 2, 2026. The following air pollution values have been recorded for Hutun:- particulate matter (PM10) suspended dust - 179 (Very bad Hazardous)
- particulate matter (PM2.5) dust - 35 (Unhealthy for Sensitive Groups)
- ozone (O3) - 0 (Good)
- nitrogen dioxide (NO2) - 0 (Good)
- sulfur dioxide (SO2) - 0 (Good)

What is the air quality in Hutun today? Is the air polluted in Hutun?. Is there smog?
What is the level of PM10 today in Hutun? (particulate matter (PM10) suspended dust)
The current level of particulate matter PM10 in Hutun is:
179 (Very bad Hazardous)
The highest PM10 values usually occur in month: 147 (November 2018).
The lowest value of particulate matter PM10 pollution in Hutun is usually recorded in: August (37).
What is the current level of PM2.5 in Hutun? (particulate matter (PM2.5) dust)
Today's PM2.5 level is:
35 (Unhealthy for Sensitive Groups)
For comparison, the highest level of PM2.5 in Hutun in the last 7 days was: 56 (Friday, May 27, 2022) and the lowest: 56 (Friday, May 27, 2022).
The highest PM2.5 values were recorded: 85 (November 2018).
The lowest level of particulate matter PM2.5 pollution occurs in month: August (21).
How is the O3 level today in Hutun? (ozone (O3))
0 (Good)
How high is the level of NO2? (nitrogen dioxide (NO2))
0 (Good)
What is the level of SO2 pollution? (sulfur dioxide (SO2))
0 (Good)
Current data Friday, May 27, 2022, 12:00 PM
PM10 179 (Very bad Hazardous)
PM2,5 35 (Unhealthy for Sensitive Groups)
O3 0 (Good)
NO2 0 (Good)
SO2 0 (Good)
Data on air pollution from recent days in Hutun
index
2022-05-27
pm10
56
Unhealthy for Sensitive Groups
pm25
56
Unhealthy
o3
0
Good
no2
0
Good
so2
0
Good
data source »
Air pollution in Hutun from October 2018 to May 2020
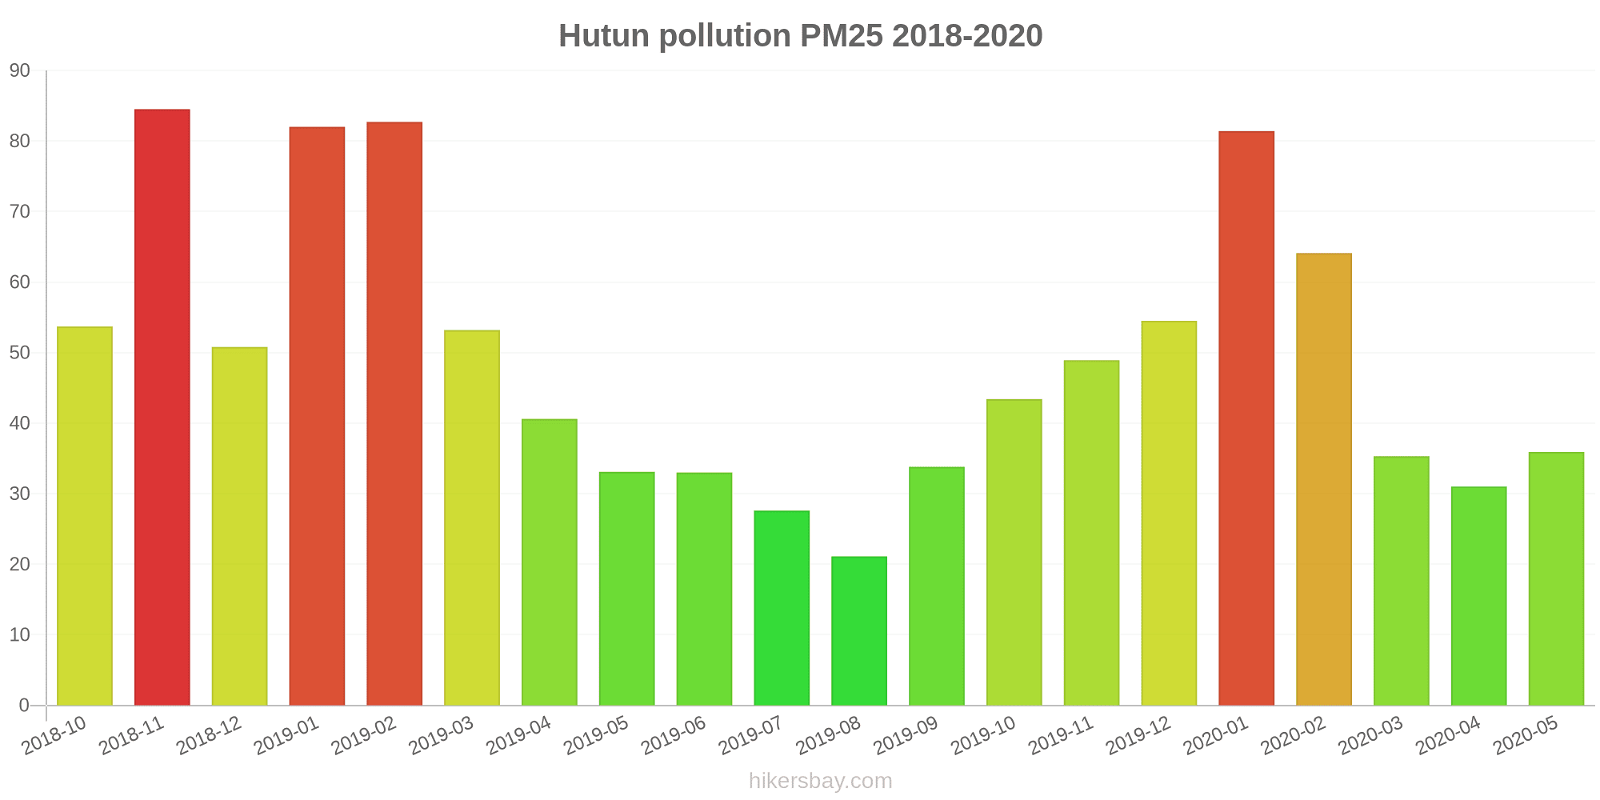
index
2020-05
2020-04
2020-03
2020-02
2020-01
2019-12
2019-11
2019-10
2019-09
2019-08
2019-07
2019-06
2019-05
2019-04
2019-03
2019-02
2019-01
2018-12
2018-11
2018-10
pm25
36 (Unhealthy for Sensitive Groups)
31 (Moderate)
35 (Unhealthy for Sensitive Groups)
64 (Unhealthy)
81 (Very Unhealthy)
55 (Unhealthy for Sensitive Groups)
49 (Unhealthy for Sensitive Groups)
43 (Unhealthy for Sensitive Groups)
34 (Moderate)
21 (Moderate)
28 (Moderate)
33 (Moderate)
33 (Moderate)
41 (Unhealthy for Sensitive Groups)
53 (Unhealthy for Sensitive Groups)
83 (Very Unhealthy)
82 (Very Unhealthy)
51 (Unhealthy for Sensitive Groups)
85 (Very Unhealthy)
54 (Unhealthy for Sensitive Groups)
co
620 (Good)
483 (Good)
509 (Good)
913 (Good)
1 (Good)
983 (Good)
792 (Good)
674 (Good)
564 (Good)
467 (Good)
707 (Good)
669 (Good)
638 (Good)
813 (Good)
1 (Good)
1 (Good)
1 (Good)
1 (Good)
1 (Good)
1 (Good)
no2
28 (Good)
32 (Good)
29 (Good)
28 (Good)
50 (Moderate)
54 (Moderate)
59 (Moderate)
49 (Moderate)
40 (Good)
29 (Good)
21 (Good)
25 (Good)
27 (Good)
30 (Good)
38 (Good)
37 (Good)
58 (Moderate)
54 (Moderate)
68 (Moderate)
57 (Moderate)
o3
143 (Unhealthy for Sensitive Groups)
143 (Unhealthy for Sensitive Groups)
104 (Moderate)
86 (Moderate)
70 (Good)
50 (Good)
55 (Good)
102 (Moderate)
187 (Very Unhealthy)
142 (Unhealthy for Sensitive Groups)
201 (Very Unhealthy)
216 (Very Unhealthy)
181 (Very Unhealthy)
128 (Unhealthy for Sensitive Groups)
111 (Moderate)
82 (Moderate)
53 (Good)
49 (Good)
61 (Good)
88 (Moderate)
pm10
68 (Unhealthy for Sensitive Groups)
68 (Unhealthy for Sensitive Groups)
64 (Unhealthy for Sensitive Groups)
87 (Unhealthy)
116 (Very Unhealthy)
86 (Unhealthy)
99 (Unhealthy)
85 (Unhealthy)
69 (Unhealthy for Sensitive Groups)
37 (Moderate)
57 (Unhealthy for Sensitive Groups)
67 (Unhealthy for Sensitive Groups)
82 (Unhealthy)
89 (Unhealthy)
99 (Unhealthy)
132 (Very Unhealthy)
129 (Very Unhealthy)
103 (Unhealthy)
147 (Very Unhealthy)
94 (Unhealthy)
so2
7 (Good)
7.7 (Good)
7 (Good)
6.9 (Good)
11 (Good)
8.9 (Good)
13 (Good)
8.7 (Good)
9.3 (Good)
5.1 (Good)
4.3 (Good)
7.3 (Good)
9.3 (Good)
10 (Good)
10 (Good)
12 (Good)
19 (Good)
14 (Good)
16 (Good)
9.3 (Good)
data source »
北华航天学院
Friday, May 27, 2022, 12:00 PM
PM10 179 (Very bad Hazardous)
particulate matter (PM10) suspended dust
PM2,5 35 (Unhealthy for Sensitive Groups)
particulate matter (PM2.5) dust
O3 0.04 (Good)
ozone (O3)
NO2 0 (Good)
nitrogen dioxide (NO2)
SO2 0 (Good)
sulfur dioxide (SO2)
北华航天学院
index
2022-05-27
pm10
56
pm25
56
o3
0.03
no2
0
so2
0
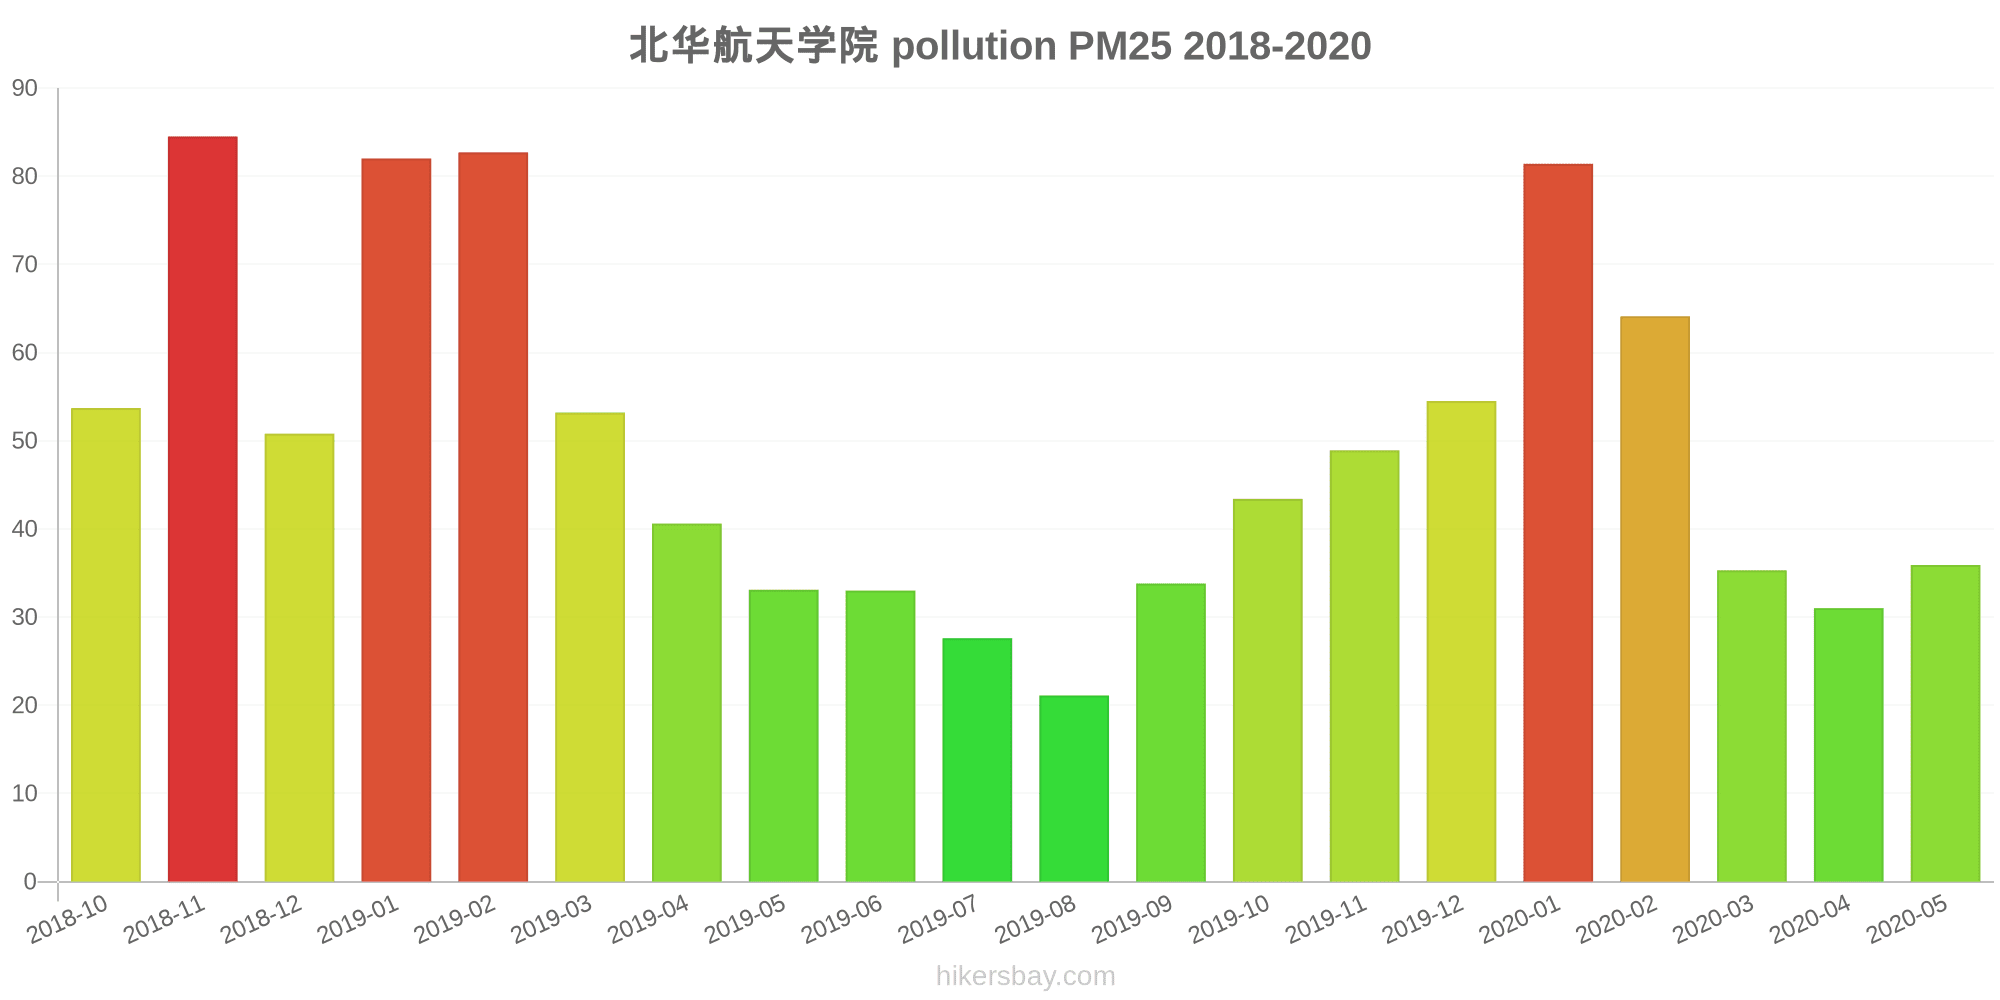
北华航天学院
2018-10 2020-05

index
2020-05
2020-04
2020-03
2020-02
2020-01
2019-12
2019-11
2019-10
2019-09
2019-08
2019-07
2019-06
2019-05
2019-04
2019-03
2019-02
2019-01
2018-12
2018-11
2018-10
pm25
36
31
35
64
81
55
49
43
34
21
28
33
33
41
53
83
82
51
85
54
co
620
483
509
913
1
983
792
674
564
467
707
669
638
813
1
1
1
1
1
1
no2
28
32
29
28
50
54
59
49
40
29
21
25
27
30
38
37
58
54
68
57
o3
143
143
104
86
70
50
55
102
187
142
201
216
181
128
111
82
53
49
61
88
pm10
68
68
64
87
116
86
99
85
69
37
57
67
82
89
99
132
129
103
147
94
so2
7
7.7
7
6.9
11
8.9
13
8.7
9.3
5.1
4.3
7.3
9.3
10
10
12
19
14
16
9.3
* Pollution data source:
https://openaq.org
(ChinaAQIData)
The data is licensed under CC-By 4.0
PM10 179 (Very bad Hazardous)
PM2,5 35 (Unhealthy for Sensitive Groups)
O3 0 (Good)
NO2 0 (Good)
SO2 0 (Good)
Data on air pollution from recent days in Hutun
| index | 2022-05-27 |
|---|---|
| pm10 | 56 Unhealthy for Sensitive Groups |
| pm25 | 56 Unhealthy |
| o3 | 0 Good |
| no2 | 0 Good |
| so2 | 0 Good |

| index | 2020-05 | 2020-04 | 2020-03 | 2020-02 | 2020-01 | 2019-12 | 2019-11 | 2019-10 | 2019-09 | 2019-08 | 2019-07 | 2019-06 | 2019-05 | 2019-04 | 2019-03 | 2019-02 | 2019-01 | 2018-12 | 2018-11 | 2018-10 |
|---|---|---|---|---|---|---|---|---|---|---|---|---|---|---|---|---|---|---|---|---|
| pm25 | 36 (Unhealthy for Sensitive Groups) | 31 (Moderate) | 35 (Unhealthy for Sensitive Groups) | 64 (Unhealthy) | 81 (Very Unhealthy) | 55 (Unhealthy for Sensitive Groups) | 49 (Unhealthy for Sensitive Groups) | 43 (Unhealthy for Sensitive Groups) | 34 (Moderate) | 21 (Moderate) | 28 (Moderate) | 33 (Moderate) | 33 (Moderate) | 41 (Unhealthy for Sensitive Groups) | 53 (Unhealthy for Sensitive Groups) | 83 (Very Unhealthy) | 82 (Very Unhealthy) | 51 (Unhealthy for Sensitive Groups) | 85 (Very Unhealthy) | 54 (Unhealthy for Sensitive Groups) |
| co | 620 (Good) | 483 (Good) | 509 (Good) | 913 (Good) | 1 (Good) | 983 (Good) | 792 (Good) | 674 (Good) | 564 (Good) | 467 (Good) | 707 (Good) | 669 (Good) | 638 (Good) | 813 (Good) | 1 (Good) | 1 (Good) | 1 (Good) | 1 (Good) | 1 (Good) | 1 (Good) |
| no2 | 28 (Good) | 32 (Good) | 29 (Good) | 28 (Good) | 50 (Moderate) | 54 (Moderate) | 59 (Moderate) | 49 (Moderate) | 40 (Good) | 29 (Good) | 21 (Good) | 25 (Good) | 27 (Good) | 30 (Good) | 38 (Good) | 37 (Good) | 58 (Moderate) | 54 (Moderate) | 68 (Moderate) | 57 (Moderate) |
| o3 | 143 (Unhealthy for Sensitive Groups) | 143 (Unhealthy for Sensitive Groups) | 104 (Moderate) | 86 (Moderate) | 70 (Good) | 50 (Good) | 55 (Good) | 102 (Moderate) | 187 (Very Unhealthy) | 142 (Unhealthy for Sensitive Groups) | 201 (Very Unhealthy) | 216 (Very Unhealthy) | 181 (Very Unhealthy) | 128 (Unhealthy for Sensitive Groups) | 111 (Moderate) | 82 (Moderate) | 53 (Good) | 49 (Good) | 61 (Good) | 88 (Moderate) |
| pm10 | 68 (Unhealthy for Sensitive Groups) | 68 (Unhealthy for Sensitive Groups) | 64 (Unhealthy for Sensitive Groups) | 87 (Unhealthy) | 116 (Very Unhealthy) | 86 (Unhealthy) | 99 (Unhealthy) | 85 (Unhealthy) | 69 (Unhealthy for Sensitive Groups) | 37 (Moderate) | 57 (Unhealthy for Sensitive Groups) | 67 (Unhealthy for Sensitive Groups) | 82 (Unhealthy) | 89 (Unhealthy) | 99 (Unhealthy) | 132 (Very Unhealthy) | 129 (Very Unhealthy) | 103 (Unhealthy) | 147 (Very Unhealthy) | 94 (Unhealthy) |
| so2 | 7 (Good) | 7.7 (Good) | 7 (Good) | 6.9 (Good) | 11 (Good) | 8.9 (Good) | 13 (Good) | 8.7 (Good) | 9.3 (Good) | 5.1 (Good) | 4.3 (Good) | 7.3 (Good) | 9.3 (Good) | 10 (Good) | 10 (Good) | 12 (Good) | 19 (Good) | 14 (Good) | 16 (Good) | 9.3 (Good) |
PM10 179 (Very bad Hazardous)
particulate matter (PM10) suspended dustPM2,5 35 (Unhealthy for Sensitive Groups)
particulate matter (PM2.5) dustO3 0.04 (Good)
ozone (O3)NO2 0 (Good)
nitrogen dioxide (NO2)SO2 0 (Good)
sulfur dioxide (SO2)北华航天学院
| index | 2022-05-27 |
|---|---|
| pm10 | 56 |
| pm25 | 56 |
| o3 | 0.03 |
| no2 | 0 |
| so2 | 0 |
北华航天学院
| index | 2020-05 | 2020-04 | 2020-03 | 2020-02 | 2020-01 | 2019-12 | 2019-11 | 2019-10 | 2019-09 | 2019-08 | 2019-07 | 2019-06 | 2019-05 | 2019-04 | 2019-03 | 2019-02 | 2019-01 | 2018-12 | 2018-11 | 2018-10 |
|---|---|---|---|---|---|---|---|---|---|---|---|---|---|---|---|---|---|---|---|---|
| pm25 | 36 | 31 | 35 | 64 | 81 | 55 | 49 | 43 | 34 | 21 | 28 | 33 | 33 | 41 | 53 | 83 | 82 | 51 | 85 | 54 |
| co | 620 | 483 | 509 | 913 | 1 | 983 | 792 | 674 | 564 | 467 | 707 | 669 | 638 | 813 | 1 | 1 | 1 | 1 | 1 | 1 |
| no2 | 28 | 32 | 29 | 28 | 50 | 54 | 59 | 49 | 40 | 29 | 21 | 25 | 27 | 30 | 38 | 37 | 58 | 54 | 68 | 57 |
| o3 | 143 | 143 | 104 | 86 | 70 | 50 | 55 | 102 | 187 | 142 | 201 | 216 | 181 | 128 | 111 | 82 | 53 | 49 | 61 | 88 |
| pm10 | 68 | 68 | 64 | 87 | 116 | 86 | 99 | 85 | 69 | 37 | 57 | 67 | 82 | 89 | 99 | 132 | 129 | 103 | 147 | 94 |
| so2 | 7 | 7.7 | 7 | 6.9 | 11 | 8.9 | 13 | 8.7 | 9.3 | 5.1 | 4.3 | 7.3 | 9.3 | 10 | 10 | 12 | 19 | 14 | 16 | 9.3 |