Air Pollution in Nanliugezhuang: Real-time Air Quality Index and smog alert.
Pollution and air quality forecast for Nanliugezhuang. Today is Tuesday, June 2, 2026. The following air pollution values have been recorded for Nanliugezhuang:- particulate matter (PM10) suspended dust - 179 (Very bad Hazardous)
- particulate matter (PM2.5) dust - 35 (Unhealthy for Sensitive Groups)
- ozone (O3) - 0 (Good)
- nitrogen dioxide (NO2) - 0 (Good)
- sulfur dioxide (SO2) - 0 (Good)

What is the air quality in Nanliugezhuang today? Is the air polluted in Nanliugezhuang?. Is there smog?
What is the level of PM10 today in Nanliugezhuang? (particulate matter (PM10) suspended dust)
The current level of particulate matter PM10 in Nanliugezhuang is:
179 (Very bad Hazardous)
The highest PM10 values usually occur in month: 242 (January 2019).
The lowest value of particulate matter PM10 pollution in Nanliugezhuang is usually recorded in: August (68).
What is the current level of PM2.5 in Nanliugezhuang? (particulate matter (PM2.5) dust)
Today's PM2.5 level is:
35 (Unhealthy for Sensitive Groups)
For comparison, the highest level of PM2.5 in Nanliugezhuang in the last 7 days was: 56 (Friday, May 27, 2022) and the lowest: 56 (Friday, May 27, 2022).
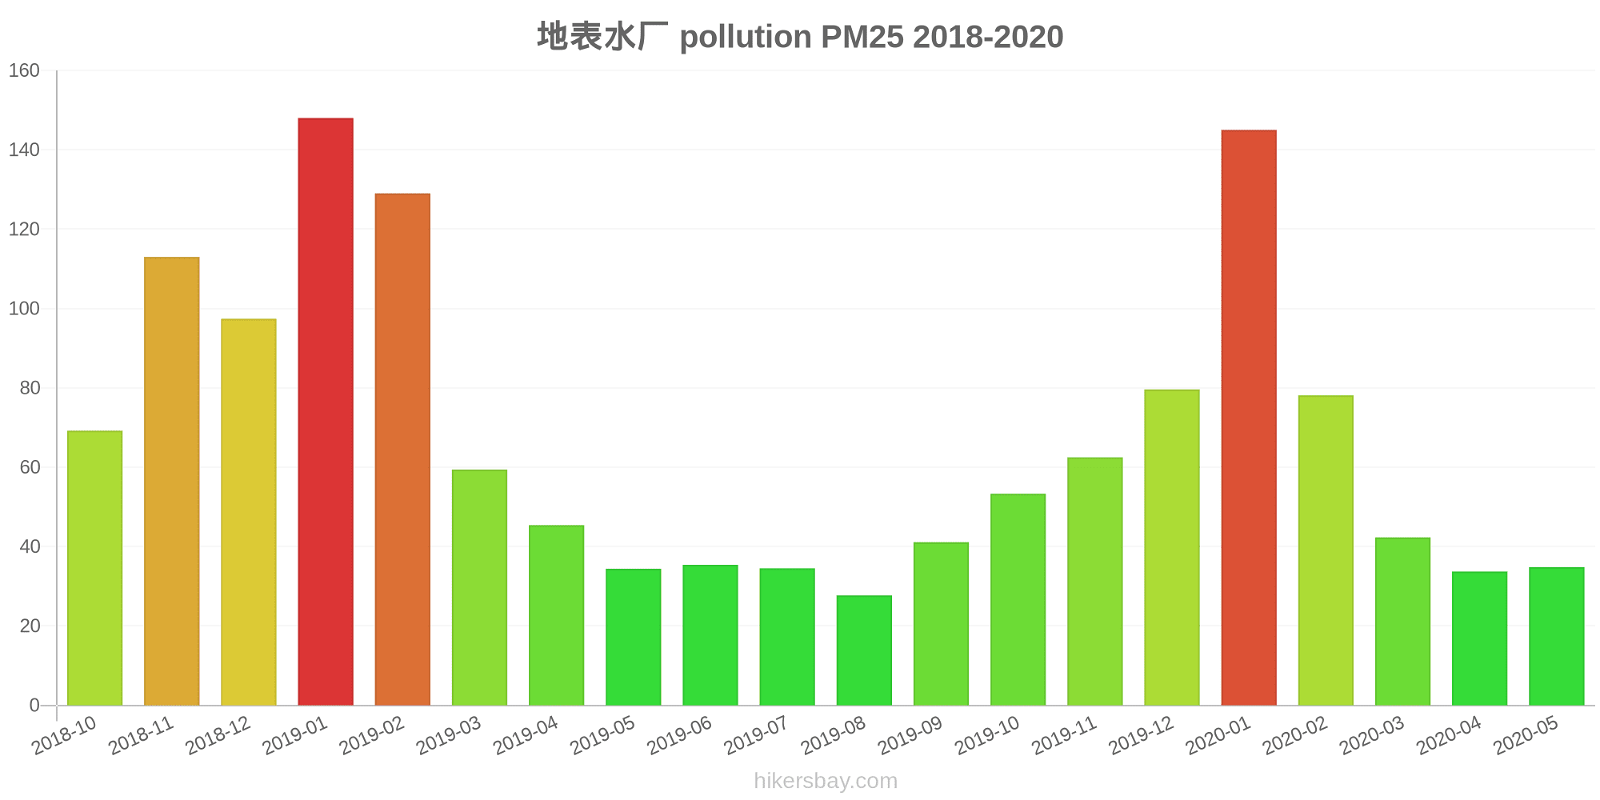
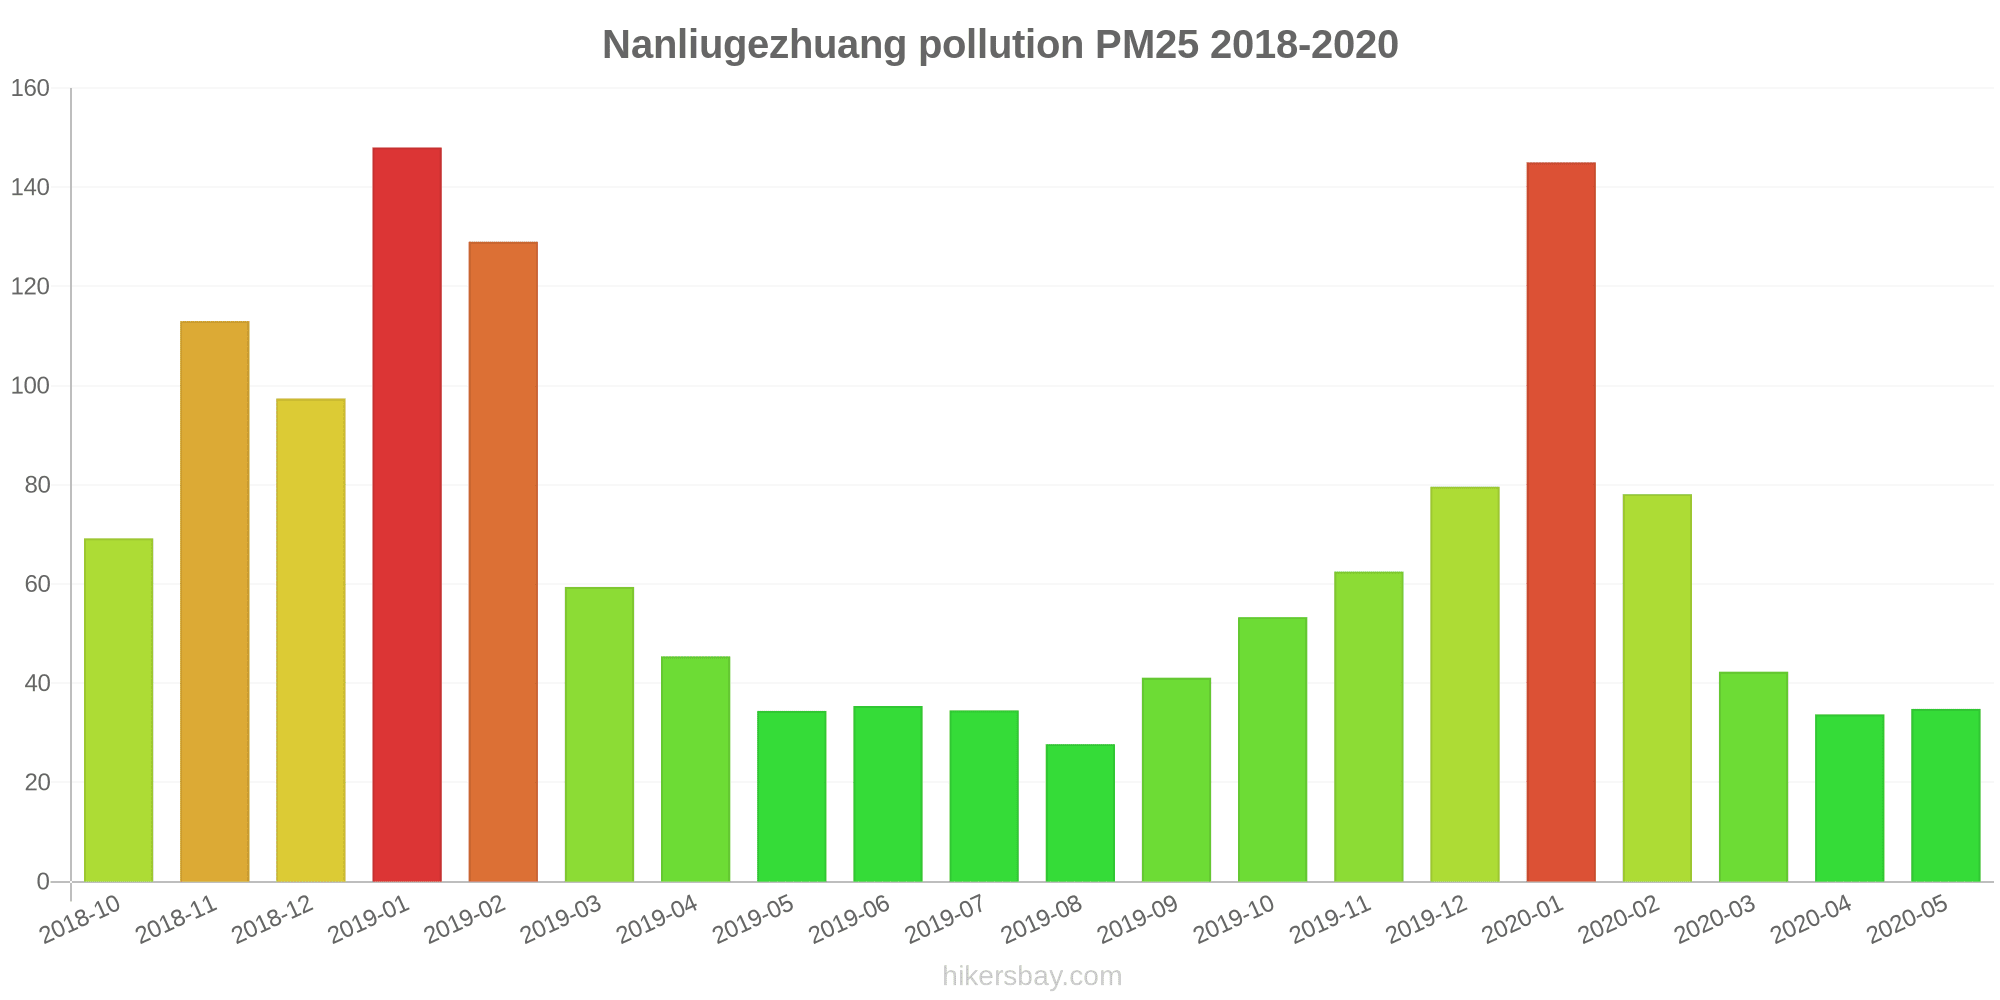
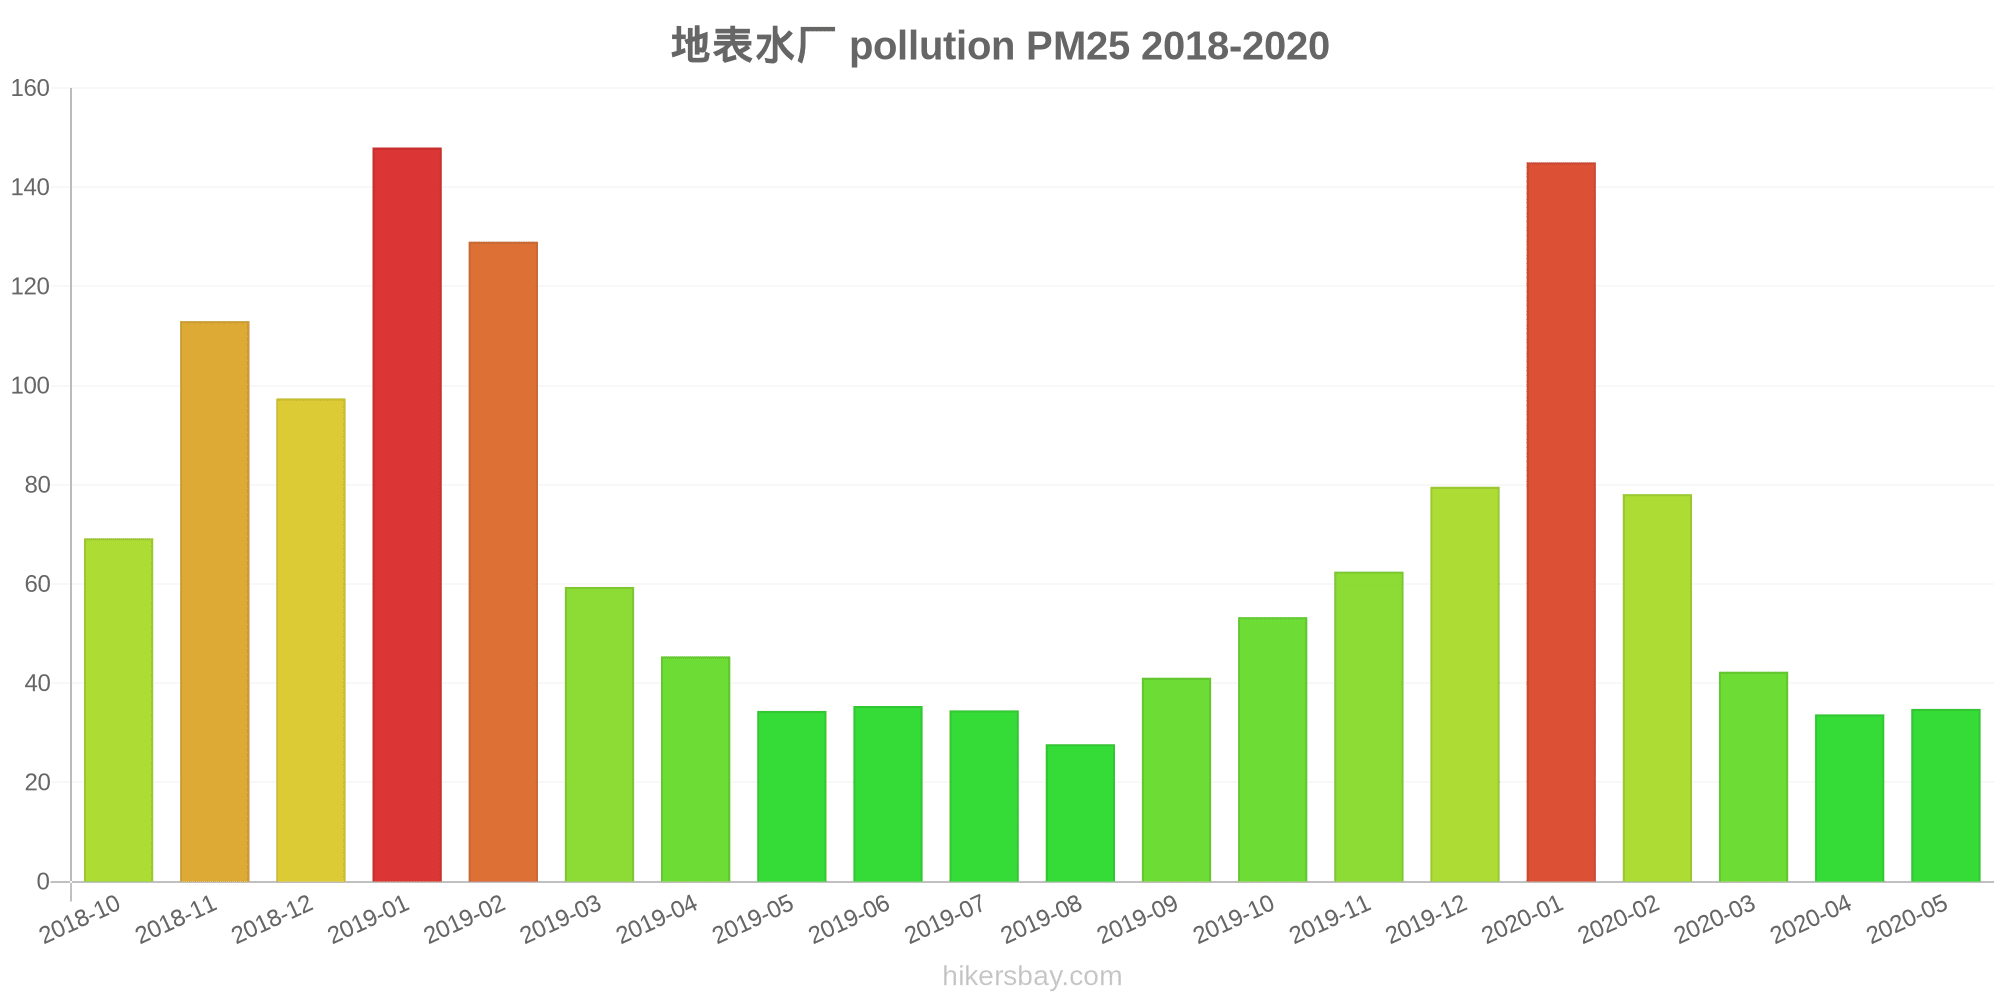
The highest PM2.5 values were recorded: 148 (January 2019).
The lowest level of particulate matter PM2.5 pollution occurs in month: August (28).
How is the O3 level today in Nanliugezhuang? (ozone (O3))
0 (Good)
How high is the level of NO2? (nitrogen dioxide (NO2))
0 (Good)
What is the level of SO2 pollution? (sulfur dioxide (SO2))
0 (Good)
Current data Friday, May 27, 2022, 12:00 PM
PM10 179 (Very bad Hazardous)
PM2,5 35 (Unhealthy for Sensitive Groups)
O3 0 (Good)
NO2 0 (Good)
SO2 0 (Good)
Data on air pollution from recent days in Nanliugezhuang
index
2022-05-27
pm10
56
Unhealthy for Sensitive Groups
pm25
56
Unhealthy
o3
0
Good
no2
0
Good
so2
0
Good
data source »
Air pollution in Nanliugezhuang from October 2018 to May 2020

index
2020-05
2020-04
2020-03
2020-02
2020-01
2019-12
2019-11
2019-10
2019-09
2019-08
2019-07
2019-06
2019-05
2019-04
2019-03
2019-02
2019-01
2018-12
2018-11
2018-10
pm25
35 (Moderate)
34 (Moderate)
42 (Unhealthy for Sensitive Groups)
78 (Very Unhealthy)
145 (Very bad Hazardous)
80 (Very Unhealthy)
63 (Unhealthy)
53 (Unhealthy for Sensitive Groups)
41 (Unhealthy for Sensitive Groups)
28 (Moderate)
35 (Moderate)
35 (Unhealthy for Sensitive Groups)
34 (Moderate)
45 (Unhealthy for Sensitive Groups)
59 (Unhealthy)
129 (Very bad Hazardous)
148 (Very bad Hazardous)
97 (Very Unhealthy)
113 (Very bad Hazardous)
69 (Unhealthy)
co
580 (Good)
498 (Good)
470 (Good)
903 (Good)
1 (Good)
1 (Good)
793 (Good)
695 (Good)
541 (Good)
353 (Good)
500 (Good)
503 (Good)
505 (Good)
514 (Good)
657 (Good)
1 (Good)
2 (Good)
1 (Good)
1 (Good)
867 (Good)
no2
24 (Good)
28 (Good)
38 (Good)
28 (Good)
68 (Moderate)
59 (Moderate)
53 (Moderate)
45 (Moderate)
44 (Moderate)
31 (Good)
26 (Good)
32 (Good)
35 (Good)
36 (Good)
35 (Good)
45 (Moderate)
73 (Moderate)
60 (Moderate)
66 (Moderate)
60 (Moderate)
o3
134 (Unhealthy for Sensitive Groups)
130 (Unhealthy for Sensitive Groups)
99 (Moderate)
87 (Moderate)
60 (Good)
45 (Good)
55 (Good)
99 (Moderate)
179 (Unhealthy)
137 (Unhealthy for Sensitive Groups)
193 (Very Unhealthy)
205 (Very Unhealthy)
180 (Very Unhealthy)
129 (Unhealthy for Sensitive Groups)
113 (Moderate)
80 (Moderate)
43 (Good)
42 (Good)
54 (Good)
93 (Moderate)
pm10
80 (Unhealthy)
82 (Unhealthy)
82 (Unhealthy)
102 (Unhealthy)
192 (Very bad Hazardous)
122 (Very Unhealthy)
121 (Very Unhealthy)
112 (Very Unhealthy)
100 (Unhealthy)
68 (Unhealthy for Sensitive Groups)
75 (Unhealthy for Sensitive Groups)
87 (Unhealthy)
103 (Unhealthy)
110 (Very Unhealthy)
113 (Very Unhealthy)
194 (Very bad Hazardous)
242 (Very bad Hazardous)
176 (Very bad Hazardous)
192 (Very bad Hazardous)
133 (Very Unhealthy)
so2
8.4 (Good)
11 (Good)
10 (Good)
10 (Good)
21 (Good)
15 (Good)
13 (Good)
9.3 (Good)
9.3 (Good)
7.7 (Good)
8.3 (Good)
11 (Good)
13 (Good)
10 (Good)
15 (Good)
22 (Good)
41 (Good)
31 (Good)
22 (Good)
20 (Good)
data source »
地表水厂
Friday, May 27, 2022, 12:00 PM
PM10 179 (Very bad Hazardous)
particulate matter (PM10) suspended dust
PM2,5 35 (Unhealthy for Sensitive Groups)
particulate matter (PM2.5) dust
O3 0.04 (Good)
ozone (O3)
NO2 0 (Good)
nitrogen dioxide (NO2)
SO2 0 (Good)
sulfur dioxide (SO2)
地表水厂
index
2022-05-27
pm10
56
pm25
56
o3
0.03
no2
0
so2
0
地表水厂
2018-10 2020-05
index
2020-05
2020-04
2020-03
2020-02
2020-01
2019-12
2019-11
2019-10
2019-09
2019-08
2019-07
2019-06
2019-05
2019-04
2019-03
2019-02
2019-01
2018-12
2018-11
2018-10
pm25
35
34
42
78
145
80
63
53
41
28
35
35
34
45
59
129
148
97
113
69
co
580
498
470
903
1
1
793
695
541
353
500
503
505
514
657
1
2
1
1
867
no2
24
28
38
28
68
59
53
45
44
31
26
32
35
36
35
45
73
60
66
60
o3
134
130
99
87
60
45
55
99
179
137
193
205
180
129
113
80
43
42
54
93
pm10
80
82
82
102
192
122
121
112
100
68
75
87
103
110
113
194
242
176
192
133
so2
8.4
11
10
10
21
15
13
9.3
9.3
7.7
8.3
11
13
10
15
22
41
31
22
20
* Pollution data source:
https://openaq.org
(ChinaAQIData)
The data is licensed under CC-By 4.0
PM10 179 (Very bad Hazardous)
PM2,5 35 (Unhealthy for Sensitive Groups)
O3 0 (Good)
NO2 0 (Good)
SO2 0 (Good)
Data on air pollution from recent days in Nanliugezhuang
| index | 2022-05-27 |
|---|---|
| pm10 | 56 Unhealthy for Sensitive Groups |
| pm25 | 56 Unhealthy |
| o3 | 0 Good |
| no2 | 0 Good |
| so2 | 0 Good |
| index | 2020-05 | 2020-04 | 2020-03 | 2020-02 | 2020-01 | 2019-12 | 2019-11 | 2019-10 | 2019-09 | 2019-08 | 2019-07 | 2019-06 | 2019-05 | 2019-04 | 2019-03 | 2019-02 | 2019-01 | 2018-12 | 2018-11 | 2018-10 |
|---|---|---|---|---|---|---|---|---|---|---|---|---|---|---|---|---|---|---|---|---|
| pm25 | 35 (Moderate) | 34 (Moderate) | 42 (Unhealthy for Sensitive Groups) | 78 (Very Unhealthy) | 145 (Very bad Hazardous) | 80 (Very Unhealthy) | 63 (Unhealthy) | 53 (Unhealthy for Sensitive Groups) | 41 (Unhealthy for Sensitive Groups) | 28 (Moderate) | 35 (Moderate) | 35 (Unhealthy for Sensitive Groups) | 34 (Moderate) | 45 (Unhealthy for Sensitive Groups) | 59 (Unhealthy) | 129 (Very bad Hazardous) | 148 (Very bad Hazardous) | 97 (Very Unhealthy) | 113 (Very bad Hazardous) | 69 (Unhealthy) |
| co | 580 (Good) | 498 (Good) | 470 (Good) | 903 (Good) | 1 (Good) | 1 (Good) | 793 (Good) | 695 (Good) | 541 (Good) | 353 (Good) | 500 (Good) | 503 (Good) | 505 (Good) | 514 (Good) | 657 (Good) | 1 (Good) | 2 (Good) | 1 (Good) | 1 (Good) | 867 (Good) |
| no2 | 24 (Good) | 28 (Good) | 38 (Good) | 28 (Good) | 68 (Moderate) | 59 (Moderate) | 53 (Moderate) | 45 (Moderate) | 44 (Moderate) | 31 (Good) | 26 (Good) | 32 (Good) | 35 (Good) | 36 (Good) | 35 (Good) | 45 (Moderate) | 73 (Moderate) | 60 (Moderate) | 66 (Moderate) | 60 (Moderate) |
| o3 | 134 (Unhealthy for Sensitive Groups) | 130 (Unhealthy for Sensitive Groups) | 99 (Moderate) | 87 (Moderate) | 60 (Good) | 45 (Good) | 55 (Good) | 99 (Moderate) | 179 (Unhealthy) | 137 (Unhealthy for Sensitive Groups) | 193 (Very Unhealthy) | 205 (Very Unhealthy) | 180 (Very Unhealthy) | 129 (Unhealthy for Sensitive Groups) | 113 (Moderate) | 80 (Moderate) | 43 (Good) | 42 (Good) | 54 (Good) | 93 (Moderate) |
| pm10 | 80 (Unhealthy) | 82 (Unhealthy) | 82 (Unhealthy) | 102 (Unhealthy) | 192 (Very bad Hazardous) | 122 (Very Unhealthy) | 121 (Very Unhealthy) | 112 (Very Unhealthy) | 100 (Unhealthy) | 68 (Unhealthy for Sensitive Groups) | 75 (Unhealthy for Sensitive Groups) | 87 (Unhealthy) | 103 (Unhealthy) | 110 (Very Unhealthy) | 113 (Very Unhealthy) | 194 (Very bad Hazardous) | 242 (Very bad Hazardous) | 176 (Very bad Hazardous) | 192 (Very bad Hazardous) | 133 (Very Unhealthy) |
| so2 | 8.4 (Good) | 11 (Good) | 10 (Good) | 10 (Good) | 21 (Good) | 15 (Good) | 13 (Good) | 9.3 (Good) | 9.3 (Good) | 7.7 (Good) | 8.3 (Good) | 11 (Good) | 13 (Good) | 10 (Good) | 15 (Good) | 22 (Good) | 41 (Good) | 31 (Good) | 22 (Good) | 20 (Good) |
PM10 179 (Very bad Hazardous)
particulate matter (PM10) suspended dustPM2,5 35 (Unhealthy for Sensitive Groups)
particulate matter (PM2.5) dustO3 0.04 (Good)
ozone (O3)NO2 0 (Good)
nitrogen dioxide (NO2)SO2 0 (Good)
sulfur dioxide (SO2)地表水厂
| index | 2022-05-27 |
|---|---|
| pm10 | 56 |
| pm25 | 56 |
| o3 | 0.03 |
| no2 | 0 |
| so2 | 0 |
地表水厂
| index | 2020-05 | 2020-04 | 2020-03 | 2020-02 | 2020-01 | 2019-12 | 2019-11 | 2019-10 | 2019-09 | 2019-08 | 2019-07 | 2019-06 | 2019-05 | 2019-04 | 2019-03 | 2019-02 | 2019-01 | 2018-12 | 2018-11 | 2018-10 |
|---|---|---|---|---|---|---|---|---|---|---|---|---|---|---|---|---|---|---|---|---|
| pm25 | 35 | 34 | 42 | 78 | 145 | 80 | 63 | 53 | 41 | 28 | 35 | 35 | 34 | 45 | 59 | 129 | 148 | 97 | 113 | 69 |
| co | 580 | 498 | 470 | 903 | 1 | 1 | 793 | 695 | 541 | 353 | 500 | 503 | 505 | 514 | 657 | 1 | 2 | 1 | 1 | 867 |
| no2 | 24 | 28 | 38 | 28 | 68 | 59 | 53 | 45 | 44 | 31 | 26 | 32 | 35 | 36 | 35 | 45 | 73 | 60 | 66 | 60 |
| o3 | 134 | 130 | 99 | 87 | 60 | 45 | 55 | 99 | 179 | 137 | 193 | 205 | 180 | 129 | 113 | 80 | 43 | 42 | 54 | 93 |
| pm10 | 80 | 82 | 82 | 102 | 192 | 122 | 121 | 112 | 100 | 68 | 75 | 87 | 103 | 110 | 113 | 194 | 242 | 176 | 192 | 133 |
| so2 | 8.4 | 11 | 10 | 10 | 21 | 15 | 13 | 9.3 | 9.3 | 7.7 | 8.3 | 11 | 13 | 10 | 15 | 22 | 41 | 31 | 22 | 20 |