Air Pollution in Gaomiao: Real-time Air Quality Index and smog alert.
Pollution and air quality forecast for Gaomiao. Today is Tuesday, June 2, 2026. The following air pollution values have been recorded for Gaomiao:- particulate matter (PM10) suspended dust - 179 (Very bad Hazardous)
- particulate matter (PM2.5) dust - 35 (Unhealthy for Sensitive Groups)
- ozone (O3) - 0 (Good)
- nitrogen dioxide (NO2) - 0 (Good)
- sulfur dioxide (SO2) - 0 (Good)

What is the air quality in Gaomiao today? Is the air polluted in Gaomiao?. Is there smog?
What is the level of PM10 today in Gaomiao? (particulate matter (PM10) suspended dust)
The current level of particulate matter PM10 in Gaomiao is:
179 (Very bad Hazardous)
The highest PM10 values usually occur in month: 211 (January 2019).
The lowest value of particulate matter PM10 pollution in Gaomiao is usually recorded in: August (50).
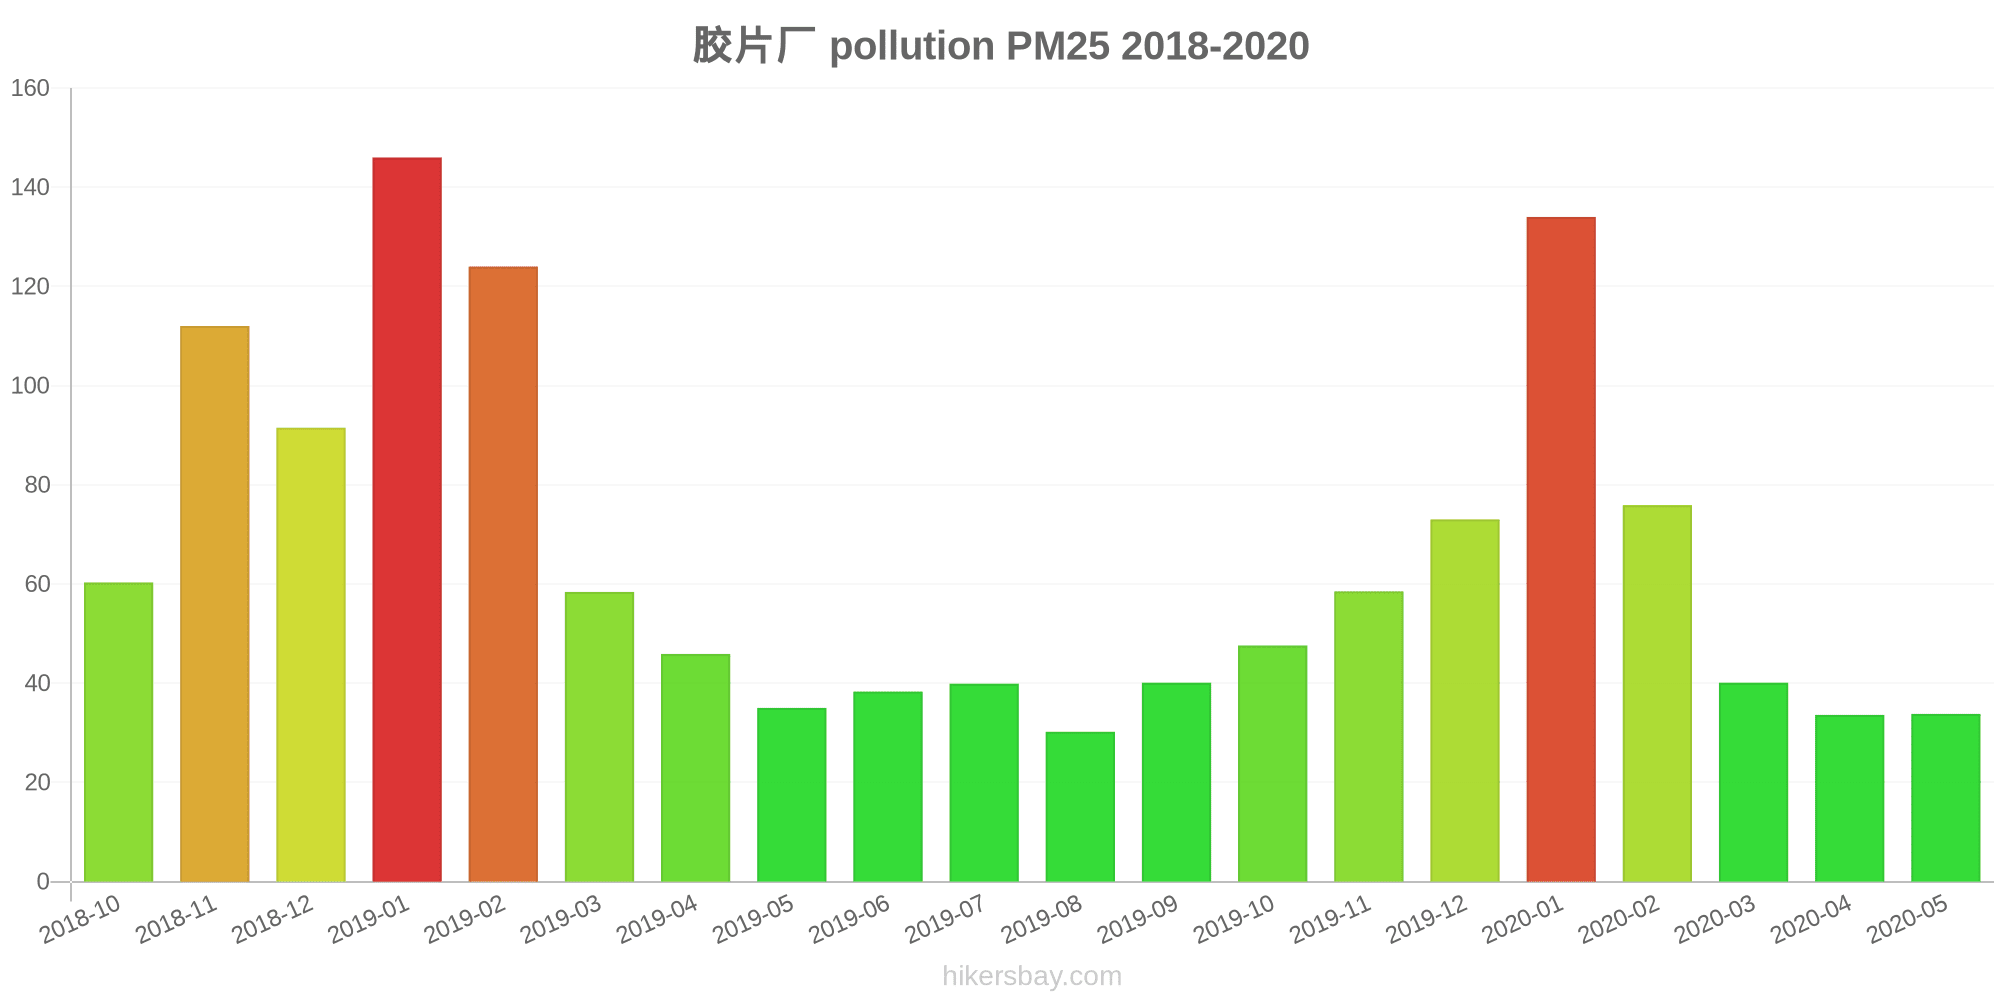
What is the current level of PM2.5 in Gaomiao? (particulate matter (PM2.5) dust)
Today's PM2.5 level is:
35 (Unhealthy for Sensitive Groups)
For comparison, the highest level of PM2.5 in Gaomiao in the last 7 days was: 56 (Friday, May 27, 2022) and the lowest: 56 (Friday, May 27, 2022).
The highest PM2.5 values were recorded: 146 (January 2019).
The lowest level of particulate matter PM2.5 pollution occurs in month: August (30).
How is the O3 level today in Gaomiao? (ozone (O3))
0 (Good)
How high is the level of NO2? (nitrogen dioxide (NO2))
0 (Good)
What is the level of SO2 pollution? (sulfur dioxide (SO2))
0 (Good)
Current data Friday, May 27, 2022, 12:00 PM
PM10 179 (Very bad Hazardous)
PM2,5 35 (Unhealthy for Sensitive Groups)
O3 0 (Good)
NO2 0 (Good)
SO2 0 (Good)
Data on air pollution from recent days in Gaomiao
index
2022-05-27
pm10
56
Unhealthy for Sensitive Groups
pm25
56
Unhealthy
o3
0
Good
no2
0
Good
so2
0
Good
data source »
Air pollution in Gaomiao from October 2018 to May 2020

index
2020-05
2020-04
2020-03
2020-02
2020-01
2019-12
2019-11
2019-10
2019-09
2019-08
2019-07
2019-06
2019-05
2019-04
2019-03
2019-02
2019-01
2018-12
2018-11
2018-10
pm25
34 (Moderate)
34 (Moderate)
40 (Unhealthy for Sensitive Groups)
76 (Very Unhealthy)
134 (Very bad Hazardous)
73 (Unhealthy)
59 (Unhealthy)
48 (Unhealthy for Sensitive Groups)
40 (Unhealthy for Sensitive Groups)
30 (Moderate)
40 (Unhealthy for Sensitive Groups)
38 (Unhealthy for Sensitive Groups)
35 (Unhealthy for Sensitive Groups)
46 (Unhealthy for Sensitive Groups)
58 (Unhealthy)
124 (Very bad Hazardous)
146 (Very bad Hazardous)
92 (Very Unhealthy)
112 (Very bad Hazardous)
60 (Unhealthy)
co
673 (Good)
532 (Good)
598 (Good)
1 (Good)
2 (Good)
1 (Good)
967 (Good)
713 (Good)
678 (Good)
454 (Good)
498 (Good)
390 (Good)
308 (Good)
456 (Good)
653 (Good)
1 (Good)
2 (Good)
1 (Good)
1 (Good)
857 (Good)
no2
23 (Good)
28 (Good)
31 (Good)
26 (Good)
61 (Moderate)
54 (Moderate)
57 (Moderate)
45 (Moderate)
33 (Good)
22 (Good)
18 (Good)
23 (Good)
25 (Good)
28 (Good)
34 (Good)
41 (Moderate)
72 (Moderate)
59 (Moderate)
71 (Moderate)
58 (Moderate)
o3
144 (Unhealthy for Sensitive Groups)
143 (Unhealthy for Sensitive Groups)
105 (Moderate)
89 (Moderate)
64 (Good)
48 (Good)
57 (Good)
96 (Moderate)
186 (Very Unhealthy)
159 (Unhealthy)
211 (Very Unhealthy)
225 (Very Unhealthy)
189 (Very Unhealthy)
135 (Unhealthy for Sensitive Groups)
116 (Moderate)
91 (Moderate)
51 (Good)
51 (Good)
61 (Good)
97 (Moderate)
pm10
69 (Unhealthy for Sensitive Groups)
73 (Unhealthy for Sensitive Groups)
74 (Unhealthy for Sensitive Groups)
99 (Unhealthy)
182 (Very bad Hazardous)
117 (Very Unhealthy)
111 (Very Unhealthy)
91 (Unhealthy)
74 (Unhealthy for Sensitive Groups)
50 (Moderate)
58 (Unhealthy for Sensitive Groups)
70 (Unhealthy for Sensitive Groups)
82 (Unhealthy)
98 (Unhealthy)
102 (Unhealthy)
175 (Very bad Hazardous)
211 (Very bad Hazardous)
157 (Very bad Hazardous)
180 (Very bad Hazardous)
116 (Very Unhealthy)
so2
8 (Good)
12 (Good)
9.4 (Good)
7.8 (Good)
16 (Good)
15 (Good)
14 (Good)
10 (Good)
9.9 (Good)
7.7 (Good)
12 (Good)
16 (Good)
16 (Good)
13 (Good)
16 (Good)
18 (Good)
36 (Good)
27 (Good)
18 (Good)
18 (Good)
data source »
Quality of life in Gaomiao
Green and Parks in the City
Gaomiao
75%
Mongolia: 27%
Bhutan: 82%
Hong Kong: 52%
Myanmar: 33%
particulate matter PM2.5
Gaomiao
93 (Very Unhealthy)
Pleasure of spending time in the city
Gaomiao
45%
Mongolia: 22%
Bhutan: 61%
Hong Kong: 43%
Myanmar: 24%
particulate matter PM10
Gaomiao
150 (Very Unhealthy)
Air Pollution
Gaomiao
64%
Mongolia: 87%
Bhutan: 45%
Hong Kong: 67%
Myanmar: 83%
Garbage Disposal
Gaomiao
83%
Mongolia: 27%
Bhutan: 47%
Hong Kong: 52%
Myanmar: 12%
Availability and quality of drinking water
Gaomiao
67%
Mongolia: 46%
Bhutan: 64%
Hong Kong: 66%
Myanmar: 34%
Cleanliness and tidiness
Gaomiao
83%
Mongolia: 29%
Bhutan: 57%
Hong Kong: 54%
Myanmar: 18%
Noise and Light pollution
Gaomiao
0%
Mongolia: 48%
Bhutan: 55%
Hong Kong: 66%
Myanmar: 52%
Water Pollution
Gaomiao
33%
Mongolia: 68%
Bhutan: 56%
Hong Kong: 53%
Myanmar: 74%
Source: Numbeo
胶片厂
Friday, May 27, 2022, 12:00 PM
PM10 179 (Very bad Hazardous)
particulate matter (PM10) suspended dust
PM2,5 35 (Unhealthy for Sensitive Groups)
particulate matter (PM2.5) dust
O3 0.04 (Good)
ozone (O3)
NO2 0 (Good)
nitrogen dioxide (NO2)
SO2 0 (Good)
sulfur dioxide (SO2)
胶片厂
index
2022-05-27
pm10
56
pm25
56
o3
0.03
no2
0
so2
0
胶片厂
2018-10 2020-05

index
2020-05
2020-04
2020-03
2020-02
2020-01
2019-12
2019-11
2019-10
2019-09
2019-08
2019-07
2019-06
2019-05
2019-04
2019-03
2019-02
2019-01
2018-12
2018-11
2018-10
pm25
34
34
40
76
134
73
59
48
40
30
40
38
35
46
58
124
146
92
112
60
co
673
532
598
1
2
1
967
713
678
454
498
390
308
456
653
1
2
1
1
857
no2
23
28
31
26
61
54
57
45
33
22
18
23
25
28
34
41
72
59
71
58
o3
144
143
105
89
64
48
57
96
186
159
211
225
189
135
116
91
51
51
61
97
pm10
69
73
74
99
182
117
111
91
74
50
58
70
82
98
102
175
211
157
180
116
so2
8
12
9.4
7.8
16
15
14
10
9.9
7.7
12
16
16
13
16
18
36
27
18
18
* Pollution data source:
https://openaq.org
(ChinaAQIData)
The data is licensed under CC-By 4.0
PM10 179 (Very bad Hazardous)
PM2,5 35 (Unhealthy for Sensitive Groups)
O3 0 (Good)
NO2 0 (Good)
SO2 0 (Good)
Data on air pollution from recent days in Gaomiao
| index | 2022-05-27 |
|---|---|
| pm10 | 56 Unhealthy for Sensitive Groups |
| pm25 | 56 Unhealthy |
| o3 | 0 Good |
| no2 | 0 Good |
| so2 | 0 Good |

| index | 2020-05 | 2020-04 | 2020-03 | 2020-02 | 2020-01 | 2019-12 | 2019-11 | 2019-10 | 2019-09 | 2019-08 | 2019-07 | 2019-06 | 2019-05 | 2019-04 | 2019-03 | 2019-02 | 2019-01 | 2018-12 | 2018-11 | 2018-10 |
|---|---|---|---|---|---|---|---|---|---|---|---|---|---|---|---|---|---|---|---|---|
| pm25 | 34 (Moderate) | 34 (Moderate) | 40 (Unhealthy for Sensitive Groups) | 76 (Very Unhealthy) | 134 (Very bad Hazardous) | 73 (Unhealthy) | 59 (Unhealthy) | 48 (Unhealthy for Sensitive Groups) | 40 (Unhealthy for Sensitive Groups) | 30 (Moderate) | 40 (Unhealthy for Sensitive Groups) | 38 (Unhealthy for Sensitive Groups) | 35 (Unhealthy for Sensitive Groups) | 46 (Unhealthy for Sensitive Groups) | 58 (Unhealthy) | 124 (Very bad Hazardous) | 146 (Very bad Hazardous) | 92 (Very Unhealthy) | 112 (Very bad Hazardous) | 60 (Unhealthy) |
| co | 673 (Good) | 532 (Good) | 598 (Good) | 1 (Good) | 2 (Good) | 1 (Good) | 967 (Good) | 713 (Good) | 678 (Good) | 454 (Good) | 498 (Good) | 390 (Good) | 308 (Good) | 456 (Good) | 653 (Good) | 1 (Good) | 2 (Good) | 1 (Good) | 1 (Good) | 857 (Good) |
| no2 | 23 (Good) | 28 (Good) | 31 (Good) | 26 (Good) | 61 (Moderate) | 54 (Moderate) | 57 (Moderate) | 45 (Moderate) | 33 (Good) | 22 (Good) | 18 (Good) | 23 (Good) | 25 (Good) | 28 (Good) | 34 (Good) | 41 (Moderate) | 72 (Moderate) | 59 (Moderate) | 71 (Moderate) | 58 (Moderate) |
| o3 | 144 (Unhealthy for Sensitive Groups) | 143 (Unhealthy for Sensitive Groups) | 105 (Moderate) | 89 (Moderate) | 64 (Good) | 48 (Good) | 57 (Good) | 96 (Moderate) | 186 (Very Unhealthy) | 159 (Unhealthy) | 211 (Very Unhealthy) | 225 (Very Unhealthy) | 189 (Very Unhealthy) | 135 (Unhealthy for Sensitive Groups) | 116 (Moderate) | 91 (Moderate) | 51 (Good) | 51 (Good) | 61 (Good) | 97 (Moderate) |
| pm10 | 69 (Unhealthy for Sensitive Groups) | 73 (Unhealthy for Sensitive Groups) | 74 (Unhealthy for Sensitive Groups) | 99 (Unhealthy) | 182 (Very bad Hazardous) | 117 (Very Unhealthy) | 111 (Very Unhealthy) | 91 (Unhealthy) | 74 (Unhealthy for Sensitive Groups) | 50 (Moderate) | 58 (Unhealthy for Sensitive Groups) | 70 (Unhealthy for Sensitive Groups) | 82 (Unhealthy) | 98 (Unhealthy) | 102 (Unhealthy) | 175 (Very bad Hazardous) | 211 (Very bad Hazardous) | 157 (Very bad Hazardous) | 180 (Very bad Hazardous) | 116 (Very Unhealthy) |
| so2 | 8 (Good) | 12 (Good) | 9.4 (Good) | 7.8 (Good) | 16 (Good) | 15 (Good) | 14 (Good) | 10 (Good) | 9.9 (Good) | 7.7 (Good) | 12 (Good) | 16 (Good) | 16 (Good) | 13 (Good) | 16 (Good) | 18 (Good) | 36 (Good) | 27 (Good) | 18 (Good) | 18 (Good) |
Green and Parks in the City
Gaomiao 75%
Mongolia: 27% Bhutan: 82% Hong Kong: 52% Myanmar: 33%particulate matter PM2.5
Gaomiao 93 (Very Unhealthy)
Pleasure of spending time in the city
Gaomiao 45%
Mongolia: 22% Bhutan: 61% Hong Kong: 43% Myanmar: 24%particulate matter PM10
Gaomiao 150 (Very Unhealthy)
Air Pollution
Gaomiao 64%
Mongolia: 87% Bhutan: 45% Hong Kong: 67% Myanmar: 83%Garbage Disposal
Gaomiao 83%
Mongolia: 27% Bhutan: 47% Hong Kong: 52% Myanmar: 12%Availability and quality of drinking water
Gaomiao 67%
Mongolia: 46% Bhutan: 64% Hong Kong: 66% Myanmar: 34%Cleanliness and tidiness
Gaomiao 83%
Mongolia: 29% Bhutan: 57% Hong Kong: 54% Myanmar: 18%Noise and Light pollution
Gaomiao 0%
Mongolia: 48% Bhutan: 55% Hong Kong: 66% Myanmar: 52%Water Pollution
Gaomiao 33%
Mongolia: 68% Bhutan: 56% Hong Kong: 53% Myanmar: 74%PM10 179 (Very bad Hazardous)
particulate matter (PM10) suspended dustPM2,5 35 (Unhealthy for Sensitive Groups)
particulate matter (PM2.5) dustO3 0.04 (Good)
ozone (O3)NO2 0 (Good)
nitrogen dioxide (NO2)SO2 0 (Good)
sulfur dioxide (SO2)胶片厂
| index | 2022-05-27 |
|---|---|
| pm10 | 56 |
| pm25 | 56 |
| o3 | 0.03 |
| no2 | 0 |
| so2 | 0 |
胶片厂
| index | 2020-05 | 2020-04 | 2020-03 | 2020-02 | 2020-01 | 2019-12 | 2019-11 | 2019-10 | 2019-09 | 2019-08 | 2019-07 | 2019-06 | 2019-05 | 2019-04 | 2019-03 | 2019-02 | 2019-01 | 2018-12 | 2018-11 | 2018-10 |
|---|---|---|---|---|---|---|---|---|---|---|---|---|---|---|---|---|---|---|---|---|
| pm25 | 34 | 34 | 40 | 76 | 134 | 73 | 59 | 48 | 40 | 30 | 40 | 38 | 35 | 46 | 58 | 124 | 146 | 92 | 112 | 60 |
| co | 673 | 532 | 598 | 1 | 2 | 1 | 967 | 713 | 678 | 454 | 498 | 390 | 308 | 456 | 653 | 1 | 2 | 1 | 1 | 857 |
| no2 | 23 | 28 | 31 | 26 | 61 | 54 | 57 | 45 | 33 | 22 | 18 | 23 | 25 | 28 | 34 | 41 | 72 | 59 | 71 | 58 |
| o3 | 144 | 143 | 105 | 89 | 64 | 48 | 57 | 96 | 186 | 159 | 211 | 225 | 189 | 135 | 116 | 91 | 51 | 51 | 61 | 97 |
| pm10 | 69 | 73 | 74 | 99 | 182 | 117 | 111 | 91 | 74 | 50 | 58 | 70 | 82 | 98 | 102 | 175 | 211 | 157 | 180 | 116 |
| so2 | 8 | 12 | 9.4 | 7.8 | 16 | 15 | 14 | 10 | 9.9 | 7.7 | 12 | 16 | 16 | 13 | 16 | 18 | 36 | 27 | 18 | 18 |