Air Pollution in Huazhuang: Real-time Air Quality Index and smog alert.
Pollution and air quality forecast for Huazhuang. Today is Tuesday, June 2, 2026. The following air pollution values have been recorded for Huazhuang:- particulate matter (PM10) suspended dust - 179 (Very bad Hazardous)
- particulate matter (PM2.5) dust - 35 (Unhealthy for Sensitive Groups)
- ozone (O3) - 0 (Good)
- nitrogen dioxide (NO2) - 0 (Good)
- sulfur dioxide (SO2) - 0 (Good)

What is the air quality in Huazhuang today? Is the air polluted in Huazhuang?. Is there smog?
What is the level of PM10 today in Huazhuang? (particulate matter (PM10) suspended dust)
The current level of particulate matter PM10 in Huazhuang is:
179 (Very bad Hazardous)
The highest PM10 values usually occur in month: 210 (January 2019).
The lowest value of particulate matter PM10 pollution in Huazhuang is usually recorded in: August (47).
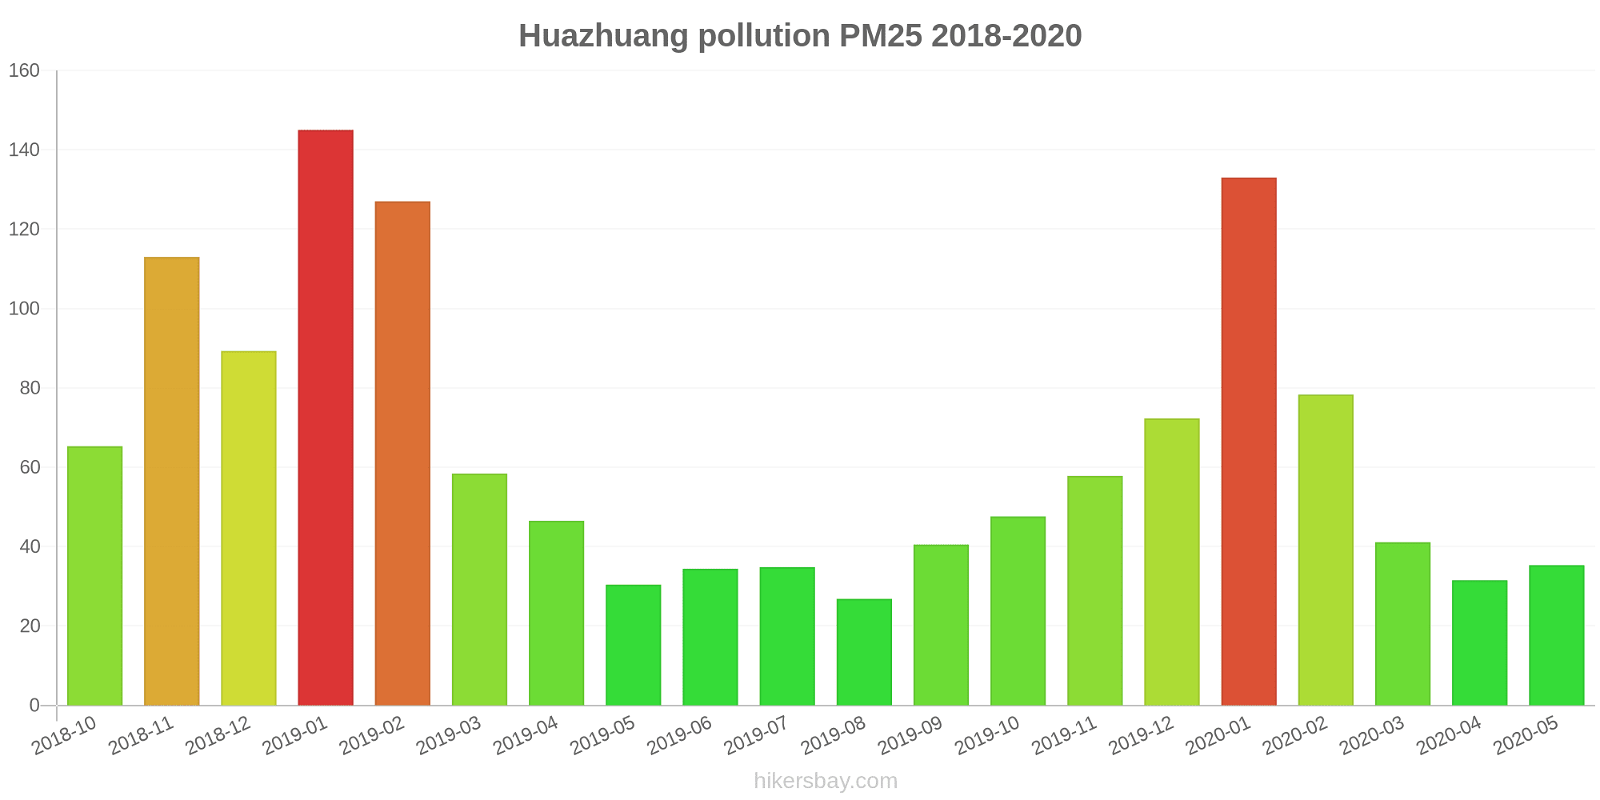
What is the current level of PM2.5 in Huazhuang? (particulate matter (PM2.5) dust)
Today's PM2.5 level is:
35 (Unhealthy for Sensitive Groups)
For comparison, the highest level of PM2.5 in Huazhuang in the last 7 days was: 56 (Friday, May 27, 2022) and the lowest: 56 (Friday, May 27, 2022).
The highest PM2.5 values were recorded: 145 (January 2019).
The lowest level of particulate matter PM2.5 pollution occurs in month: August (27).
How is the O3 level today in Huazhuang? (ozone (O3))
0 (Good)
How high is the level of NO2? (nitrogen dioxide (NO2))
0 (Good)
What is the level of SO2 pollution? (sulfur dioxide (SO2))
0 (Good)
Current data Friday, May 27, 2022, 12:00 PM
PM10 179 (Very bad Hazardous)
PM2,5 35 (Unhealthy for Sensitive Groups)
O3 0 (Good)
NO2 0 (Good)
SO2 0 (Good)
Data on air pollution from recent days in Huazhuang
index
2022-05-27
pm10
56
Unhealthy for Sensitive Groups
pm25
56
Unhealthy
o3
0
Good
no2
0
Good
so2
0
Good
data source »
Air pollution in Huazhuang from October 2018 to May 2020
index
2020-05
2020-04
2020-03
2020-02
2020-01
2019-12
2019-11
2019-10
2019-09
2019-08
2019-07
2019-06
2019-05
2019-04
2019-03
2019-02
2019-01
2018-12
2018-11
2018-10
pm25
35 (Unhealthy for Sensitive Groups)
32 (Moderate)
41 (Unhealthy for Sensitive Groups)
78 (Very Unhealthy)
133 (Very bad Hazardous)
72 (Unhealthy)
58 (Unhealthy)
48 (Unhealthy for Sensitive Groups)
41 (Unhealthy for Sensitive Groups)
27 (Moderate)
35 (Moderate)
34 (Moderate)
30 (Moderate)
47 (Unhealthy for Sensitive Groups)
58 (Unhealthy)
127 (Very bad Hazardous)
145 (Very bad Hazardous)
89 (Very Unhealthy)
113 (Very bad Hazardous)
65 (Unhealthy)
co
530 (Good)
524 (Good)
632 (Good)
1 (Good)
1 (Good)
1 (Good)
779 (Good)
693 (Good)
615 (Good)
465 (Good)
528 (Good)
508 (Good)
432 (Good)
744 (Good)
759 (Good)
1 (Good)
2 (Good)
1 (Good)
1 (Good)
745 (Good)
no2
23 (Good)
28 (Good)
30 (Good)
26 (Good)
53 (Moderate)
57 (Moderate)
54 (Moderate)
49 (Moderate)
36 (Good)
24 (Good)
23 (Good)
26 (Good)
28 (Good)
30 (Good)
34 (Good)
47 (Moderate)
70 (Moderate)
62 (Moderate)
68 (Moderate)
56 (Moderate)
o3
133 (Unhealthy for Sensitive Groups)
138 (Unhealthy for Sensitive Groups)
99 (Moderate)
84 (Moderate)
60 (Good)
44 (Good)
54 (Good)
96 (Moderate)
188 (Very Unhealthy)
149 (Unhealthy for Sensitive Groups)
200 (Very Unhealthy)
217 (Very Unhealthy)
180 (Very Unhealthy)
131 (Unhealthy for Sensitive Groups)
114 (Moderate)
88 (Moderate)
45 (Good)
46 (Good)
59 (Good)
93 (Moderate)
pm10
75 (Unhealthy for Sensitive Groups)
75 (Unhealthy for Sensitive Groups)
74 (Unhealthy for Sensitive Groups)
101 (Unhealthy)
177 (Very bad Hazardous)
120 (Very Unhealthy)
118 (Very Unhealthy)
93 (Unhealthy)
79 (Unhealthy for Sensitive Groups)
47 (Moderate)
63 (Unhealthy for Sensitive Groups)
72 (Unhealthy for Sensitive Groups)
84 (Unhealthy)
101 (Unhealthy)
102 (Unhealthy)
172 (Very bad Hazardous)
210 (Very bad Hazardous)
153 (Very bad Hazardous)
181 (Very bad Hazardous)
118 (Very Unhealthy)
so2
8.9 (Good)
11 (Good)
10 (Good)
10 (Good)
20 (Good)
13 (Good)
11 (Good)
7.8 (Good)
8.4 (Good)
5.3 (Good)
5.7 (Good)
8.3 (Good)
10 (Good)
8.6 (Good)
11 (Good)
15 (Good)
31 (Good)
25 (Good)
21 (Good)
15 (Good)
data source »
接待中心
Friday, May 27, 2022, 12:00 PM
PM10 179 (Very bad Hazardous)
particulate matter (PM10) suspended dust
PM2,5 35 (Unhealthy for Sensitive Groups)
particulate matter (PM2.5) dust
O3 0.04 (Good)
ozone (O3)
NO2 0 (Good)
nitrogen dioxide (NO2)
SO2 0 (Good)
sulfur dioxide (SO2)
接待中心
index
2022-05-27
pm10
56
pm25
56
o3
0.03
no2
0
so2
0
接待中心
2018-10 2020-05

index
2020-05
2020-04
2020-03
2020-02
2020-01
2019-12
2019-11
2019-10
2019-09
2019-08
2019-07
2019-06
2019-05
2019-04
2019-03
2019-02
2019-01
2018-12
2018-11
2018-10
pm25
35
32
41
78
133
72
58
48
41
27
35
34
30
47
58
127
145
89
113
65
co
530
524
632
1
1
1
779
693
615
465
528
508
432
744
759
1
2
1
1
745
no2
23
28
30
26
53
57
54
49
36
24
23
26
28
30
34
47
70
62
68
56
o3
133
138
99
84
60
44
54
96
188
149
200
217
180
131
114
88
45
46
59
93
pm10
75
75
74
101
177
120
118
93
79
47
63
72
84
101
102
172
210
153
181
118
so2
8.9
11
10
10
20
13
11
7.8
8.4
5.3
5.7
8.3
10
8.6
11
15
31
25
21
15
* Pollution data source:
https://openaq.org
(ChinaAQIData)
The data is licensed under CC-By 4.0
PM10 179 (Very bad Hazardous)
PM2,5 35 (Unhealthy for Sensitive Groups)
O3 0 (Good)
NO2 0 (Good)
SO2 0 (Good)
Data on air pollution from recent days in Huazhuang
| index | 2022-05-27 |
|---|---|
| pm10 | 56 Unhealthy for Sensitive Groups |
| pm25 | 56 Unhealthy |
| o3 | 0 Good |
| no2 | 0 Good |
| so2 | 0 Good |

| index | 2020-05 | 2020-04 | 2020-03 | 2020-02 | 2020-01 | 2019-12 | 2019-11 | 2019-10 | 2019-09 | 2019-08 | 2019-07 | 2019-06 | 2019-05 | 2019-04 | 2019-03 | 2019-02 | 2019-01 | 2018-12 | 2018-11 | 2018-10 |
|---|---|---|---|---|---|---|---|---|---|---|---|---|---|---|---|---|---|---|---|---|
| pm25 | 35 (Unhealthy for Sensitive Groups) | 32 (Moderate) | 41 (Unhealthy for Sensitive Groups) | 78 (Very Unhealthy) | 133 (Very bad Hazardous) | 72 (Unhealthy) | 58 (Unhealthy) | 48 (Unhealthy for Sensitive Groups) | 41 (Unhealthy for Sensitive Groups) | 27 (Moderate) | 35 (Moderate) | 34 (Moderate) | 30 (Moderate) | 47 (Unhealthy for Sensitive Groups) | 58 (Unhealthy) | 127 (Very bad Hazardous) | 145 (Very bad Hazardous) | 89 (Very Unhealthy) | 113 (Very bad Hazardous) | 65 (Unhealthy) |
| co | 530 (Good) | 524 (Good) | 632 (Good) | 1 (Good) | 1 (Good) | 1 (Good) | 779 (Good) | 693 (Good) | 615 (Good) | 465 (Good) | 528 (Good) | 508 (Good) | 432 (Good) | 744 (Good) | 759 (Good) | 1 (Good) | 2 (Good) | 1 (Good) | 1 (Good) | 745 (Good) |
| no2 | 23 (Good) | 28 (Good) | 30 (Good) | 26 (Good) | 53 (Moderate) | 57 (Moderate) | 54 (Moderate) | 49 (Moderate) | 36 (Good) | 24 (Good) | 23 (Good) | 26 (Good) | 28 (Good) | 30 (Good) | 34 (Good) | 47 (Moderate) | 70 (Moderate) | 62 (Moderate) | 68 (Moderate) | 56 (Moderate) |
| o3 | 133 (Unhealthy for Sensitive Groups) | 138 (Unhealthy for Sensitive Groups) | 99 (Moderate) | 84 (Moderate) | 60 (Good) | 44 (Good) | 54 (Good) | 96 (Moderate) | 188 (Very Unhealthy) | 149 (Unhealthy for Sensitive Groups) | 200 (Very Unhealthy) | 217 (Very Unhealthy) | 180 (Very Unhealthy) | 131 (Unhealthy for Sensitive Groups) | 114 (Moderate) | 88 (Moderate) | 45 (Good) | 46 (Good) | 59 (Good) | 93 (Moderate) |
| pm10 | 75 (Unhealthy for Sensitive Groups) | 75 (Unhealthy for Sensitive Groups) | 74 (Unhealthy for Sensitive Groups) | 101 (Unhealthy) | 177 (Very bad Hazardous) | 120 (Very Unhealthy) | 118 (Very Unhealthy) | 93 (Unhealthy) | 79 (Unhealthy for Sensitive Groups) | 47 (Moderate) | 63 (Unhealthy for Sensitive Groups) | 72 (Unhealthy for Sensitive Groups) | 84 (Unhealthy) | 101 (Unhealthy) | 102 (Unhealthy) | 172 (Very bad Hazardous) | 210 (Very bad Hazardous) | 153 (Very bad Hazardous) | 181 (Very bad Hazardous) | 118 (Very Unhealthy) |
| so2 | 8.9 (Good) | 11 (Good) | 10 (Good) | 10 (Good) | 20 (Good) | 13 (Good) | 11 (Good) | 7.8 (Good) | 8.4 (Good) | 5.3 (Good) | 5.7 (Good) | 8.3 (Good) | 10 (Good) | 8.6 (Good) | 11 (Good) | 15 (Good) | 31 (Good) | 25 (Good) | 21 (Good) | 15 (Good) |
PM10 179 (Very bad Hazardous)
particulate matter (PM10) suspended dustPM2,5 35 (Unhealthy for Sensitive Groups)
particulate matter (PM2.5) dustO3 0.04 (Good)
ozone (O3)NO2 0 (Good)
nitrogen dioxide (NO2)SO2 0 (Good)
sulfur dioxide (SO2)接待中心
| index | 2022-05-27 |
|---|---|
| pm10 | 56 |
| pm25 | 56 |
| o3 | 0.03 |
| no2 | 0 |
| so2 | 0 |
接待中心

| index | 2020-05 | 2020-04 | 2020-03 | 2020-02 | 2020-01 | 2019-12 | 2019-11 | 2019-10 | 2019-09 | 2019-08 | 2019-07 | 2019-06 | 2019-05 | 2019-04 | 2019-03 | 2019-02 | 2019-01 | 2018-12 | 2018-11 | 2018-10 |
|---|---|---|---|---|---|---|---|---|---|---|---|---|---|---|---|---|---|---|---|---|
| pm25 | 35 | 32 | 41 | 78 | 133 | 72 | 58 | 48 | 41 | 27 | 35 | 34 | 30 | 47 | 58 | 127 | 145 | 89 | 113 | 65 |
| co | 530 | 524 | 632 | 1 | 1 | 1 | 779 | 693 | 615 | 465 | 528 | 508 | 432 | 744 | 759 | 1 | 2 | 1 | 1 | 745 |
| no2 | 23 | 28 | 30 | 26 | 53 | 57 | 54 | 49 | 36 | 24 | 23 | 26 | 28 | 30 | 34 | 47 | 70 | 62 | 68 | 56 |
| o3 | 133 | 138 | 99 | 84 | 60 | 44 | 54 | 96 | 188 | 149 | 200 | 217 | 180 | 131 | 114 | 88 | 45 | 46 | 59 | 93 |
| pm10 | 75 | 75 | 74 | 101 | 177 | 120 | 118 | 93 | 79 | 47 | 63 | 72 | 84 | 101 | 102 | 172 | 210 | 153 | 181 | 118 |
| so2 | 8.9 | 11 | 10 | 10 | 20 | 13 | 11 | 7.8 | 8.4 | 5.3 | 5.7 | 8.3 | 10 | 8.6 | 11 | 15 | 31 | 25 | 21 | 15 |