Air Pollution in Liulinqiao: Real-time Air Quality Index and smog alert.
Pollution and air quality forecast for Liulinqiao. Today is Tuesday, June 2, 2026. The following air pollution values have been recorded for Liulinqiao:- particulate matter (PM10) suspended dust - 179 (Very bad Hazardous)
- particulate matter (PM2.5) dust - 35 (Unhealthy for Sensitive Groups)
- ozone (O3) - 0 (Good)
- nitrogen dioxide (NO2) - 0 (Good)
- sulfur dioxide (SO2) - 0 (Good)

What is the air quality in Liulinqiao today? Is the air polluted in Liulinqiao?. Is there smog?
What is the level of PM10 today in Liulinqiao? (particulate matter (PM10) suspended dust)
The current level of particulate matter PM10 in Liulinqiao is:
179 (Very bad Hazardous)
The highest PM10 values usually occur in month: 223 (January 2019).
The lowest value of particulate matter PM10 pollution in Liulinqiao is usually recorded in: August (66).
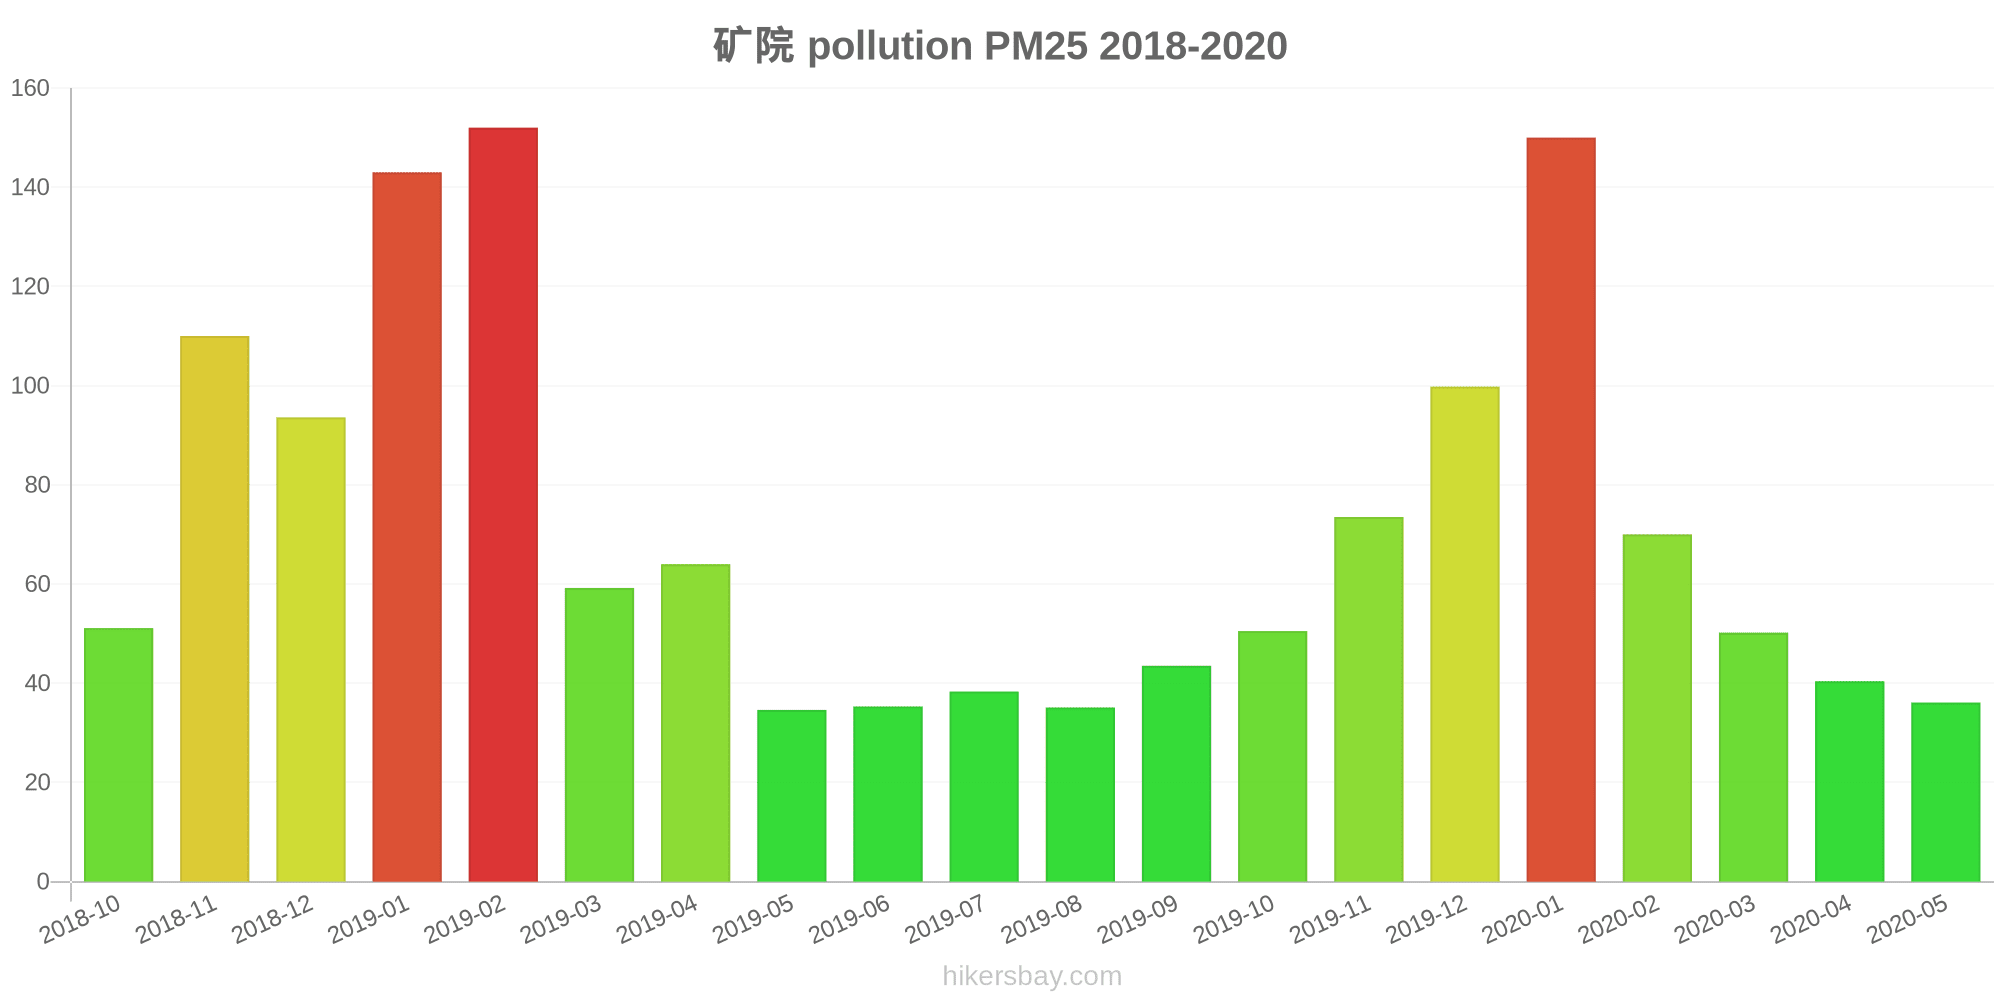
What is the current level of PM2.5 in Liulinqiao? (particulate matter (PM2.5) dust)
Today's PM2.5 level is:
35 (Unhealthy for Sensitive Groups)
For comparison, the highest level of PM2.5 in Liulinqiao in the last 7 days was: 56 (Friday, May 27, 2022) and the lowest: 56 (Friday, May 27, 2022).
The highest PM2.5 values were recorded: 152 (February 2019).
The lowest level of particulate matter PM2.5 pollution occurs in month: May (35).
How is the O3 level today in Liulinqiao? (ozone (O3))
0 (Good)
How high is the level of NO2? (nitrogen dioxide (NO2))
0 (Good)
What is the level of SO2 pollution? (sulfur dioxide (SO2))
0 (Good)
Current data Friday, May 27, 2022, 12:00 PM
PM10 179 (Very bad Hazardous)
PM2,5 35 (Unhealthy for Sensitive Groups)
O3 0 (Good)
NO2 0 (Good)
SO2 0 (Good)
Data on air pollution from recent days in Liulinqiao
index
2022-05-27
pm10
56
Unhealthy for Sensitive Groups
pm25
56
Unhealthy
o3
0
Good
no2
0
Good
so2
0
Good
data source »
Air pollution in Liulinqiao from October 2018 to May 2020

index
2020-05
2020-04
2020-03
2020-02
2020-01
2019-12
2019-11
2019-10
2019-09
2019-08
2019-07
2019-06
2019-05
2019-04
2019-03
2019-02
2019-01
2018-12
2018-11
2018-10
pm25
36 (Unhealthy for Sensitive Groups)
40 (Unhealthy for Sensitive Groups)
50 (Unhealthy for Sensitive Groups)
70 (Unhealthy)
150 (Very bad Hazardous)
100 (Very Unhealthy)
74 (Unhealthy)
51 (Unhealthy for Sensitive Groups)
44 (Unhealthy for Sensitive Groups)
35 (Unhealthy for Sensitive Groups)
38 (Unhealthy for Sensitive Groups)
35 (Unhealthy for Sensitive Groups)
35 (Moderate)
64 (Unhealthy)
59 (Unhealthy)
152 (Very bad Hazardous)
143 (Very bad Hazardous)
94 (Very Unhealthy)
110 (Very bad Hazardous)
51 (Unhealthy for Sensitive Groups)
co
667 (Good)
636 (Good)
690 (Good)
1 (Good)
1 (Good)
1 (Good)
1 (Good)
938 (Good)
1 (Good)
742 (Good)
586 (Good)
619 (Good)
565 (Good)
751 (Good)
846 (Good)
1 (Good)
2 (Good)
1 (Good)
1 (Good)
1 (Good)
no2
18 (Good)
32 (Good)
31 (Good)
23 (Good)
48 (Moderate)
52 (Moderate)
49 (Moderate)
41 (Moderate)
37 (Good)
26 (Good)
24 (Good)
26 (Good)
27 (Good)
33 (Good)
31 (Good)
39 (Good)
60 (Moderate)
51 (Moderate)
49 (Moderate)
56 (Moderate)
o3
161 (Unhealthy)
137 (Unhealthy for Sensitive Groups)
111 (Moderate)
90 (Moderate)
66 (Good)
42 (Good)
77 (Moderate)
114 (Moderate)
176 (Unhealthy)
158 (Unhealthy)
224 (Very Unhealthy)
237 (Very Unhealthy)
175 (Unhealthy)
139 (Unhealthy for Sensitive Groups)
129 (Unhealthy for Sensitive Groups)
93 (Moderate)
58 (Good)
49 (Good)
80 (Moderate)
111 (Moderate)
pm10
80 (Unhealthy for Sensitive Groups)
94 (Unhealthy)
104 (Unhealthy)
100 (Unhealthy)
200 (Very bad Hazardous)
150 (Very bad Hazardous)
145 (Very Unhealthy)
109 (Unhealthy)
90 (Unhealthy)
66 (Unhealthy for Sensitive Groups)
76 (Unhealthy for Sensitive Groups)
84 (Unhealthy)
93 (Unhealthy)
128 (Very Unhealthy)
117 (Very Unhealthy)
216 (Very bad Hazardous)
223 (Very bad Hazardous)
187 (Very bad Hazardous)
216 (Very bad Hazardous)
102 (Unhealthy)
so2
10 (Good)
13 (Good)
9.8 (Good)
7.5 (Good)
15 (Good)
16 (Good)
15 (Good)
13 (Good)
13 (Good)
8.7 (Good)
7.4 (Good)
11 (Good)
16 (Good)
14 (Good)
14 (Good)
21 (Good)
29 (Good)
27 (Good)
18 (Good)
23 (Good)
data source »
矿院
Friday, May 27, 2022, 12:00 PM
PM10 179 (Very bad Hazardous)
particulate matter (PM10) suspended dust
PM2,5 35 (Unhealthy for Sensitive Groups)
particulate matter (PM2.5) dust
O3 0.04 (Good)
ozone (O3)
NO2 0 (Good)
nitrogen dioxide (NO2)
SO2 0 (Good)
sulfur dioxide (SO2)
矿院
index
2022-05-27
pm10
56
pm25
56
o3
0.03
no2
0
so2
0
矿院
2018-10 2020-05

index
2020-05
2020-04
2020-03
2020-02
2020-01
2019-12
2019-11
2019-10
2019-09
2019-08
2019-07
2019-06
2019-05
2019-04
2019-03
2019-02
2019-01
2018-12
2018-11
2018-10
pm25
36
40
50
70
150
100
74
51
44
35
38
35
35
64
59
152
143
94
110
51
co
667
636
690
1
1
1
1
938
1
742
586
619
565
751
846
1
2
1
1
1
no2
18
32
31
23
48
52
49
41
37
26
24
26
27
33
31
39
60
51
49
56
o3
161
137
111
90
66
42
77
114
176
158
224
237
175
139
129
93
58
49
80
111
pm10
80
94
104
100
200
150
145
109
90
66
76
84
93
128
117
216
223
187
216
102
so2
10
13
9.8
7.5
15
16
15
13
13
8.7
7.4
11
16
14
14
21
29
27
18
23
* Pollution data source:
https://openaq.org
(ChinaAQIData)
The data is licensed under CC-By 4.0
PM10 179 (Very bad Hazardous)
PM2,5 35 (Unhealthy for Sensitive Groups)
O3 0 (Good)
NO2 0 (Good)
SO2 0 (Good)
Data on air pollution from recent days in Liulinqiao
| index | 2022-05-27 |
|---|---|
| pm10 | 56 Unhealthy for Sensitive Groups |
| pm25 | 56 Unhealthy |
| o3 | 0 Good |
| no2 | 0 Good |
| so2 | 0 Good |

| index | 2020-05 | 2020-04 | 2020-03 | 2020-02 | 2020-01 | 2019-12 | 2019-11 | 2019-10 | 2019-09 | 2019-08 | 2019-07 | 2019-06 | 2019-05 | 2019-04 | 2019-03 | 2019-02 | 2019-01 | 2018-12 | 2018-11 | 2018-10 |
|---|---|---|---|---|---|---|---|---|---|---|---|---|---|---|---|---|---|---|---|---|
| pm25 | 36 (Unhealthy for Sensitive Groups) | 40 (Unhealthy for Sensitive Groups) | 50 (Unhealthy for Sensitive Groups) | 70 (Unhealthy) | 150 (Very bad Hazardous) | 100 (Very Unhealthy) | 74 (Unhealthy) | 51 (Unhealthy for Sensitive Groups) | 44 (Unhealthy for Sensitive Groups) | 35 (Unhealthy for Sensitive Groups) | 38 (Unhealthy for Sensitive Groups) | 35 (Unhealthy for Sensitive Groups) | 35 (Moderate) | 64 (Unhealthy) | 59 (Unhealthy) | 152 (Very bad Hazardous) | 143 (Very bad Hazardous) | 94 (Very Unhealthy) | 110 (Very bad Hazardous) | 51 (Unhealthy for Sensitive Groups) |
| co | 667 (Good) | 636 (Good) | 690 (Good) | 1 (Good) | 1 (Good) | 1 (Good) | 1 (Good) | 938 (Good) | 1 (Good) | 742 (Good) | 586 (Good) | 619 (Good) | 565 (Good) | 751 (Good) | 846 (Good) | 1 (Good) | 2 (Good) | 1 (Good) | 1 (Good) | 1 (Good) |
| no2 | 18 (Good) | 32 (Good) | 31 (Good) | 23 (Good) | 48 (Moderate) | 52 (Moderate) | 49 (Moderate) | 41 (Moderate) | 37 (Good) | 26 (Good) | 24 (Good) | 26 (Good) | 27 (Good) | 33 (Good) | 31 (Good) | 39 (Good) | 60 (Moderate) | 51 (Moderate) | 49 (Moderate) | 56 (Moderate) |
| o3 | 161 (Unhealthy) | 137 (Unhealthy for Sensitive Groups) | 111 (Moderate) | 90 (Moderate) | 66 (Good) | 42 (Good) | 77 (Moderate) | 114 (Moderate) | 176 (Unhealthy) | 158 (Unhealthy) | 224 (Very Unhealthy) | 237 (Very Unhealthy) | 175 (Unhealthy) | 139 (Unhealthy for Sensitive Groups) | 129 (Unhealthy for Sensitive Groups) | 93 (Moderate) | 58 (Good) | 49 (Good) | 80 (Moderate) | 111 (Moderate) |
| pm10 | 80 (Unhealthy for Sensitive Groups) | 94 (Unhealthy) | 104 (Unhealthy) | 100 (Unhealthy) | 200 (Very bad Hazardous) | 150 (Very bad Hazardous) | 145 (Very Unhealthy) | 109 (Unhealthy) | 90 (Unhealthy) | 66 (Unhealthy for Sensitive Groups) | 76 (Unhealthy for Sensitive Groups) | 84 (Unhealthy) | 93 (Unhealthy) | 128 (Very Unhealthy) | 117 (Very Unhealthy) | 216 (Very bad Hazardous) | 223 (Very bad Hazardous) | 187 (Very bad Hazardous) | 216 (Very bad Hazardous) | 102 (Unhealthy) |
| so2 | 10 (Good) | 13 (Good) | 9.8 (Good) | 7.5 (Good) | 15 (Good) | 16 (Good) | 15 (Good) | 13 (Good) | 13 (Good) | 8.7 (Good) | 7.4 (Good) | 11 (Good) | 16 (Good) | 14 (Good) | 14 (Good) | 21 (Good) | 29 (Good) | 27 (Good) | 18 (Good) | 23 (Good) |
PM10 179 (Very bad Hazardous)
particulate matter (PM10) suspended dustPM2,5 35 (Unhealthy for Sensitive Groups)
particulate matter (PM2.5) dustO3 0.04 (Good)
ozone (O3)NO2 0 (Good)
nitrogen dioxide (NO2)SO2 0 (Good)
sulfur dioxide (SO2)矿院
| index | 2022-05-27 |
|---|---|
| pm10 | 56 |
| pm25 | 56 |
| o3 | 0.03 |
| no2 | 0 |
| so2 | 0 |
矿院
| index | 2020-05 | 2020-04 | 2020-03 | 2020-02 | 2020-01 | 2019-12 | 2019-11 | 2019-10 | 2019-09 | 2019-08 | 2019-07 | 2019-06 | 2019-05 | 2019-04 | 2019-03 | 2019-02 | 2019-01 | 2018-12 | 2018-11 | 2018-10 |
|---|---|---|---|---|---|---|---|---|---|---|---|---|---|---|---|---|---|---|---|---|
| pm25 | 36 | 40 | 50 | 70 | 150 | 100 | 74 | 51 | 44 | 35 | 38 | 35 | 35 | 64 | 59 | 152 | 143 | 94 | 110 | 51 |
| co | 667 | 636 | 690 | 1 | 1 | 1 | 1 | 938 | 1 | 742 | 586 | 619 | 565 | 751 | 846 | 1 | 2 | 1 | 1 | 1 |
| no2 | 18 | 32 | 31 | 23 | 48 | 52 | 49 | 41 | 37 | 26 | 24 | 26 | 27 | 33 | 31 | 39 | 60 | 51 | 49 | 56 |
| o3 | 161 | 137 | 111 | 90 | 66 | 42 | 77 | 114 | 176 | 158 | 224 | 237 | 175 | 139 | 129 | 93 | 58 | 49 | 80 | 111 |
| pm10 | 80 | 94 | 104 | 100 | 200 | 150 | 145 | 109 | 90 | 66 | 76 | 84 | 93 | 128 | 117 | 216 | 223 | 187 | 216 | 102 |
| so2 | 10 | 13 | 9.8 | 7.5 | 15 | 16 | 15 | 13 | 13 | 8.7 | 7.4 | 11 | 16 | 14 | 14 | 21 | 29 | 27 | 18 | 23 |