Air Pollution in Dongjunshibu: Real-time Air Quality Index and smog alert.
Pollution and air quality forecast for Dongjunshibu. Today is Tuesday, June 2, 2026. The following air pollution values have been recorded for Dongjunshibu:- particulate matter (PM10) suspended dust - 179 (Very bad Hazardous)
- particulate matter (PM2.5) dust - 35 (Unhealthy for Sensitive Groups)
- ozone (O3) - 0 (Good)
- nitrogen dioxide (NO2) - 0 (Good)
- sulfur dioxide (SO2) - 0 (Good)

What is the air quality in Dongjunshibu today? Is the air polluted in Dongjunshibu?. Is there smog?
What is the level of PM10 today in Dongjunshibu? (particulate matter (PM10) suspended dust)
The current level of particulate matter PM10 in Dongjunshibu is:
179 (Very bad Hazardous)
The highest PM10 values usually occur in month: 239 (January 2019).
The lowest value of particulate matter PM10 pollution in Dongjunshibu is usually recorded in: August (70).
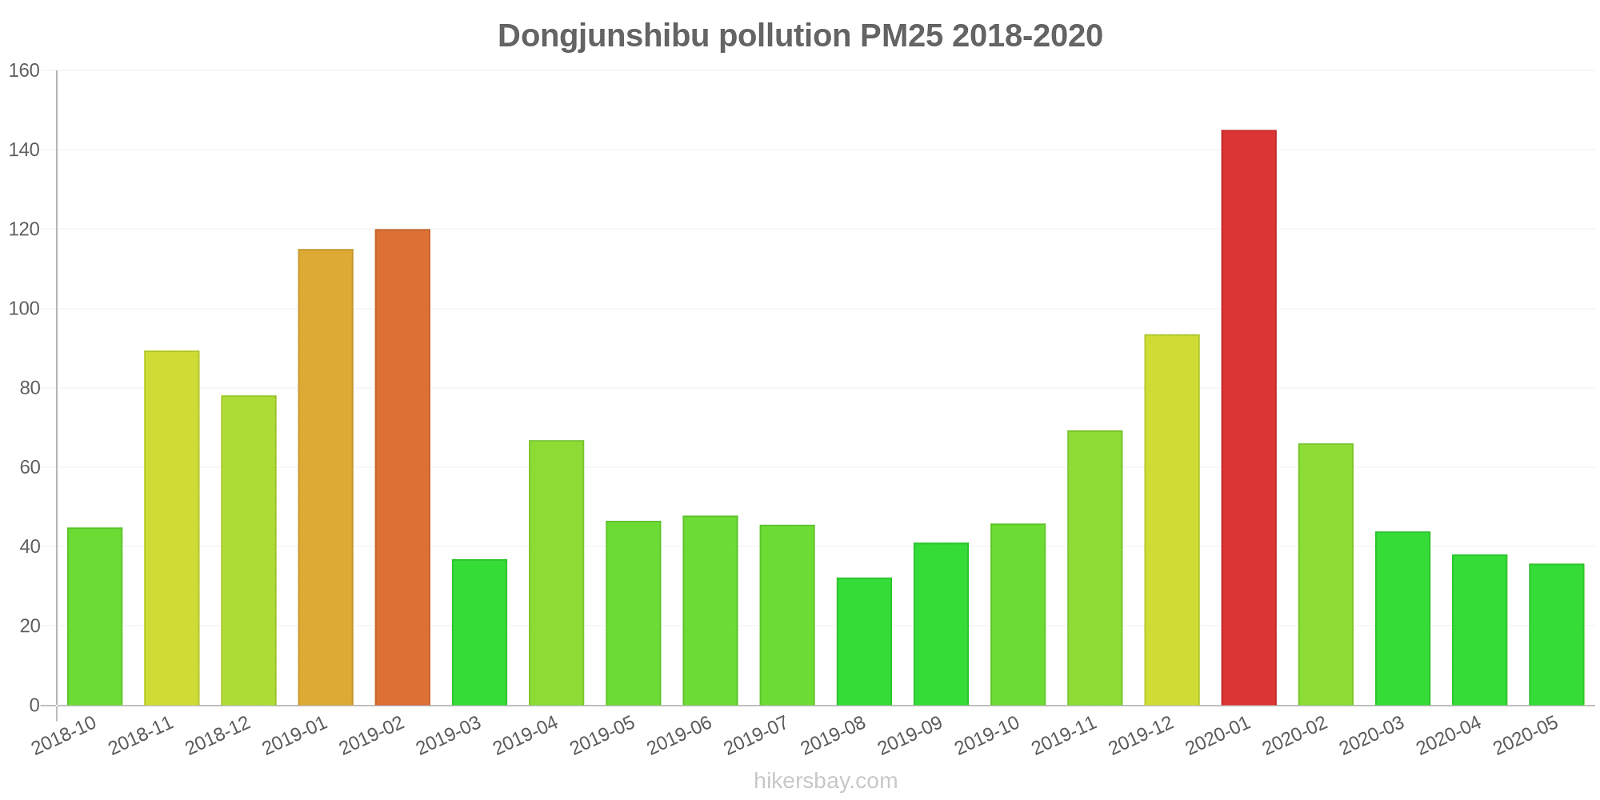
What is the current level of PM2.5 in Dongjunshibu? (particulate matter (PM2.5) dust)
Today's PM2.5 level is:
35 (Unhealthy for Sensitive Groups)
For comparison, the highest level of PM2.5 in Dongjunshibu in the last 7 days was: 56 (Friday, May 27, 2022) and the lowest: 56 (Friday, May 27, 2022).
The highest PM2.5 values were recorded: 145 (January 2020).
The lowest level of particulate matter PM2.5 pollution occurs in month: August (32).
How is the O3 level today in Dongjunshibu? (ozone (O3))
0 (Good)
How high is the level of NO2? (nitrogen dioxide (NO2))
0 (Good)
What is the level of SO2 pollution? (sulfur dioxide (SO2))
0 (Good)
Current data Friday, May 27, 2022, 12:00 PM
PM10 179 (Very bad Hazardous)
PM2,5 35 (Unhealthy for Sensitive Groups)
O3 0 (Good)
NO2 0 (Good)
SO2 0 (Good)
Data on air pollution from recent days in Dongjunshibu
index
2022-05-27
pm10
56
Unhealthy for Sensitive Groups
pm25
56
Unhealthy
o3
0
Good
no2
0
Good
so2
0
Good
data source »
Air pollution in Dongjunshibu from October 2018 to May 2020
index
2020-05
2020-04
2020-03
2020-02
2020-01
2019-12
2019-11
2019-10
2019-09
2019-08
2019-07
2019-06
2019-05
2019-04
2019-03
2019-02
2019-01
2018-12
2018-11
2018-10
pm25
36 (Unhealthy for Sensitive Groups)
38 (Unhealthy for Sensitive Groups)
44 (Unhealthy for Sensitive Groups)
66 (Unhealthy)
145 (Very bad Hazardous)
94 (Very Unhealthy)
69 (Unhealthy)
46 (Unhealthy for Sensitive Groups)
41 (Unhealthy for Sensitive Groups)
32 (Moderate)
46 (Unhealthy for Sensitive Groups)
48 (Unhealthy for Sensitive Groups)
47 (Unhealthy for Sensitive Groups)
67 (Unhealthy)
37 (Unhealthy for Sensitive Groups)
120 (Very bad Hazardous)
115 (Very bad Hazardous)
78 (Very Unhealthy)
89 (Very Unhealthy)
45 (Unhealthy for Sensitive Groups)
co
734 (Good)
708 (Good)
687 (Good)
1 (Good)
1 (Good)
1 (Good)
1 (Good)
1 (Good)
1 (Good)
874 (Good)
732 (Good)
761 (Good)
629 (Good)
721 (Good)
845 (Good)
1 (Good)
2 (Good)
1 (Good)
1 (Good)
1 (Good)
no2
23 (Good)
37 (Good)
34 (Good)
24 (Good)
53 (Moderate)
55 (Moderate)
53 (Moderate)
41 (Moderate)
41 (Moderate)
29 (Good)
27 (Good)
28 (Good)
26 (Good)
32 (Good)
31 (Good)
39 (Good)
61 (Moderate)
59 (Moderate)
56 (Moderate)
63 (Moderate)
o3
150 (Unhealthy)
135 (Unhealthy for Sensitive Groups)
107 (Moderate)
84 (Moderate)
60 (Good)
39 (Good)
72 (Moderate)
107 (Moderate)
160 (Unhealthy)
145 (Unhealthy for Sensitive Groups)
204 (Very Unhealthy)
247 (Very bad Hazardous)
184 (Very Unhealthy)
143 (Unhealthy for Sensitive Groups)
124 (Unhealthy for Sensitive Groups)
85 (Moderate)
49 (Good)
42 (Good)
70 (Moderate)
92 (Moderate)
pm10
82 (Unhealthy)
92 (Unhealthy)
97 (Unhealthy)
95 (Unhealthy)
196 (Very bad Hazardous)
154 (Very bad Hazardous)
156 (Very bad Hazardous)
118 (Very Unhealthy)
91 (Unhealthy)
70 (Unhealthy for Sensitive Groups)
76 (Unhealthy for Sensitive Groups)
88 (Unhealthy)
102 (Unhealthy)
137 (Very Unhealthy)
126 (Very Unhealthy)
220 (Very bad Hazardous)
239 (Very bad Hazardous)
187 (Very bad Hazardous)
196 (Very bad Hazardous)
128 (Very Unhealthy)
so2
13 (Good)
16 (Good)
11 (Good)
7.4 (Good)
13 (Good)
10 (Good)
12 (Good)
10 (Good)
14 (Good)
9.6 (Good)
10 (Good)
12 (Good)
12 (Good)
12 (Good)
14 (Good)
25 (Good)
41 (Good)
34 (Good)
19 (Good)
21 (Good)
data source »
东污水处理厂
Friday, May 27, 2022, 12:00 PM
PM10 179 (Very bad Hazardous)
particulate matter (PM10) suspended dust
PM2,5 35 (Unhealthy for Sensitive Groups)
particulate matter (PM2.5) dust
O3 0.04 (Good)
ozone (O3)
NO2 0 (Good)
nitrogen dioxide (NO2)
SO2 0 (Good)
sulfur dioxide (SO2)
东污水处理厂
index
2022-05-27
pm10
56
pm25
56
o3
0.03
no2
0
so2
0
东污水处理厂
2018-10 2020-05
index
2020-05
2020-04
2020-03
2020-02
2020-01
2019-12
2019-11
2019-10
2019-09
2019-08
2019-07
2019-06
2019-05
2019-04
2019-03
2019-02
2019-01
2018-12
2018-11
2018-10
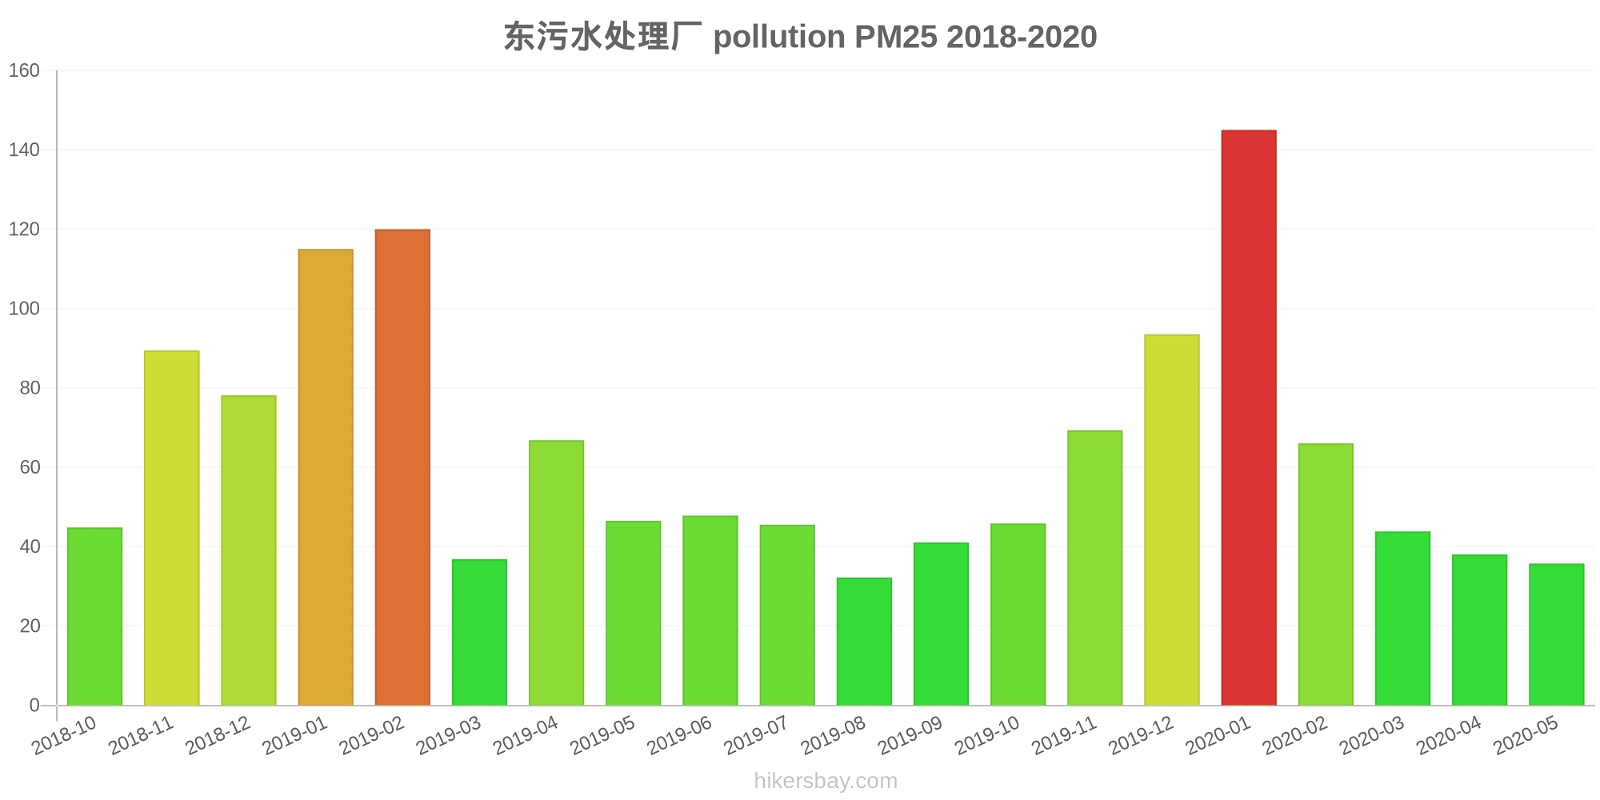
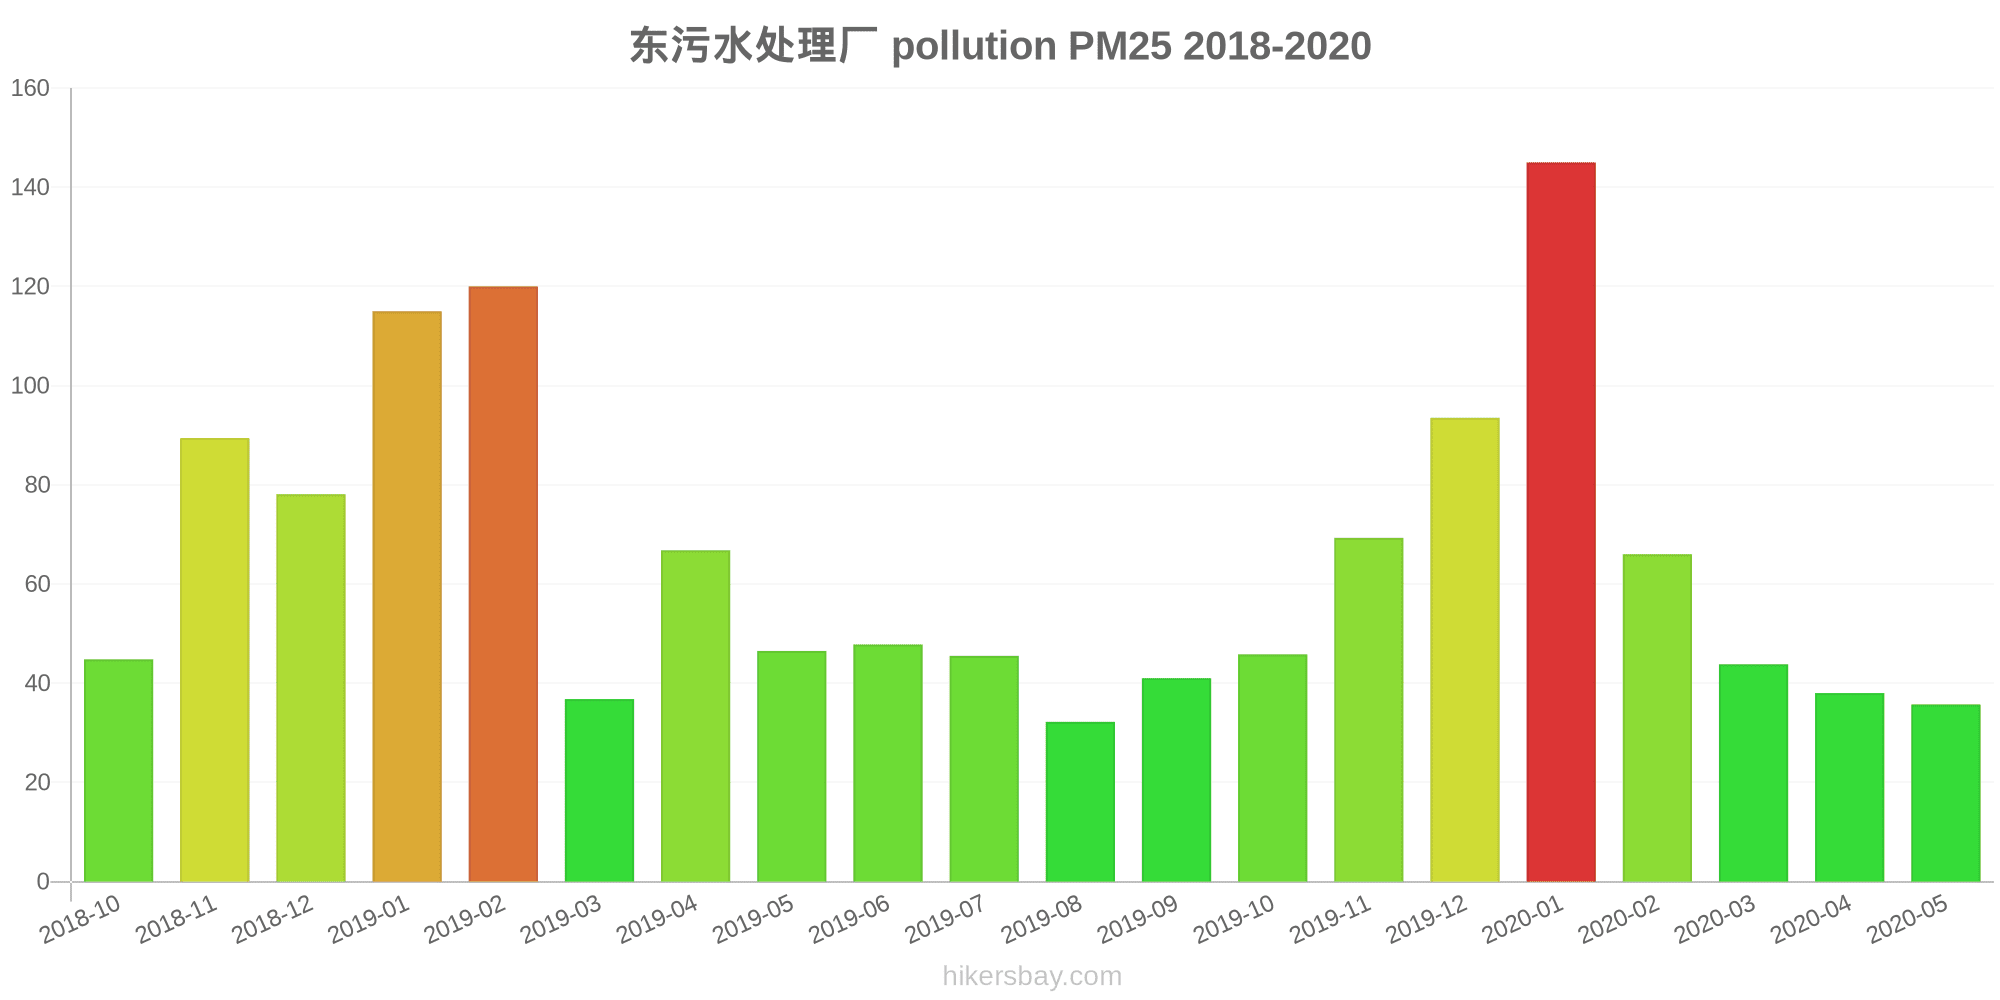
pm25
36
38
44
66
145
94
69
46
41
32
46
48
47
67
37
120
115
78
89
45
co
734
708
687
1
1
1
1
1
1
874
732
761
629
721
845
1
2
1
1
1
no2
23
37
34
24
53
55
53
41
41
29
27
28
26
32
31
39
61
59
56
63
o3
150
135
107
84
60
39
72
107
160
145
204
247
184
143
124
85
49
42
70
92
pm10
82
92
97
95
196
154
156
118
91
70
76
88
102
137
126
220
239
187
196
128
so2
13
16
11
7.4
13
10
12
10
14
9.6
10
12
12
12
14
25
41
34
19
21
* Pollution data source:
https://openaq.org
(ChinaAQIData)
The data is licensed under CC-By 4.0
PM10 179 (Very bad Hazardous)
PM2,5 35 (Unhealthy for Sensitive Groups)
O3 0 (Good)
NO2 0 (Good)
SO2 0 (Good)
Data on air pollution from recent days in Dongjunshibu
| index | 2022-05-27 |
|---|---|
| pm10 | 56 Unhealthy for Sensitive Groups |
| pm25 | 56 Unhealthy |
| o3 | 0 Good |
| no2 | 0 Good |
| so2 | 0 Good |

| index | 2020-05 | 2020-04 | 2020-03 | 2020-02 | 2020-01 | 2019-12 | 2019-11 | 2019-10 | 2019-09 | 2019-08 | 2019-07 | 2019-06 | 2019-05 | 2019-04 | 2019-03 | 2019-02 | 2019-01 | 2018-12 | 2018-11 | 2018-10 |
|---|---|---|---|---|---|---|---|---|---|---|---|---|---|---|---|---|---|---|---|---|
| pm25 | 36 (Unhealthy for Sensitive Groups) | 38 (Unhealthy for Sensitive Groups) | 44 (Unhealthy for Sensitive Groups) | 66 (Unhealthy) | 145 (Very bad Hazardous) | 94 (Very Unhealthy) | 69 (Unhealthy) | 46 (Unhealthy for Sensitive Groups) | 41 (Unhealthy for Sensitive Groups) | 32 (Moderate) | 46 (Unhealthy for Sensitive Groups) | 48 (Unhealthy for Sensitive Groups) | 47 (Unhealthy for Sensitive Groups) | 67 (Unhealthy) | 37 (Unhealthy for Sensitive Groups) | 120 (Very bad Hazardous) | 115 (Very bad Hazardous) | 78 (Very Unhealthy) | 89 (Very Unhealthy) | 45 (Unhealthy for Sensitive Groups) |
| co | 734 (Good) | 708 (Good) | 687 (Good) | 1 (Good) | 1 (Good) | 1 (Good) | 1 (Good) | 1 (Good) | 1 (Good) | 874 (Good) | 732 (Good) | 761 (Good) | 629 (Good) | 721 (Good) | 845 (Good) | 1 (Good) | 2 (Good) | 1 (Good) | 1 (Good) | 1 (Good) |
| no2 | 23 (Good) | 37 (Good) | 34 (Good) | 24 (Good) | 53 (Moderate) | 55 (Moderate) | 53 (Moderate) | 41 (Moderate) | 41 (Moderate) | 29 (Good) | 27 (Good) | 28 (Good) | 26 (Good) | 32 (Good) | 31 (Good) | 39 (Good) | 61 (Moderate) | 59 (Moderate) | 56 (Moderate) | 63 (Moderate) |
| o3 | 150 (Unhealthy) | 135 (Unhealthy for Sensitive Groups) | 107 (Moderate) | 84 (Moderate) | 60 (Good) | 39 (Good) | 72 (Moderate) | 107 (Moderate) | 160 (Unhealthy) | 145 (Unhealthy for Sensitive Groups) | 204 (Very Unhealthy) | 247 (Very bad Hazardous) | 184 (Very Unhealthy) | 143 (Unhealthy for Sensitive Groups) | 124 (Unhealthy for Sensitive Groups) | 85 (Moderate) | 49 (Good) | 42 (Good) | 70 (Moderate) | 92 (Moderate) |
| pm10 | 82 (Unhealthy) | 92 (Unhealthy) | 97 (Unhealthy) | 95 (Unhealthy) | 196 (Very bad Hazardous) | 154 (Very bad Hazardous) | 156 (Very bad Hazardous) | 118 (Very Unhealthy) | 91 (Unhealthy) | 70 (Unhealthy for Sensitive Groups) | 76 (Unhealthy for Sensitive Groups) | 88 (Unhealthy) | 102 (Unhealthy) | 137 (Very Unhealthy) | 126 (Very Unhealthy) | 220 (Very bad Hazardous) | 239 (Very bad Hazardous) | 187 (Very bad Hazardous) | 196 (Very bad Hazardous) | 128 (Very Unhealthy) |
| so2 | 13 (Good) | 16 (Good) | 11 (Good) | 7.4 (Good) | 13 (Good) | 10 (Good) | 12 (Good) | 10 (Good) | 14 (Good) | 9.6 (Good) | 10 (Good) | 12 (Good) | 12 (Good) | 12 (Good) | 14 (Good) | 25 (Good) | 41 (Good) | 34 (Good) | 19 (Good) | 21 (Good) |
PM10 179 (Very bad Hazardous)
particulate matter (PM10) suspended dustPM2,5 35 (Unhealthy for Sensitive Groups)
particulate matter (PM2.5) dustO3 0.04 (Good)
ozone (O3)NO2 0 (Good)
nitrogen dioxide (NO2)SO2 0 (Good)
sulfur dioxide (SO2)东污水处理厂
| index | 2022-05-27 |
|---|---|
| pm10 | 56 |
| pm25 | 56 |
| o3 | 0.03 |
| no2 | 0 |
| so2 | 0 |
东污水处理厂
| index | 2020-05 | 2020-04 | 2020-03 | 2020-02 | 2020-01 | 2019-12 | 2019-11 | 2019-10 | 2019-09 | 2019-08 | 2019-07 | 2019-06 | 2019-05 | 2019-04 | 2019-03 | 2019-02 | 2019-01 | 2018-12 | 2018-11 | 2018-10 |
|---|---|---|---|---|---|---|---|---|---|---|---|---|---|---|---|---|---|---|---|---|
| pm25 | 36 | 38 | 44 | 66 | 145 | 94 | 69 | 46 | 41 | 32 | 46 | 48 | 47 | 67 | 37 | 120 | 115 | 78 | 89 | 45 |
| co | 734 | 708 | 687 | 1 | 1 | 1 | 1 | 1 | 1 | 874 | 732 | 761 | 629 | 721 | 845 | 1 | 2 | 1 | 1 | 1 |
| no2 | 23 | 37 | 34 | 24 | 53 | 55 | 53 | 41 | 41 | 29 | 27 | 28 | 26 | 32 | 31 | 39 | 61 | 59 | 56 | 63 |
| o3 | 150 | 135 | 107 | 84 | 60 | 39 | 72 | 107 | 160 | 145 | 204 | 247 | 184 | 143 | 124 | 85 | 49 | 42 | 70 | 92 |
| pm10 | 82 | 92 | 97 | 95 | 196 | 154 | 156 | 118 | 91 | 70 | 76 | 88 | 102 | 137 | 126 | 220 | 239 | 187 | 196 | 128 |
| so2 | 13 | 16 | 11 | 7.4 | 13 | 10 | 12 | 10 | 14 | 9.6 | 10 | 12 | 12 | 12 | 14 | 25 | 41 | 34 | 19 | 21 |