Air Pollution in Nanxiaowang: Real-time Air Quality Index and smog alert.
Pollution and air quality forecast for Nanxiaowang. Today is Tuesday, June 2, 2026. The following air pollution values have been recorded for Nanxiaowang:- particulate matter (PM10) suspended dust - 179 (Very bad Hazardous)
- particulate matter (PM2.5) dust - 35 (Unhealthy for Sensitive Groups)
- ozone (O3) - 0 (Good)
- nitrogen dioxide (NO2) - 0 (Good)
- sulfur dioxide (SO2) - 0 (Good)

What is the air quality in Nanxiaowang today? Is the air polluted in Nanxiaowang?. Is there smog?
What is the level of PM10 today in Nanxiaowang? (particulate matter (PM10) suspended dust)
The current level of particulate matter PM10 in Nanxiaowang is:
179 (Very bad Hazardous)
The highest PM10 values usually occur in month: 210 (January 2019).
The lowest value of particulate matter PM10 pollution in Nanxiaowang is usually recorded in: August (52).
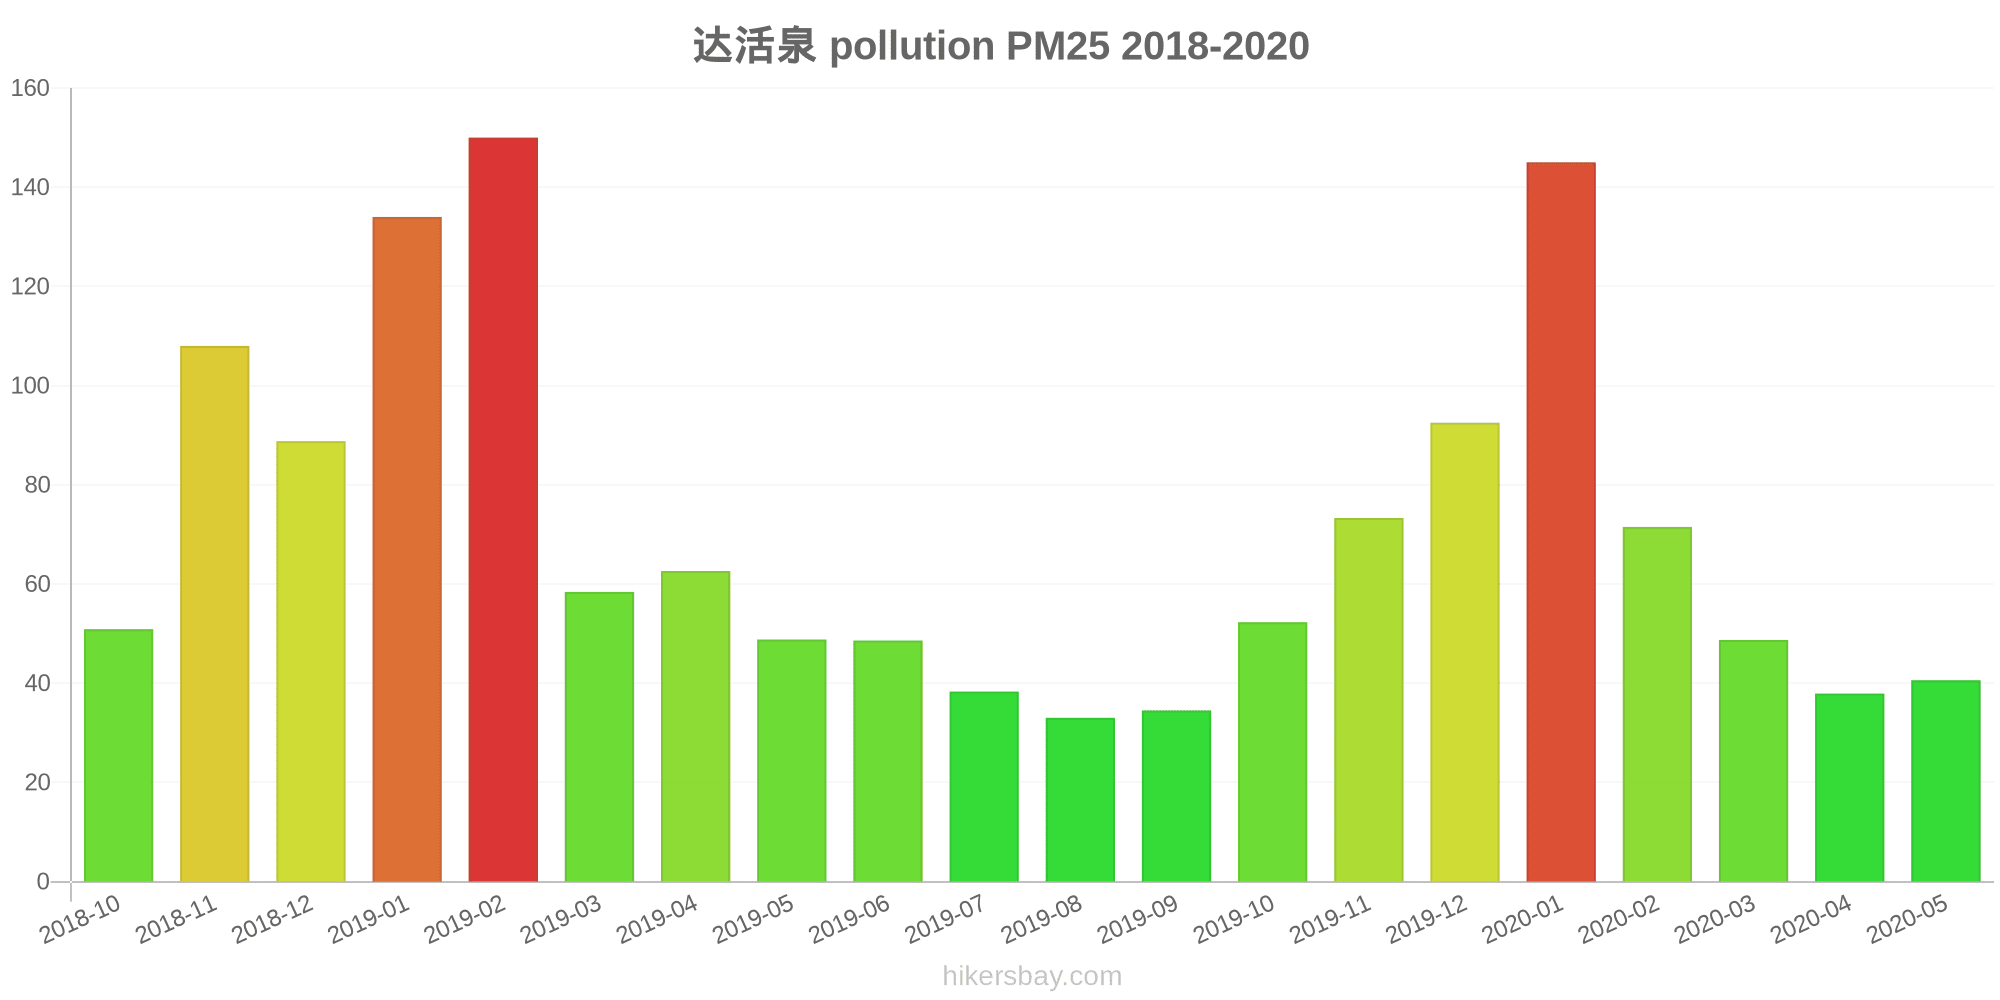
What is the current level of PM2.5 in Nanxiaowang? (particulate matter (PM2.5) dust)
Today's PM2.5 level is:
35 (Unhealthy for Sensitive Groups)
For comparison, the highest level of PM2.5 in Nanxiaowang in the last 7 days was: 56 (Friday, May 27, 2022) and the lowest: 56 (Friday, May 27, 2022).
The highest PM2.5 values were recorded: 150 (February 2019).
The lowest level of particulate matter PM2.5 pollution occurs in month: August (33).
How is the O3 level today in Nanxiaowang? (ozone (O3))
0 (Good)
How high is the level of NO2? (nitrogen dioxide (NO2))
0 (Good)
What is the level of SO2 pollution? (sulfur dioxide (SO2))
0 (Good)
Current data Friday, May 27, 2022, 12:00 PM
PM10 179 (Very bad Hazardous)
PM2,5 35 (Unhealthy for Sensitive Groups)
O3 0 (Good)
NO2 0 (Good)
SO2 0 (Good)
Data on air pollution from recent days in Nanxiaowang
index
2022-05-27
pm10
56
Unhealthy for Sensitive Groups
pm25
56
Unhealthy
o3
0
Good
no2
0
Good
so2
0
Good
data source »
Air pollution in Nanxiaowang from October 2018 to May 2020

index
2020-05
2020-04
2020-03
2020-02
2020-01
2019-12
2019-11
2019-10
2019-09
2019-08
2019-07
2019-06
2019-05
2019-04
2019-03
2019-02
2019-01
2018-12
2018-11
2018-10
pm25
41 (Unhealthy for Sensitive Groups)
38 (Unhealthy for Sensitive Groups)
49 (Unhealthy for Sensitive Groups)
72 (Unhealthy)
145 (Very bad Hazardous)
93 (Very Unhealthy)
73 (Unhealthy)
52 (Unhealthy for Sensitive Groups)
35 (Moderate)
33 (Moderate)
38 (Unhealthy for Sensitive Groups)
49 (Unhealthy for Sensitive Groups)
49 (Unhealthy for Sensitive Groups)
63 (Unhealthy)
58 (Unhealthy)
150 (Very bad Hazardous)
134 (Very bad Hazardous)
89 (Very Unhealthy)
108 (Very Unhealthy)
51 (Unhealthy for Sensitive Groups)
co
924 (Good)
938 (Good)
944 (Good)
1 (Good)
2 (Good)
1 (Good)
1 (Good)
1 (Good)
1 (Good)
818 (Good)
931 (Good)
914 (Good)
1 (Good)
1 (Good)
999 (Good)
1 (Good)
2 (Good)
1 (Good)
1 (Good)
1 (Good)
no2
28 (Good)
31 (Good)
34 (Good)
22 (Good)
55 (Moderate)
63 (Moderate)
62 (Moderate)
47 (Moderate)
42 (Moderate)
27 (Good)
26 (Good)
32 (Good)
39 (Good)
42 (Moderate)
38 (Good)
45 (Moderate)
72 (Moderate)
54 (Moderate)
61 (Moderate)
63 (Moderate)
o3
151 (Unhealthy)
140 (Unhealthy for Sensitive Groups)
108 (Moderate)
88 (Moderate)
62 (Good)
40 (Good)
55 (Good)
95 (Moderate)
165 (Unhealthy)
162 (Unhealthy)
216 (Very Unhealthy)
234 (Very Unhealthy)
177 (Unhealthy)
130 (Unhealthy for Sensitive Groups)
123 (Unhealthy for Sensitive Groups)
99 (Moderate)
55 (Good)
43 (Good)
65 (Good)
99 (Moderate)
pm10
71 (Unhealthy for Sensitive Groups)
79 (Unhealthy for Sensitive Groups)
97 (Unhealthy)
98 (Unhealthy)
189 (Very bad Hazardous)
139 (Very Unhealthy)
140 (Very Unhealthy)
97 (Unhealthy)
64 (Unhealthy for Sensitive Groups)
52 (Unhealthy for Sensitive Groups)
58 (Unhealthy for Sensitive Groups)
66 (Unhealthy for Sensitive Groups)
91 (Unhealthy)
136 (Very Unhealthy)
126 (Very Unhealthy)
207 (Very bad Hazardous)
210 (Very bad Hazardous)
164 (Very bad Hazardous)
191 (Very bad Hazardous)
112 (Very Unhealthy)
so2
19 (Good)
16 (Good)
13 (Good)
14 (Good)
20 (Good)
15 (Good)
15 (Good)
10 (Good)
14 (Good)
9.7 (Good)
13 (Good)
21 (Good)
22 (Good)
20 (Good)
17 (Good)
25 (Good)
32 (Good)
26 (Good)
22 (Good)
24 (Good)
data source »
达活泉
Friday, May 27, 2022, 12:00 PM
PM10 179 (Very bad Hazardous)
particulate matter (PM10) suspended dust
PM2,5 35 (Unhealthy for Sensitive Groups)
particulate matter (PM2.5) dust
O3 0.04 (Good)
ozone (O3)
NO2 0 (Good)
nitrogen dioxide (NO2)
SO2 0 (Good)
sulfur dioxide (SO2)
达活泉
index
2022-05-27
pm10
56
pm25
56
o3
0.03
no2
0
so2
0
达活泉
2018-10 2020-05

index
2020-05
2020-04
2020-03
2020-02
2020-01
2019-12
2019-11
2019-10
2019-09
2019-08
2019-07
2019-06
2019-05
2019-04
2019-03
2019-02
2019-01
2018-12
2018-11
2018-10
pm25
41
38
49
72
145
93
73
52
35
33
38
49
49
63
58
150
134
89
108
51
co
924
938
944
1
2
1
1
1
1
818
931
914
1
1
999
1
2
1
1
1
no2
28
31
34
22
55
63
62
47
42
27
26
32
39
42
38
45
72
54
61
63
o3
151
140
108
88
62
40
55
95
165
162
216
234
177
130
123
99
55
43
65
99
pm10
71
79
97
98
189
139
140
97
64
52
58
66
91
136
126
207
210
164
191
112
so2
19
16
13
14
20
15
15
10
14
9.7
13
21
22
20
17
25
32
26
22
24
* Pollution data source:
https://openaq.org
(ChinaAQIData)
The data is licensed under CC-By 4.0
PM10 179 (Very bad Hazardous)
PM2,5 35 (Unhealthy for Sensitive Groups)
O3 0 (Good)
NO2 0 (Good)
SO2 0 (Good)
Data on air pollution from recent days in Nanxiaowang
| index | 2022-05-27 |
|---|---|
| pm10 | 56 Unhealthy for Sensitive Groups |
| pm25 | 56 Unhealthy |
| o3 | 0 Good |
| no2 | 0 Good |
| so2 | 0 Good |

| index | 2020-05 | 2020-04 | 2020-03 | 2020-02 | 2020-01 | 2019-12 | 2019-11 | 2019-10 | 2019-09 | 2019-08 | 2019-07 | 2019-06 | 2019-05 | 2019-04 | 2019-03 | 2019-02 | 2019-01 | 2018-12 | 2018-11 | 2018-10 |
|---|---|---|---|---|---|---|---|---|---|---|---|---|---|---|---|---|---|---|---|---|
| pm25 | 41 (Unhealthy for Sensitive Groups) | 38 (Unhealthy for Sensitive Groups) | 49 (Unhealthy for Sensitive Groups) | 72 (Unhealthy) | 145 (Very bad Hazardous) | 93 (Very Unhealthy) | 73 (Unhealthy) | 52 (Unhealthy for Sensitive Groups) | 35 (Moderate) | 33 (Moderate) | 38 (Unhealthy for Sensitive Groups) | 49 (Unhealthy for Sensitive Groups) | 49 (Unhealthy for Sensitive Groups) | 63 (Unhealthy) | 58 (Unhealthy) | 150 (Very bad Hazardous) | 134 (Very bad Hazardous) | 89 (Very Unhealthy) | 108 (Very Unhealthy) | 51 (Unhealthy for Sensitive Groups) |
| co | 924 (Good) | 938 (Good) | 944 (Good) | 1 (Good) | 2 (Good) | 1 (Good) | 1 (Good) | 1 (Good) | 1 (Good) | 818 (Good) | 931 (Good) | 914 (Good) | 1 (Good) | 1 (Good) | 999 (Good) | 1 (Good) | 2 (Good) | 1 (Good) | 1 (Good) | 1 (Good) |
| no2 | 28 (Good) | 31 (Good) | 34 (Good) | 22 (Good) | 55 (Moderate) | 63 (Moderate) | 62 (Moderate) | 47 (Moderate) | 42 (Moderate) | 27 (Good) | 26 (Good) | 32 (Good) | 39 (Good) | 42 (Moderate) | 38 (Good) | 45 (Moderate) | 72 (Moderate) | 54 (Moderate) | 61 (Moderate) | 63 (Moderate) |
| o3 | 151 (Unhealthy) | 140 (Unhealthy for Sensitive Groups) | 108 (Moderate) | 88 (Moderate) | 62 (Good) | 40 (Good) | 55 (Good) | 95 (Moderate) | 165 (Unhealthy) | 162 (Unhealthy) | 216 (Very Unhealthy) | 234 (Very Unhealthy) | 177 (Unhealthy) | 130 (Unhealthy for Sensitive Groups) | 123 (Unhealthy for Sensitive Groups) | 99 (Moderate) | 55 (Good) | 43 (Good) | 65 (Good) | 99 (Moderate) |
| pm10 | 71 (Unhealthy for Sensitive Groups) | 79 (Unhealthy for Sensitive Groups) | 97 (Unhealthy) | 98 (Unhealthy) | 189 (Very bad Hazardous) | 139 (Very Unhealthy) | 140 (Very Unhealthy) | 97 (Unhealthy) | 64 (Unhealthy for Sensitive Groups) | 52 (Unhealthy for Sensitive Groups) | 58 (Unhealthy for Sensitive Groups) | 66 (Unhealthy for Sensitive Groups) | 91 (Unhealthy) | 136 (Very Unhealthy) | 126 (Very Unhealthy) | 207 (Very bad Hazardous) | 210 (Very bad Hazardous) | 164 (Very bad Hazardous) | 191 (Very bad Hazardous) | 112 (Very Unhealthy) |
| so2 | 19 (Good) | 16 (Good) | 13 (Good) | 14 (Good) | 20 (Good) | 15 (Good) | 15 (Good) | 10 (Good) | 14 (Good) | 9.7 (Good) | 13 (Good) | 21 (Good) | 22 (Good) | 20 (Good) | 17 (Good) | 25 (Good) | 32 (Good) | 26 (Good) | 22 (Good) | 24 (Good) |
PM10 179 (Very bad Hazardous)
particulate matter (PM10) suspended dustPM2,5 35 (Unhealthy for Sensitive Groups)
particulate matter (PM2.5) dustO3 0.04 (Good)
ozone (O3)NO2 0 (Good)
nitrogen dioxide (NO2)SO2 0 (Good)
sulfur dioxide (SO2)达活泉
| index | 2022-05-27 |
|---|---|
| pm10 | 56 |
| pm25 | 56 |
| o3 | 0.03 |
| no2 | 0 |
| so2 | 0 |
达活泉
| index | 2020-05 | 2020-04 | 2020-03 | 2020-02 | 2020-01 | 2019-12 | 2019-11 | 2019-10 | 2019-09 | 2019-08 | 2019-07 | 2019-06 | 2019-05 | 2019-04 | 2019-03 | 2019-02 | 2019-01 | 2018-12 | 2018-11 | 2018-10 |
|---|---|---|---|---|---|---|---|---|---|---|---|---|---|---|---|---|---|---|---|---|
| pm25 | 41 | 38 | 49 | 72 | 145 | 93 | 73 | 52 | 35 | 33 | 38 | 49 | 49 | 63 | 58 | 150 | 134 | 89 | 108 | 51 |
| co | 924 | 938 | 944 | 1 | 2 | 1 | 1 | 1 | 1 | 818 | 931 | 914 | 1 | 1 | 999 | 1 | 2 | 1 | 1 | 1 |
| no2 | 28 | 31 | 34 | 22 | 55 | 63 | 62 | 47 | 42 | 27 | 26 | 32 | 39 | 42 | 38 | 45 | 72 | 54 | 61 | 63 |
| o3 | 151 | 140 | 108 | 88 | 62 | 40 | 55 | 95 | 165 | 162 | 216 | 234 | 177 | 130 | 123 | 99 | 55 | 43 | 65 | 99 |
| pm10 | 71 | 79 | 97 | 98 | 189 | 139 | 140 | 97 | 64 | 52 | 58 | 66 | 91 | 136 | 126 | 207 | 210 | 164 | 191 | 112 |
| so2 | 19 | 16 | 13 | 14 | 20 | 15 | 15 | 10 | 14 | 9.7 | 13 | 21 | 22 | 20 | 17 | 25 | 32 | 26 | 22 | 24 |