Air Pollution in Xianyu: Real-time Air Quality Index and smog alert.
Pollution and air quality forecast for Xianyu. Today is Wednesday, June 3, 2026. The following air pollution values have been recorded for Xianyu:- particulate matter (PM10) suspended dust - 179 (Very bad Hazardous)
- particulate matter (PM2.5) dust - 35 (Unhealthy for Sensitive Groups)
- ozone (O3) - 0 (Good)
- nitrogen dioxide (NO2) - 0 (Good)
- sulfur dioxide (SO2) - 0 (Good)

What is the air quality in Xianyu today? Is the air polluted in Xianyu?. Is there smog?
What is the level of PM10 today in Xianyu? (particulate matter (PM10) suspended dust)
The current level of particulate matter PM10 in Xianyu is:
179 (Very bad Hazardous)
The highest PM10 values usually occur in month: 233 (November 2018).
The lowest value of particulate matter PM10 pollution in Xianyu is usually recorded in: August (62).
What is the current level of PM2.5 in Xianyu? (particulate matter (PM2.5) dust)
Today's PM2.5 level is:
35 (Unhealthy for Sensitive Groups)
For comparison, the highest level of PM2.5 in Xianyu in the last 7 days was: 56 (Friday, May 27, 2022) and the lowest: 56 (Friday, May 27, 2022).
The highest PM2.5 values were recorded: 136 (February 2019).
The lowest level of particulate matter PM2.5 pollution occurs in month: August (27).
How is the O3 level today in Xianyu? (ozone (O3))
0 (Good)
How high is the level of NO2? (nitrogen dioxide (NO2))
0 (Good)
What is the level of SO2 pollution? (sulfur dioxide (SO2))
0 (Good)
Current data Friday, May 27, 2022, 12:00 PM
PM10 179 (Very bad Hazardous)
PM2,5 35 (Unhealthy for Sensitive Groups)
O3 0 (Good)
NO2 0 (Good)
SO2 0 (Good)
Data on air pollution from recent days in Xianyu
index
2022-05-27
pm10
56
Unhealthy for Sensitive Groups
pm25
56
Unhealthy
o3
0
Good
no2
0
Good
so2
0
Good
data source »
Air pollution in Xianyu from October 2018 to May 2020
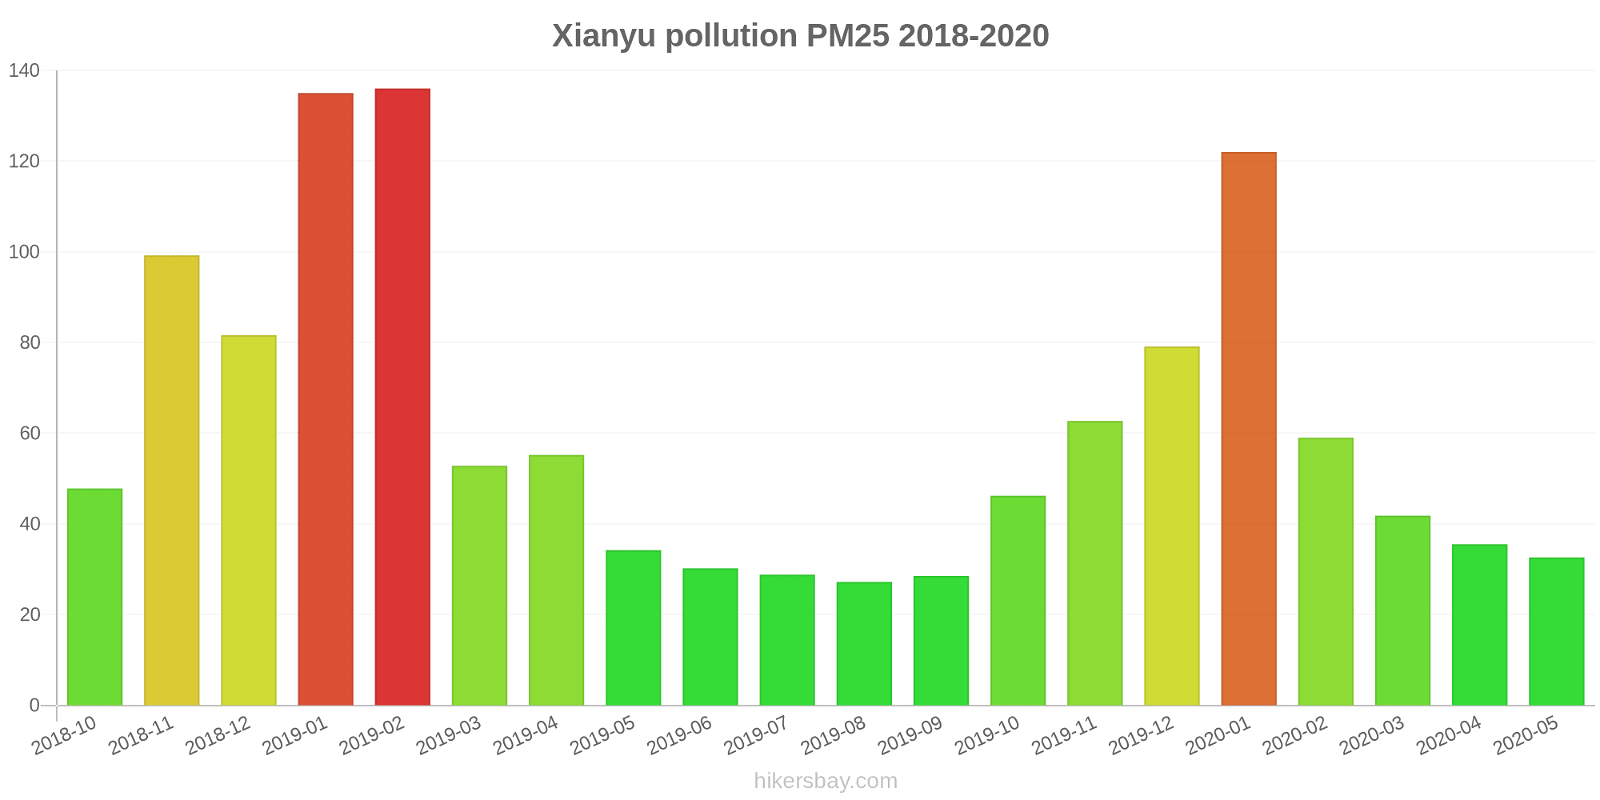
index
2020-05
2020-04
2020-03
2020-02
2020-01
2019-12
2019-11
2019-10
2019-09
2019-08
2019-07
2019-06
2019-05
2019-04
2019-03
2019-02
2019-01
2018-12
2018-11
2018-10
pm25
33 (Moderate)
36 (Unhealthy for Sensitive Groups)
42 (Unhealthy for Sensitive Groups)
59 (Unhealthy)
122 (Very bad Hazardous)
79 (Very Unhealthy)
63 (Unhealthy)
46 (Unhealthy for Sensitive Groups)
29 (Moderate)
27 (Moderate)
29 (Moderate)
30 (Moderate)
34 (Moderate)
55 (Unhealthy)
53 (Unhealthy for Sensitive Groups)
136 (Very bad Hazardous)
135 (Very bad Hazardous)
82 (Very Unhealthy)
99 (Very Unhealthy)
48 (Unhealthy for Sensitive Groups)
co
815 (Good)
737 (Good)
957 (Good)
1 (Good)
2 (Good)
1 (Good)
983 (Good)
1 (Good)
831 (Good)
784 (Good)
786 (Good)
839 (Good)
815 (Good)
761 (Good)
739 (Good)
1 (Good)
1 (Good)
1 (Good)
1 (Good)
1 (Good)
no2
27 (Good)
37 (Good)
39 (Good)
25 (Good)
55 (Moderate)
59 (Moderate)
63 (Moderate)
53 (Moderate)
44 (Moderate)
34 (Good)
32 (Good)
35 (Good)
40 (Good)
43 (Moderate)
38 (Good)
47 (Moderate)
71 (Moderate)
57 (Moderate)
64 (Moderate)
64 (Moderate)
o3
138 (Unhealthy for Sensitive Groups)
135 (Unhealthy for Sensitive Groups)
110 (Moderate)
86 (Moderate)
64 (Good)
40 (Good)
63 (Good)
96 (Moderate)
161 (Unhealthy)
159 (Unhealthy)
221 (Very Unhealthy)
237 (Very Unhealthy)
176 (Unhealthy)
125 (Unhealthy for Sensitive Groups)
119 (Moderate)
77 (Moderate)
43 (Good)
40 (Good)
63 (Good)
93 (Moderate)
pm10
75 (Unhealthy for Sensitive Groups)
81 (Unhealthy)
87 (Unhealthy)
84 (Unhealthy)
166 (Very bad Hazardous)
124 (Very Unhealthy)
133 (Very Unhealthy)
101 (Unhealthy)
75 (Unhealthy for Sensitive Groups)
62 (Unhealthy for Sensitive Groups)
78 (Unhealthy for Sensitive Groups)
84 (Unhealthy)
101 (Unhealthy)
118 (Very Unhealthy)
117 (Very Unhealthy)
196 (Very bad Hazardous)
223 (Very bad Hazardous)
172 (Very bad Hazardous)
233 (Very bad Hazardous)
152 (Very bad Hazardous)
so2
13 (Good)
11 (Good)
14 (Good)
11 (Good)
21 (Good)
17 (Good)
18 (Good)
11 (Good)
13 (Good)
11 (Good)
16 (Good)
19 (Good)
26 (Good)
21 (Good)
18 (Good)
26 (Good)
40 (Good)
27 (Good)
22 (Good)
26 (Good)
data source »
路桥公司
Friday, May 27, 2022, 12:00 PM
PM10 179 (Very bad Hazardous)
particulate matter (PM10) suspended dust
PM2,5 35 (Unhealthy for Sensitive Groups)
particulate matter (PM2.5) dust
O3 0.04 (Good)
ozone (O3)
NO2 0 (Good)
nitrogen dioxide (NO2)
SO2 0 (Good)
sulfur dioxide (SO2)
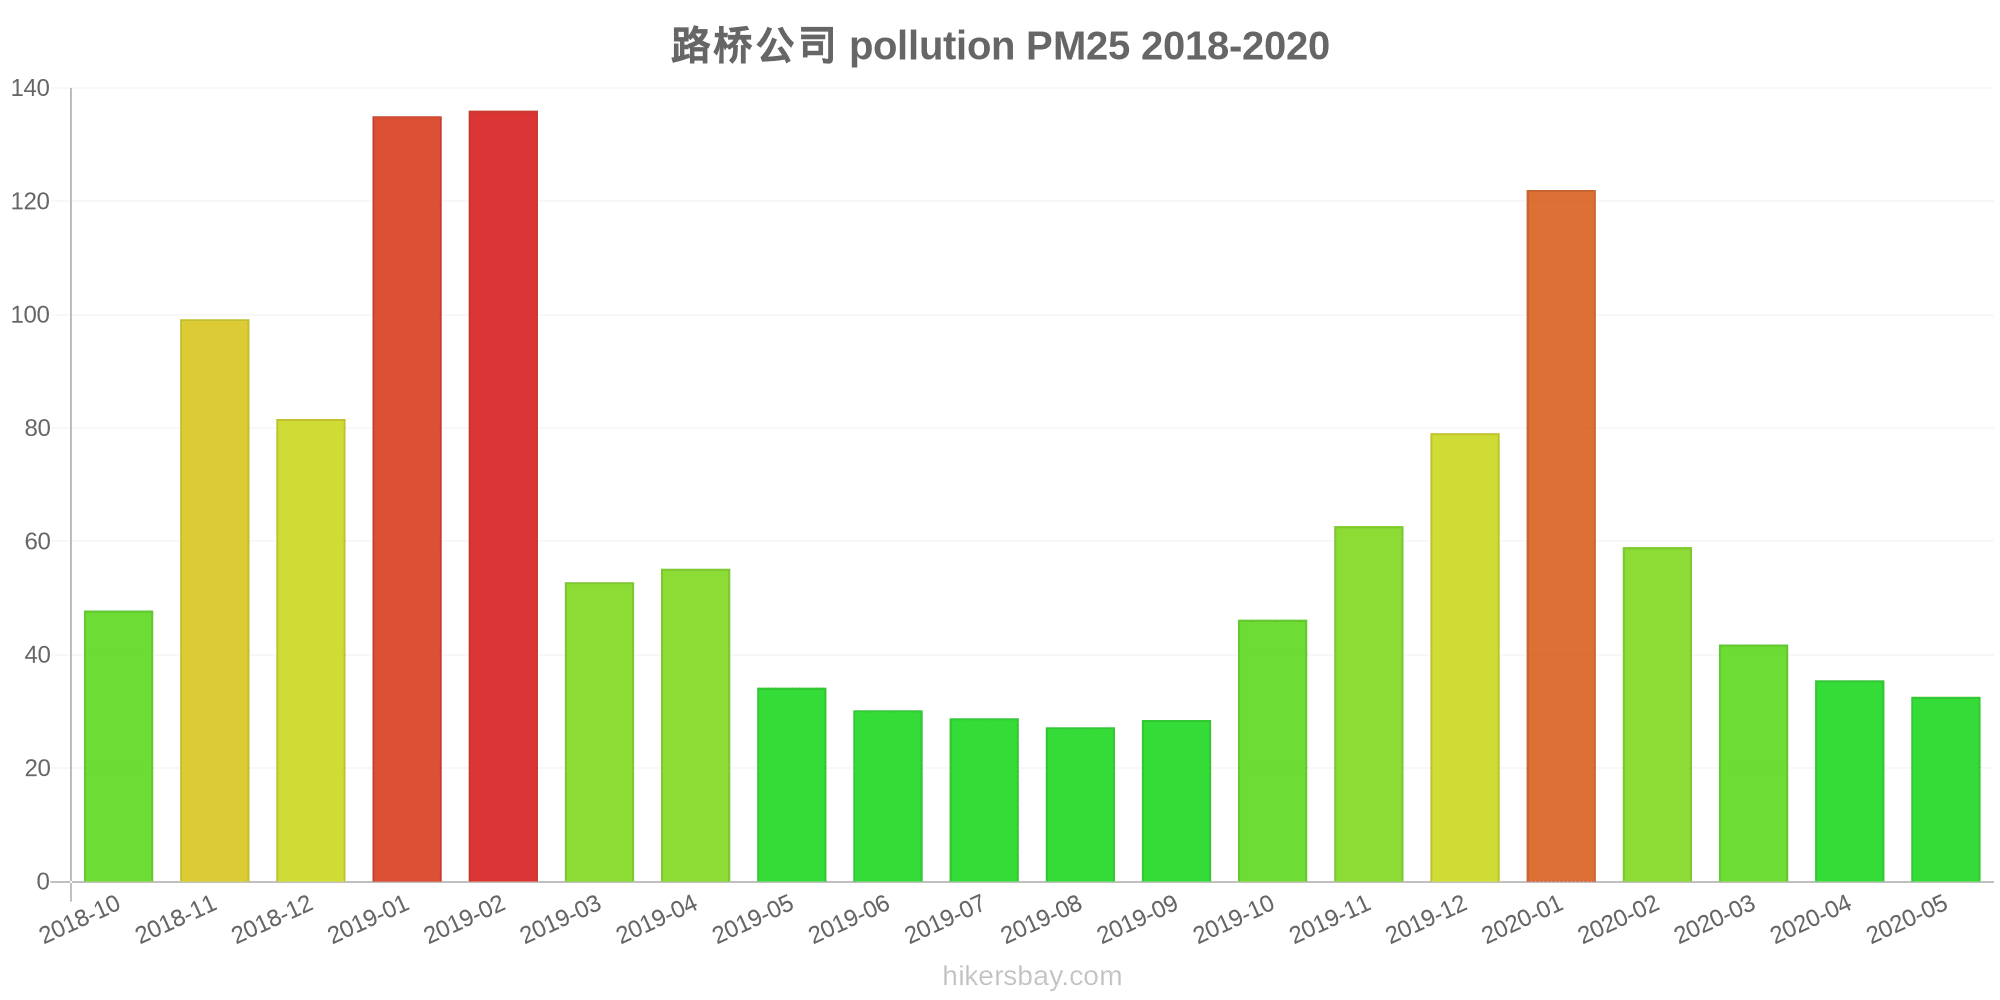
路桥公司
index
2022-05-27
pm10
56
pm25
56
o3
0.03
no2
0
so2
0
路桥公司
2018-10 2020-05

index
2020-05
2020-04
2020-03
2020-02
2020-01
2019-12
2019-11
2019-10
2019-09
2019-08
2019-07
2019-06
2019-05
2019-04
2019-03
2019-02
2019-01
2018-12
2018-11
2018-10
pm25
33
36
42
59
122
79
63
46
29
27
29
30
34
55
53
136
135
82
99
48
co
815
737
957
1
2
1
983
1
831
784
786
839
815
761
739
1
1
1
1
1
no2
27
37
39
25
55
59
63
53
44
34
32
35
40
43
38
47
71
57
64
64
o3
138
135
110
86
64
40
63
96
161
159
221
237
176
125
119
77
43
40
63
93
pm10
75
81
87
84
166
124
133
101
75
62
78
84
101
118
117
196
223
172
233
152
so2
13
11
14
11
21
17
18
11
13
11
16
19
26
21
18
26
40
27
22
26
* Pollution data source:
https://openaq.org
(ChinaAQIData)
The data is licensed under CC-By 4.0
PM10 179 (Very bad Hazardous)
PM2,5 35 (Unhealthy for Sensitive Groups)
O3 0 (Good)
NO2 0 (Good)
SO2 0 (Good)
Data on air pollution from recent days in Xianyu
| index | 2022-05-27 |
|---|---|
| pm10 | 56 Unhealthy for Sensitive Groups |
| pm25 | 56 Unhealthy |
| o3 | 0 Good |
| no2 | 0 Good |
| so2 | 0 Good |

| index | 2020-05 | 2020-04 | 2020-03 | 2020-02 | 2020-01 | 2019-12 | 2019-11 | 2019-10 | 2019-09 | 2019-08 | 2019-07 | 2019-06 | 2019-05 | 2019-04 | 2019-03 | 2019-02 | 2019-01 | 2018-12 | 2018-11 | 2018-10 |
|---|---|---|---|---|---|---|---|---|---|---|---|---|---|---|---|---|---|---|---|---|
| pm25 | 33 (Moderate) | 36 (Unhealthy for Sensitive Groups) | 42 (Unhealthy for Sensitive Groups) | 59 (Unhealthy) | 122 (Very bad Hazardous) | 79 (Very Unhealthy) | 63 (Unhealthy) | 46 (Unhealthy for Sensitive Groups) | 29 (Moderate) | 27 (Moderate) | 29 (Moderate) | 30 (Moderate) | 34 (Moderate) | 55 (Unhealthy) | 53 (Unhealthy for Sensitive Groups) | 136 (Very bad Hazardous) | 135 (Very bad Hazardous) | 82 (Very Unhealthy) | 99 (Very Unhealthy) | 48 (Unhealthy for Sensitive Groups) |
| co | 815 (Good) | 737 (Good) | 957 (Good) | 1 (Good) | 2 (Good) | 1 (Good) | 983 (Good) | 1 (Good) | 831 (Good) | 784 (Good) | 786 (Good) | 839 (Good) | 815 (Good) | 761 (Good) | 739 (Good) | 1 (Good) | 1 (Good) | 1 (Good) | 1 (Good) | 1 (Good) |
| no2 | 27 (Good) | 37 (Good) | 39 (Good) | 25 (Good) | 55 (Moderate) | 59 (Moderate) | 63 (Moderate) | 53 (Moderate) | 44 (Moderate) | 34 (Good) | 32 (Good) | 35 (Good) | 40 (Good) | 43 (Moderate) | 38 (Good) | 47 (Moderate) | 71 (Moderate) | 57 (Moderate) | 64 (Moderate) | 64 (Moderate) |
| o3 | 138 (Unhealthy for Sensitive Groups) | 135 (Unhealthy for Sensitive Groups) | 110 (Moderate) | 86 (Moderate) | 64 (Good) | 40 (Good) | 63 (Good) | 96 (Moderate) | 161 (Unhealthy) | 159 (Unhealthy) | 221 (Very Unhealthy) | 237 (Very Unhealthy) | 176 (Unhealthy) | 125 (Unhealthy for Sensitive Groups) | 119 (Moderate) | 77 (Moderate) | 43 (Good) | 40 (Good) | 63 (Good) | 93 (Moderate) |
| pm10 | 75 (Unhealthy for Sensitive Groups) | 81 (Unhealthy) | 87 (Unhealthy) | 84 (Unhealthy) | 166 (Very bad Hazardous) | 124 (Very Unhealthy) | 133 (Very Unhealthy) | 101 (Unhealthy) | 75 (Unhealthy for Sensitive Groups) | 62 (Unhealthy for Sensitive Groups) | 78 (Unhealthy for Sensitive Groups) | 84 (Unhealthy) | 101 (Unhealthy) | 118 (Very Unhealthy) | 117 (Very Unhealthy) | 196 (Very bad Hazardous) | 223 (Very bad Hazardous) | 172 (Very bad Hazardous) | 233 (Very bad Hazardous) | 152 (Very bad Hazardous) |
| so2 | 13 (Good) | 11 (Good) | 14 (Good) | 11 (Good) | 21 (Good) | 17 (Good) | 18 (Good) | 11 (Good) | 13 (Good) | 11 (Good) | 16 (Good) | 19 (Good) | 26 (Good) | 21 (Good) | 18 (Good) | 26 (Good) | 40 (Good) | 27 (Good) | 22 (Good) | 26 (Good) |
PM10 179 (Very bad Hazardous)
particulate matter (PM10) suspended dustPM2,5 35 (Unhealthy for Sensitive Groups)
particulate matter (PM2.5) dustO3 0.04 (Good)
ozone (O3)NO2 0 (Good)
nitrogen dioxide (NO2)SO2 0 (Good)
sulfur dioxide (SO2)路桥公司
| index | 2022-05-27 |
|---|---|
| pm10 | 56 |
| pm25 | 56 |
| o3 | 0.03 |
| no2 | 0 |
| so2 | 0 |
路桥公司
| index | 2020-05 | 2020-04 | 2020-03 | 2020-02 | 2020-01 | 2019-12 | 2019-11 | 2019-10 | 2019-09 | 2019-08 | 2019-07 | 2019-06 | 2019-05 | 2019-04 | 2019-03 | 2019-02 | 2019-01 | 2018-12 | 2018-11 | 2018-10 |
|---|---|---|---|---|---|---|---|---|---|---|---|---|---|---|---|---|---|---|---|---|
| pm25 | 33 | 36 | 42 | 59 | 122 | 79 | 63 | 46 | 29 | 27 | 29 | 30 | 34 | 55 | 53 | 136 | 135 | 82 | 99 | 48 |
| co | 815 | 737 | 957 | 1 | 2 | 1 | 983 | 1 | 831 | 784 | 786 | 839 | 815 | 761 | 739 | 1 | 1 | 1 | 1 | 1 |
| no2 | 27 | 37 | 39 | 25 | 55 | 59 | 63 | 53 | 44 | 34 | 32 | 35 | 40 | 43 | 38 | 47 | 71 | 57 | 64 | 64 |
| o3 | 138 | 135 | 110 | 86 | 64 | 40 | 63 | 96 | 161 | 159 | 221 | 237 | 176 | 125 | 119 | 77 | 43 | 40 | 63 | 93 |
| pm10 | 75 | 81 | 87 | 84 | 166 | 124 | 133 | 101 | 75 | 62 | 78 | 84 | 101 | 118 | 117 | 196 | 223 | 172 | 233 | 152 |
| so2 | 13 | 11 | 14 | 11 | 21 | 17 | 18 | 11 | 13 | 11 | 16 | 19 | 26 | 21 | 18 | 26 | 40 | 27 | 22 | 26 |