Air Pollution in Sanduzhuang: Real-time Air Quality Index and smog alert.
Pollution and air quality forecast for Sanduzhuang. Today is Tuesday, June 2, 2026. The following air pollution values have been recorded for Sanduzhuang:- particulate matter (PM10) suspended dust - 179 (Very bad Hazardous)
- particulate matter (PM2.5) dust - 35 (Unhealthy for Sensitive Groups)
- ozone (O3) - 0 (Good)
- nitrogen dioxide (NO2) - 0 (Good)
- sulfur dioxide (SO2) - 0 (Good)

What is the air quality in Sanduzhuang today? Is the air polluted in Sanduzhuang?. Is there smog?
What is the level of PM10 today in Sanduzhuang? (particulate matter (PM10) suspended dust)
The current level of particulate matter PM10 in Sanduzhuang is:
179 (Very bad Hazardous)
The highest PM10 values usually occur in month: 219 (November 2018).
The lowest value of particulate matter PM10 pollution in Sanduzhuang is usually recorded in: August (40).
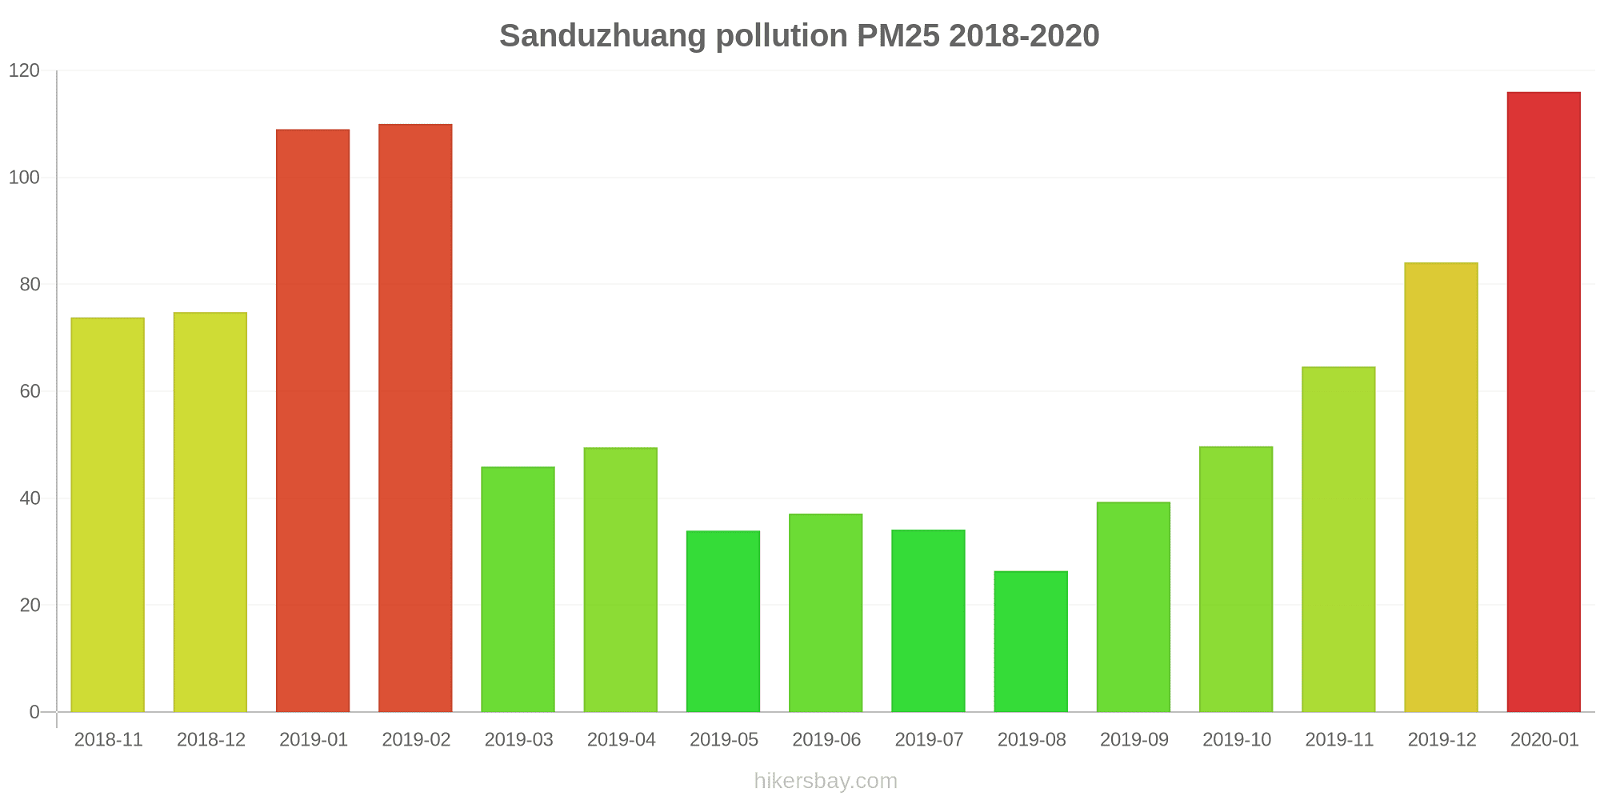
What is the current level of PM2.5 in Sanduzhuang? (particulate matter (PM2.5) dust)
Today's PM2.5 level is:
35 (Unhealthy for Sensitive Groups)
For comparison, the highest level of PM2.5 in Sanduzhuang in the last 7 days was: 56 (Friday, May 27, 2022) and the lowest: 56 (Friday, May 27, 2022).
The highest PM2.5 values were recorded: 116 (January 2020).
The lowest level of particulate matter PM2.5 pollution occurs in month: August (26).
How is the O3 level today in Sanduzhuang? (ozone (O3))
0 (Good)
How high is the level of NO2? (nitrogen dioxide (NO2))
0 (Good)
What is the level of SO2 pollution? (sulfur dioxide (SO2))
0 (Good)
Current data Friday, May 27, 2022, 12:00 PM
PM10 179 (Very bad Hazardous)
PM2,5 35 (Unhealthy for Sensitive Groups)
O3 0 (Good)
NO2 0 (Good)
SO2 0 (Good)
Data on air pollution from recent days in Sanduzhuang
index
2022-05-27
pm10
56
Unhealthy for Sensitive Groups
pm25
56
Unhealthy
o3
0
Good
no2
0
Good
so2
0
Good
data source »
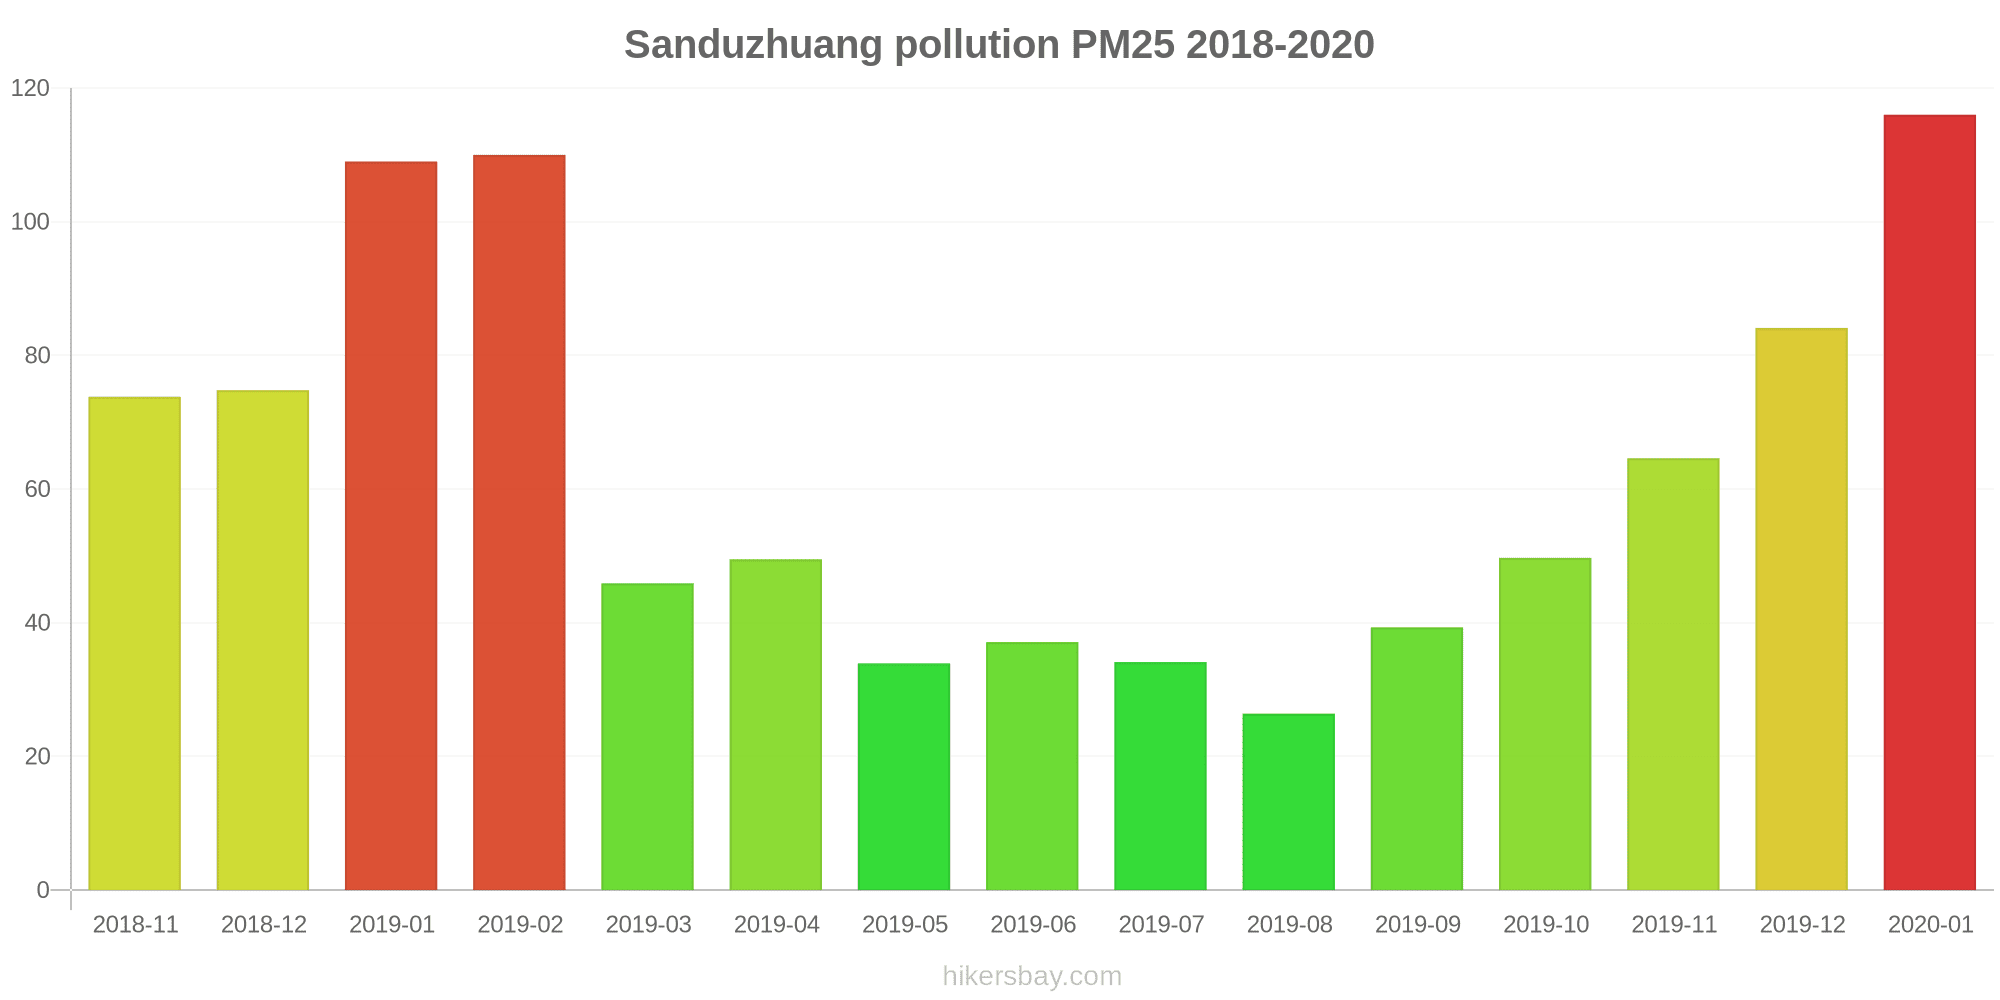
Air pollution in Sanduzhuang from November 2018 to January 2020
index
2020-01
2019-12
2019-11
2019-10
2019-09
2019-08
2019-07
2019-06
2019-05
2019-04
2019-03
2019-02
2019-01
2018-12
2018-11
pm25
116 (Very bad Hazardous)
84 (Very Unhealthy)
65 (Unhealthy)
50 (Unhealthy for Sensitive Groups)
39 (Unhealthy for Sensitive Groups)
26 (Moderate)
34 (Moderate)
37 (Unhealthy for Sensitive Groups)
34 (Moderate)
50 (Unhealthy for Sensitive Groups)
46 (Unhealthy for Sensitive Groups)
110 (Very bad Hazardous)
109 (Very Unhealthy)
75 (Unhealthy)
74 (Unhealthy)
co
1 (Good)
1 (Good)
907 (Good)
707 (Good)
681 (Good)
574 (Good)
566 (Good)
586 (Good)
519 (Good)
724 (Good)
594 (Good)
1 (Good)
1 (Good)
1 (Good)
1 (Good)
no2
60 (Moderate)
50 (Moderate)
51 (Moderate)
41 (Moderate)
32 (Good)
23 (Good)
20 (Good)
23 (Good)
24 (Good)
28 (Good)
31 (Good)
35 (Good)
58 (Moderate)
50 (Moderate)
47 (Moderate)
o3
52 (Good)
43 (Good)
61 (Good)
104 (Moderate)
157 (Unhealthy)
149 (Unhealthy for Sensitive Groups)
198 (Very Unhealthy)
224 (Very Unhealthy)
180 (Very Unhealthy)
142 (Unhealthy for Sensitive Groups)
127 (Unhealthy for Sensitive Groups)
97 (Moderate)
67 (Good)
55 (Good)
60 (Good)
pm10
147 (Very Unhealthy)
123 (Very Unhealthy)
123 (Very Unhealthy)
94 (Unhealthy)
68 (Unhealthy for Sensitive Groups)
40 (Moderate)
53 (Unhealthy for Sensitive Groups)
72 (Unhealthy for Sensitive Groups)
77 (Unhealthy for Sensitive Groups)
98 (Unhealthy)
99 (Unhealthy)
152 (Very bad Hazardous)
161 (Very bad Hazardous)
132 (Very Unhealthy)
219 (Very bad Hazardous)
so2
16 (Good)
11 (Good)
14 (Good)
9.8 (Good)
8.4 (Good)
7.3 (Good)
7.2 (Good)
12 (Good)
15 (Good)
12 (Good)
13 (Good)
16 (Good)
29 (Good)
21 (Good)
12 (Good)
data source »
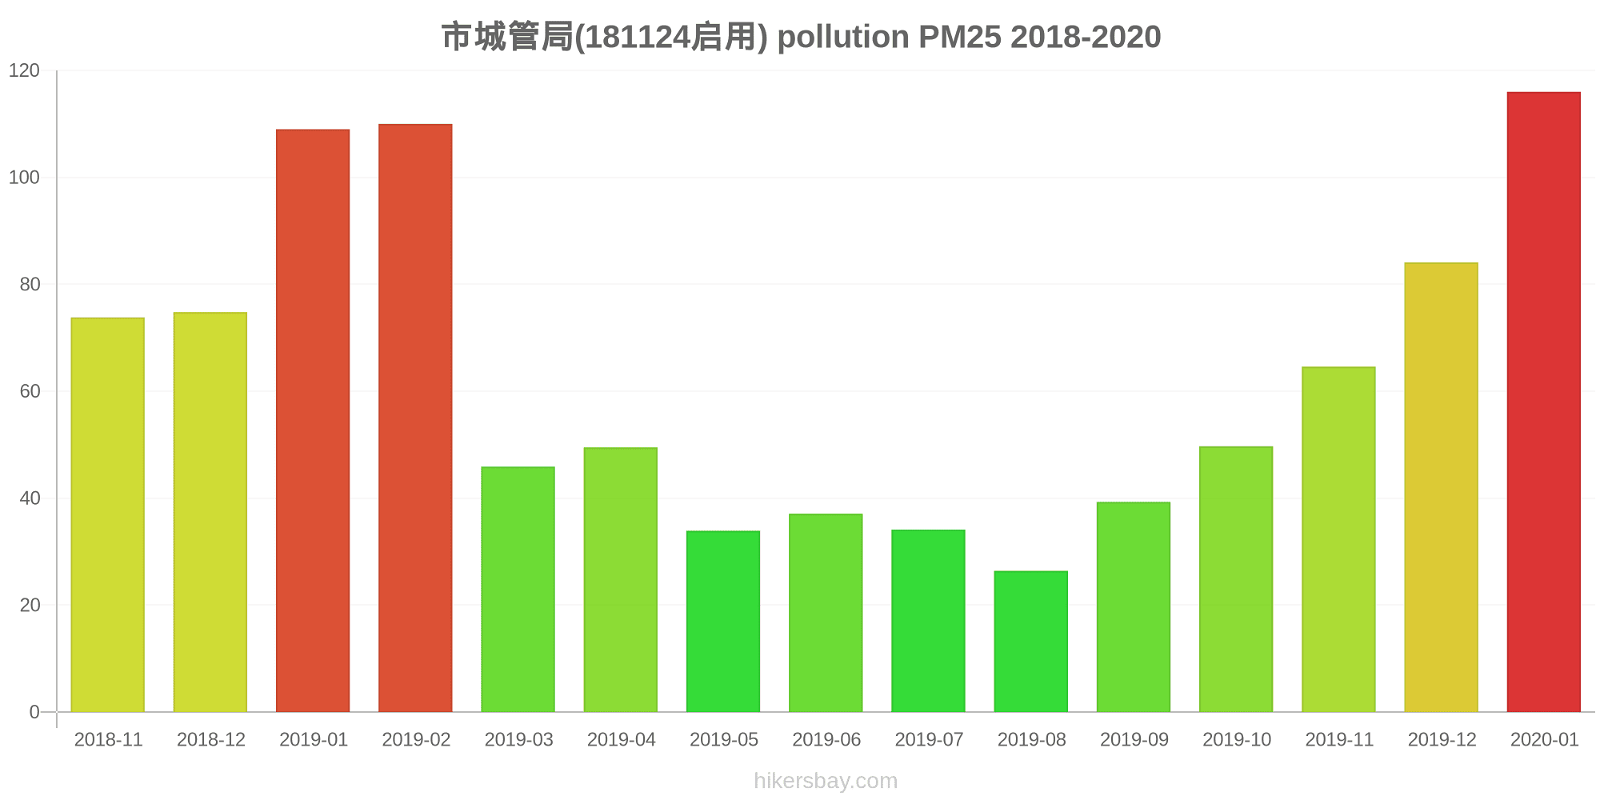
市城管局(181124启用)
Friday, May 27, 2022, 12:00 PM
PM10 179 (Very bad Hazardous)
particulate matter (PM10) suspended dust
PM2,5 35 (Unhealthy for Sensitive Groups)
particulate matter (PM2.5) dust
O3 0.04 (Good)
ozone (O3)
NO2 0 (Good)
nitrogen dioxide (NO2)
SO2 0 (Good)
sulfur dioxide (SO2)
市城管局(181124启用)
index
2022-05-27
pm10
56
pm25
56
o3
0.03
no2
0
so2
0
市城管局(181124启用)
2018-11 2020-01
index
2020-01
2019-12
2019-11
2019-10
2019-09
2019-08
2019-07
2019-06
2019-05
2019-04
2019-03
2019-02
2019-01
2018-12
2018-11
pm25
116
84
65
50
39
26
34
37
34
50
46
110
109
75
74
co
1
1
907
707
681
574
566
586
519
724
594
1
1
1
1
no2
60
50
51
41
32
23
20
23
24
28
31
35
58
50
47
o3
52
43
61
104
157
149
198
224
180
142
127
97
67
55
60
pm10
147
123
123
94
68
40
53
72
77
98
99
152
161
132
219
so2
16
11
14
9.8
8.4
7.3
7.2
12
15
12
13
16
29
21
12
* Pollution data source:
https://openaq.org
()
The data is licensed under CC-By 4.0
PM10 179 (Very bad Hazardous)
PM2,5 35 (Unhealthy for Sensitive Groups)
O3 0 (Good)
NO2 0 (Good)
SO2 0 (Good)
Data on air pollution from recent days in Sanduzhuang
| index | 2022-05-27 |
|---|---|
| pm10 | 56 Unhealthy for Sensitive Groups |
| pm25 | 56 Unhealthy |
| o3 | 0 Good |
| no2 | 0 Good |
| so2 | 0 Good |
| index | 2020-01 | 2019-12 | 2019-11 | 2019-10 | 2019-09 | 2019-08 | 2019-07 | 2019-06 | 2019-05 | 2019-04 | 2019-03 | 2019-02 | 2019-01 | 2018-12 | 2018-11 |
|---|---|---|---|---|---|---|---|---|---|---|---|---|---|---|---|
| pm25 | 116 (Very bad Hazardous) | 84 (Very Unhealthy) | 65 (Unhealthy) | 50 (Unhealthy for Sensitive Groups) | 39 (Unhealthy for Sensitive Groups) | 26 (Moderate) | 34 (Moderate) | 37 (Unhealthy for Sensitive Groups) | 34 (Moderate) | 50 (Unhealthy for Sensitive Groups) | 46 (Unhealthy for Sensitive Groups) | 110 (Very bad Hazardous) | 109 (Very Unhealthy) | 75 (Unhealthy) | 74 (Unhealthy) |
| co | 1 (Good) | 1 (Good) | 907 (Good) | 707 (Good) | 681 (Good) | 574 (Good) | 566 (Good) | 586 (Good) | 519 (Good) | 724 (Good) | 594 (Good) | 1 (Good) | 1 (Good) | 1 (Good) | 1 (Good) |
| no2 | 60 (Moderate) | 50 (Moderate) | 51 (Moderate) | 41 (Moderate) | 32 (Good) | 23 (Good) | 20 (Good) | 23 (Good) | 24 (Good) | 28 (Good) | 31 (Good) | 35 (Good) | 58 (Moderate) | 50 (Moderate) | 47 (Moderate) |
| o3 | 52 (Good) | 43 (Good) | 61 (Good) | 104 (Moderate) | 157 (Unhealthy) | 149 (Unhealthy for Sensitive Groups) | 198 (Very Unhealthy) | 224 (Very Unhealthy) | 180 (Very Unhealthy) | 142 (Unhealthy for Sensitive Groups) | 127 (Unhealthy for Sensitive Groups) | 97 (Moderate) | 67 (Good) | 55 (Good) | 60 (Good) |
| pm10 | 147 (Very Unhealthy) | 123 (Very Unhealthy) | 123 (Very Unhealthy) | 94 (Unhealthy) | 68 (Unhealthy for Sensitive Groups) | 40 (Moderate) | 53 (Unhealthy for Sensitive Groups) | 72 (Unhealthy for Sensitive Groups) | 77 (Unhealthy for Sensitive Groups) | 98 (Unhealthy) | 99 (Unhealthy) | 152 (Very bad Hazardous) | 161 (Very bad Hazardous) | 132 (Very Unhealthy) | 219 (Very bad Hazardous) |
| so2 | 16 (Good) | 11 (Good) | 14 (Good) | 9.8 (Good) | 8.4 (Good) | 7.3 (Good) | 7.2 (Good) | 12 (Good) | 15 (Good) | 12 (Good) | 13 (Good) | 16 (Good) | 29 (Good) | 21 (Good) | 12 (Good) |
PM10 179 (Very bad Hazardous)
particulate matter (PM10) suspended dustPM2,5 35 (Unhealthy for Sensitive Groups)
particulate matter (PM2.5) dustO3 0.04 (Good)
ozone (O3)NO2 0 (Good)
nitrogen dioxide (NO2)SO2 0 (Good)
sulfur dioxide (SO2)市城管局(181124启用)
| index | 2022-05-27 |
|---|---|
| pm10 | 56 |
| pm25 | 56 |
| o3 | 0.03 |
| no2 | 0 |
| so2 | 0 |
市城管局(181124启用)

| index | 2020-01 | 2019-12 | 2019-11 | 2019-10 | 2019-09 | 2019-08 | 2019-07 | 2019-06 | 2019-05 | 2019-04 | 2019-03 | 2019-02 | 2019-01 | 2018-12 | 2018-11 |
|---|---|---|---|---|---|---|---|---|---|---|---|---|---|---|---|
| pm25 | 116 | 84 | 65 | 50 | 39 | 26 | 34 | 37 | 34 | 50 | 46 | 110 | 109 | 75 | 74 |
| co | 1 | 1 | 907 | 707 | 681 | 574 | 566 | 586 | 519 | 724 | 594 | 1 | 1 | 1 | 1 |
| no2 | 60 | 50 | 51 | 41 | 32 | 23 | 20 | 23 | 24 | 28 | 31 | 35 | 58 | 50 | 47 |
| o3 | 52 | 43 | 61 | 104 | 157 | 149 | 198 | 224 | 180 | 142 | 127 | 97 | 67 | 55 | 60 |
| pm10 | 147 | 123 | 123 | 94 | 68 | 40 | 53 | 72 | 77 | 98 | 99 | 152 | 161 | 132 | 219 |
| so2 | 16 | 11 | 14 | 9.8 | 8.4 | 7.3 | 7.2 | 12 | 15 | 12 | 13 | 16 | 29 | 21 | 12 |