Air Pollution in Xiaojiatun: Real-time Air Quality Index and smog alert.
Pollution and air quality forecast for Xiaojiatun. Today is Tuesday, June 2, 2026. The following air pollution values have been recorded for Xiaojiatun:- particulate matter (PM10) suspended dust - 179 (Very bad Hazardous)
- particulate matter (PM2.5) dust - 35 (Unhealthy for Sensitive Groups)
- ozone (O3) - 0 (Good)
- nitrogen dioxide (NO2) - 0 (Good)
- sulfur dioxide (SO2) - 0 (Good)

What is the air quality in Xiaojiatun today? Is the air polluted in Xiaojiatun?. Is there smog?
What is the level of PM10 today in Xiaojiatun? (particulate matter (PM10) suspended dust)
The current level of particulate matter PM10 in Xiaojiatun is:
179 (Very bad Hazardous)
The highest PM10 values usually occur in month: 146 (January 2019).
The lowest value of particulate matter PM10 pollution in Xiaojiatun is usually recorded in: July (42).
What is the current level of PM2.5 in Xiaojiatun? (particulate matter (PM2.5) dust)
Today's PM2.5 level is:
35 (Unhealthy for Sensitive Groups)
For comparison, the highest level of PM2.5 in Xiaojiatun in the last 7 days was: 56 (Friday, May 27, 2022) and the lowest: 56 (Friday, May 27, 2022).
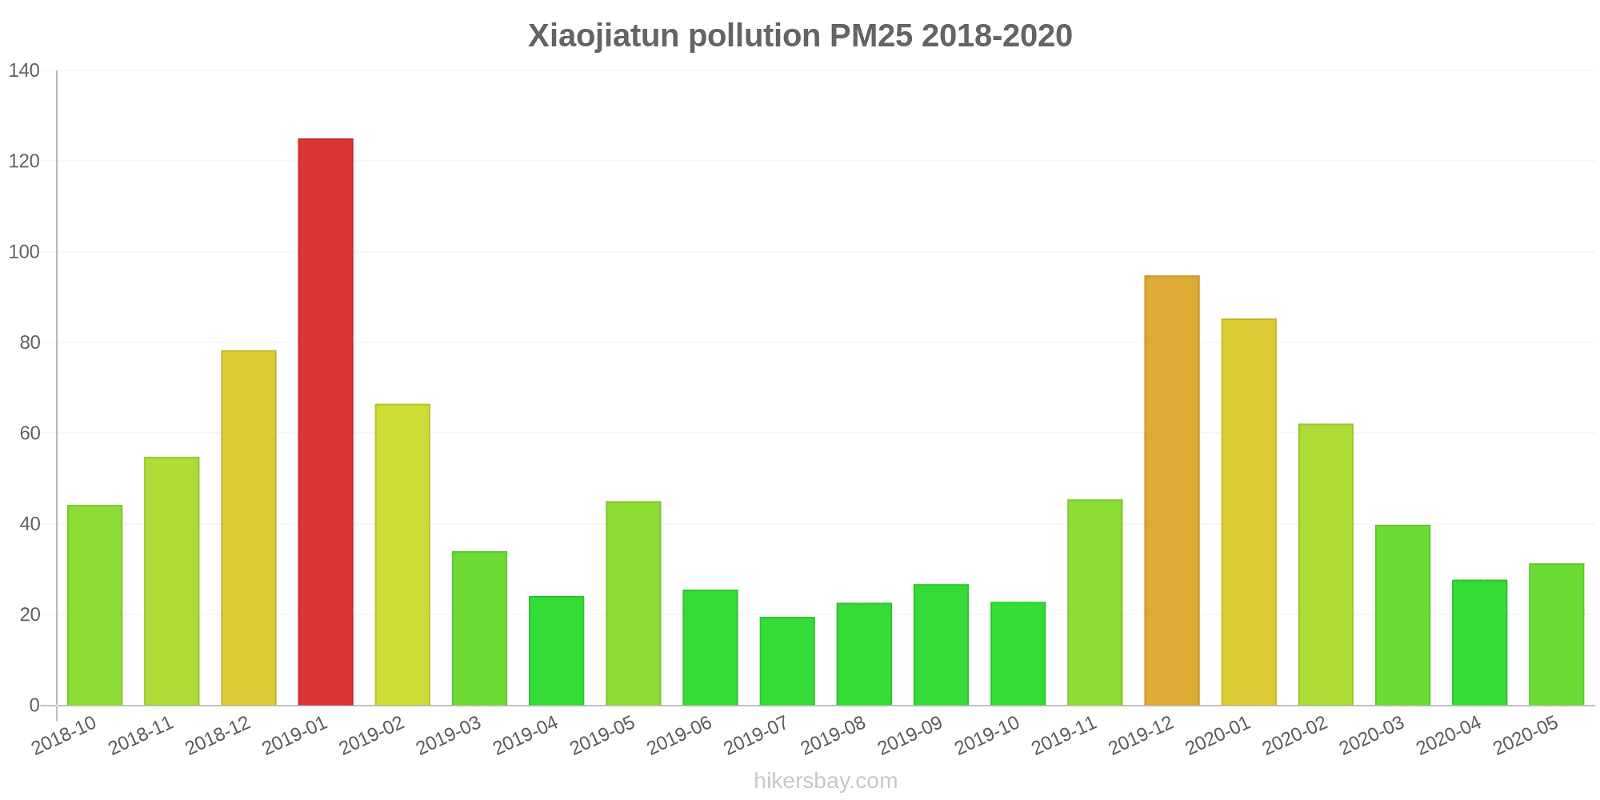
The highest PM2.5 values were recorded: 125 (January 2019).
The lowest level of particulate matter PM2.5 pollution occurs in month: July (20).
How is the O3 level today in Xiaojiatun? (ozone (O3))
0 (Good)
How high is the level of NO2? (nitrogen dioxide (NO2))
0 (Good)
What is the level of SO2 pollution? (sulfur dioxide (SO2))
0 (Good)
Current data Friday, May 27, 2022, 12:00 PM
PM10 179 (Very bad Hazardous)
PM2,5 35 (Unhealthy for Sensitive Groups)
O3 0 (Good)
NO2 0 (Good)
SO2 0 (Good)
Data on air pollution from recent days in Xiaojiatun
index
2022-05-27
pm10
56
Unhealthy for Sensitive Groups
pm25
56
Unhealthy
o3
0
Good
no2
0
Good
so2
0
Good
data source »
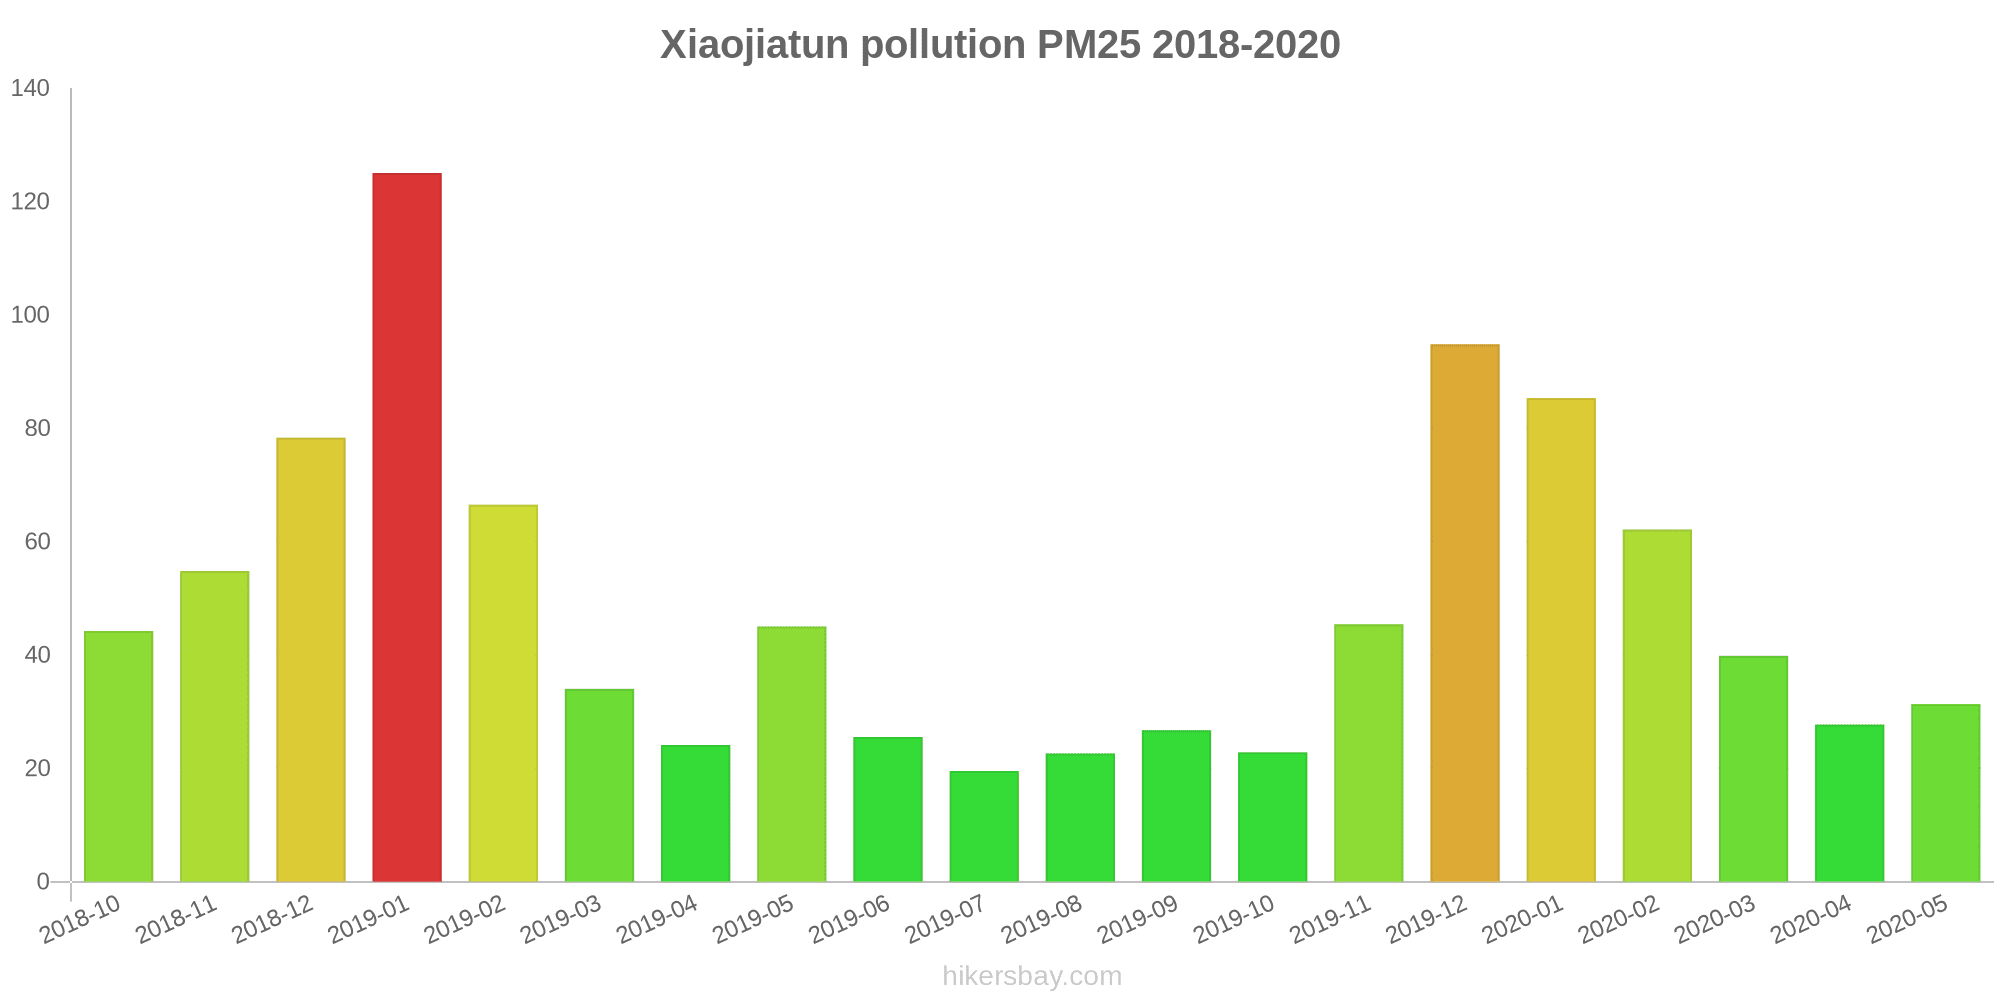
Air pollution in Xiaojiatun from October 2018 to May 2020
index
2020-05
2020-04
2020-03
2020-02
2020-01
2019-12
2019-11
2019-10
2019-09
2019-08
2019-07
2019-06
2019-05
2019-04
2019-03
2019-02
2019-01
2018-12
2018-11
2018-10
pm25
31 (Moderate)
28 (Moderate)
40 (Unhealthy for Sensitive Groups)
62 (Unhealthy)
85 (Very Unhealthy)
95 (Very Unhealthy)
45 (Unhealthy for Sensitive Groups)
23 (Moderate)
27 (Moderate)
23 (Moderate)
20 (Moderate)
26 (Moderate)
45 (Unhealthy for Sensitive Groups)
24 (Moderate)
34 (Moderate)
67 (Unhealthy)
125 (Very bad Hazardous)
78 (Very Unhealthy)
55 (Unhealthy for Sensitive Groups)
44 (Unhealthy for Sensitive Groups)
co
796 (Good)
813 (Good)
870 (Good)
1 (Good)
1 (Good)
1 (Good)
1 (Good)
898 (Good)
862 (Good)
876 (Good)
947 (Good)
1 (Good)
1 (Good)
937 (Good)
1 (Good)
1 (Good)
1 (Good)
1 (Good)
1 (Good)
907 (Good)
no2
20 (Good)
29 (Good)
31 (Good)
21 (Good)
29 (Good)
42 (Moderate)
31 (Good)
23 (Good)
18 (Good)
13 (Good)
17 (Good)
16 (Good)
21 (Good)
26 (Good)
29 (Good)
21 (Good)
44 (Moderate)
36 (Good)
35 (Good)
32 (Good)
o3
145 (Unhealthy for Sensitive Groups)
116 (Moderate)
93 (Moderate)
84 (Moderate)
59 (Good)
37 (Good)
50 (Good)
59 (Good)
90 (Moderate)
126 (Unhealthy for Sensitive Groups)
116 (Moderate)
118 (Moderate)
115 (Moderate)
116 (Moderate)
92 (Moderate)
80 (Moderate)
56 (Good)
41 (Good)
58 (Good)
76 (Moderate)
pm10
62 (Unhealthy for Sensitive Groups)
56 (Unhealthy for Sensitive Groups)
81 (Unhealthy)
82 (Unhealthy)
101 (Unhealthy)
128 (Very Unhealthy)
76 (Unhealthy for Sensitive Groups)
43 (Moderate)
48 (Moderate)
44 (Moderate)
42 (Moderate)
50 (Unhealthy for Sensitive Groups)
108 (Unhealthy)
58 (Unhealthy for Sensitive Groups)
80 (Unhealthy for Sensitive Groups)
100 (Unhealthy)
146 (Very Unhealthy)
138 (Very Unhealthy)
87 (Unhealthy)
78 (Unhealthy for Sensitive Groups)
so2
16 (Good)
17 (Good)
14 (Good)
12 (Good)
12 (Good)
17 (Good)
14 (Good)
11 (Good)
10 (Good)
13 (Good)
18 (Good)
11 (Good)
17 (Good)
9.6 (Good)
12 (Good)
12 (Good)
15 (Good)
11 (Good)
12 (Good)
11 (Good)
data source »
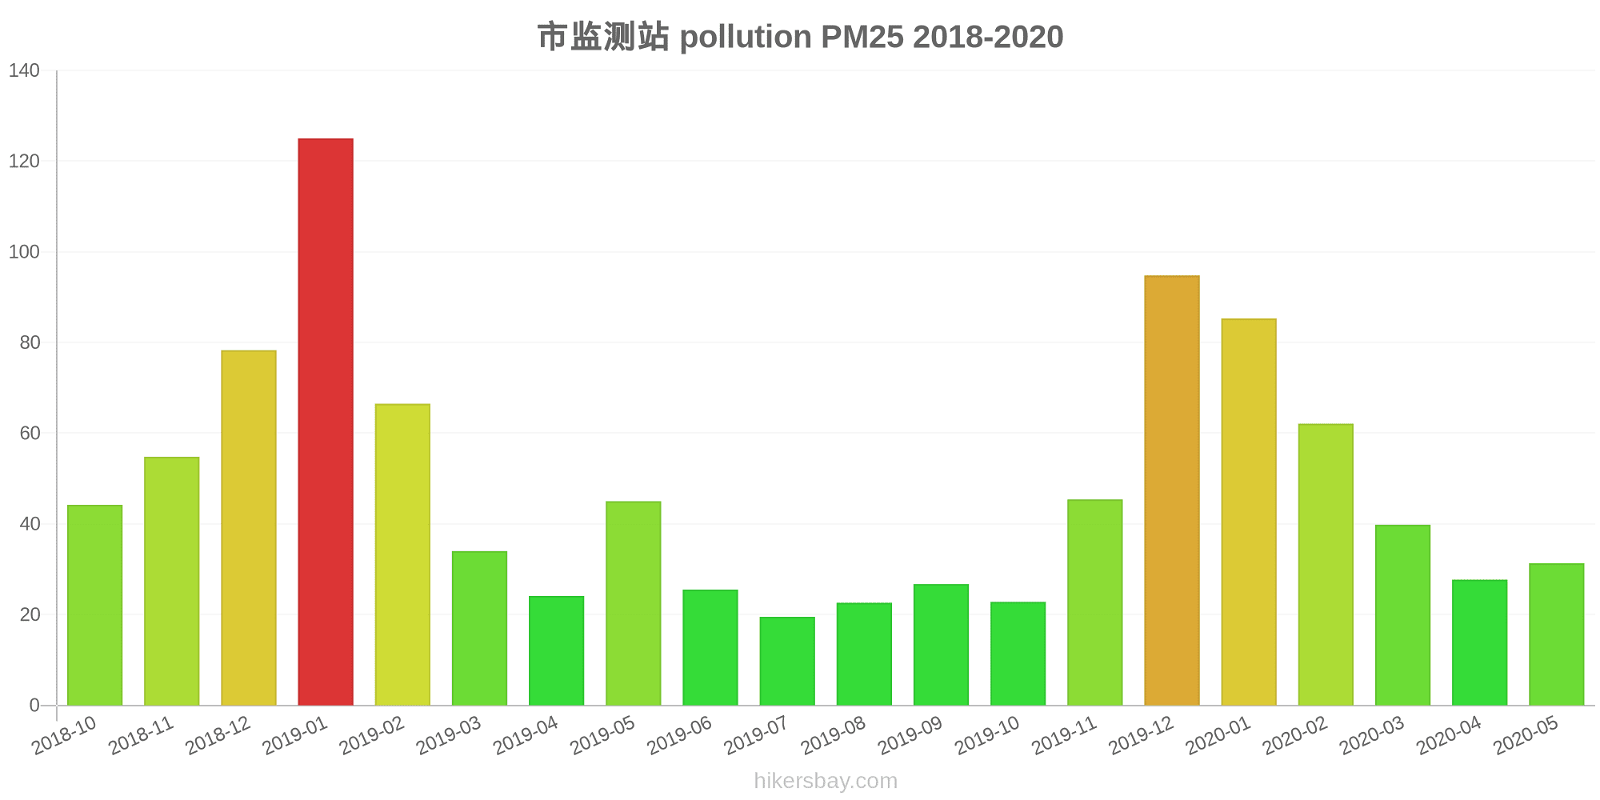
市监测站
Friday, May 27, 2022, 12:00 PM
PM10 179 (Very bad Hazardous)
particulate matter (PM10) suspended dust
PM2,5 35 (Unhealthy for Sensitive Groups)
particulate matter (PM2.5) dust
O3 0.04 (Good)
ozone (O3)
NO2 0 (Good)
nitrogen dioxide (NO2)
SO2 0 (Good)
sulfur dioxide (SO2)
市监测站
index
2022-05-27
pm10
56
pm25
56
o3
0.03
no2
0
so2
0
市监测站
2018-10 2020-05
index
2020-05
2020-04
2020-03
2020-02
2020-01
2019-12
2019-11
2019-10
2019-09
2019-08
2019-07
2019-06
2019-05
2019-04
2019-03
2019-02
2019-01
2018-12
2018-11
2018-10
pm25
31
28
40
62
85
95
45
23
27
23
20
26
45
24
34
67
125
78
55
44
co
796
813
870
1
1
1
1
898
862
876
947
1
1
937
1
1
1
1
1
907
no2
20
29
31
21
29
42
31
23
18
13
17
16
21
26
29
21
44
36
35
32
o3
145
116
93
84
59
37
50
59
90
126
116
118
115
116
92
80
56
41
58
76
pm10
62
56
81
82
101
128
76
43
48
44
42
50
108
58
80
100
146
138
87
78
so2
16
17
14
12
12
17
14
11
10
13
18
11
17
9.6
12
12
15
11
12
11
* Pollution data source:
https://openaq.org
(ChinaAQIData)
The data is licensed under CC-By 4.0
PM10 179 (Very bad Hazardous)
PM2,5 35 (Unhealthy for Sensitive Groups)
O3 0 (Good)
NO2 0 (Good)
SO2 0 (Good)
Data on air pollution from recent days in Xiaojiatun
| index | 2022-05-27 |
|---|---|
| pm10 | 56 Unhealthy for Sensitive Groups |
| pm25 | 56 Unhealthy |
| o3 | 0 Good |
| no2 | 0 Good |
| so2 | 0 Good |
| index | 2020-05 | 2020-04 | 2020-03 | 2020-02 | 2020-01 | 2019-12 | 2019-11 | 2019-10 | 2019-09 | 2019-08 | 2019-07 | 2019-06 | 2019-05 | 2019-04 | 2019-03 | 2019-02 | 2019-01 | 2018-12 | 2018-11 | 2018-10 |
|---|---|---|---|---|---|---|---|---|---|---|---|---|---|---|---|---|---|---|---|---|
| pm25 | 31 (Moderate) | 28 (Moderate) | 40 (Unhealthy for Sensitive Groups) | 62 (Unhealthy) | 85 (Very Unhealthy) | 95 (Very Unhealthy) | 45 (Unhealthy for Sensitive Groups) | 23 (Moderate) | 27 (Moderate) | 23 (Moderate) | 20 (Moderate) | 26 (Moderate) | 45 (Unhealthy for Sensitive Groups) | 24 (Moderate) | 34 (Moderate) | 67 (Unhealthy) | 125 (Very bad Hazardous) | 78 (Very Unhealthy) | 55 (Unhealthy for Sensitive Groups) | 44 (Unhealthy for Sensitive Groups) |
| co | 796 (Good) | 813 (Good) | 870 (Good) | 1 (Good) | 1 (Good) | 1 (Good) | 1 (Good) | 898 (Good) | 862 (Good) | 876 (Good) | 947 (Good) | 1 (Good) | 1 (Good) | 937 (Good) | 1 (Good) | 1 (Good) | 1 (Good) | 1 (Good) | 1 (Good) | 907 (Good) |
| no2 | 20 (Good) | 29 (Good) | 31 (Good) | 21 (Good) | 29 (Good) | 42 (Moderate) | 31 (Good) | 23 (Good) | 18 (Good) | 13 (Good) | 17 (Good) | 16 (Good) | 21 (Good) | 26 (Good) | 29 (Good) | 21 (Good) | 44 (Moderate) | 36 (Good) | 35 (Good) | 32 (Good) |
| o3 | 145 (Unhealthy for Sensitive Groups) | 116 (Moderate) | 93 (Moderate) | 84 (Moderate) | 59 (Good) | 37 (Good) | 50 (Good) | 59 (Good) | 90 (Moderate) | 126 (Unhealthy for Sensitive Groups) | 116 (Moderate) | 118 (Moderate) | 115 (Moderate) | 116 (Moderate) | 92 (Moderate) | 80 (Moderate) | 56 (Good) | 41 (Good) | 58 (Good) | 76 (Moderate) |
| pm10 | 62 (Unhealthy for Sensitive Groups) | 56 (Unhealthy for Sensitive Groups) | 81 (Unhealthy) | 82 (Unhealthy) | 101 (Unhealthy) | 128 (Very Unhealthy) | 76 (Unhealthy for Sensitive Groups) | 43 (Moderate) | 48 (Moderate) | 44 (Moderate) | 42 (Moderate) | 50 (Unhealthy for Sensitive Groups) | 108 (Unhealthy) | 58 (Unhealthy for Sensitive Groups) | 80 (Unhealthy for Sensitive Groups) | 100 (Unhealthy) | 146 (Very Unhealthy) | 138 (Very Unhealthy) | 87 (Unhealthy) | 78 (Unhealthy for Sensitive Groups) |
| so2 | 16 (Good) | 17 (Good) | 14 (Good) | 12 (Good) | 12 (Good) | 17 (Good) | 14 (Good) | 11 (Good) | 10 (Good) | 13 (Good) | 18 (Good) | 11 (Good) | 17 (Good) | 9.6 (Good) | 12 (Good) | 12 (Good) | 15 (Good) | 11 (Good) | 12 (Good) | 11 (Good) |
PM10 179 (Very bad Hazardous)
particulate matter (PM10) suspended dustPM2,5 35 (Unhealthy for Sensitive Groups)
particulate matter (PM2.5) dustO3 0.04 (Good)
ozone (O3)NO2 0 (Good)
nitrogen dioxide (NO2)SO2 0 (Good)
sulfur dioxide (SO2)市监测站
| index | 2022-05-27 |
|---|---|
| pm10 | 56 |
| pm25 | 56 |
| o3 | 0.03 |
| no2 | 0 |
| so2 | 0 |
市监测站

| index | 2020-05 | 2020-04 | 2020-03 | 2020-02 | 2020-01 | 2019-12 | 2019-11 | 2019-10 | 2019-09 | 2019-08 | 2019-07 | 2019-06 | 2019-05 | 2019-04 | 2019-03 | 2019-02 | 2019-01 | 2018-12 | 2018-11 | 2018-10 |
|---|---|---|---|---|---|---|---|---|---|---|---|---|---|---|---|---|---|---|---|---|
| pm25 | 31 | 28 | 40 | 62 | 85 | 95 | 45 | 23 | 27 | 23 | 20 | 26 | 45 | 24 | 34 | 67 | 125 | 78 | 55 | 44 |
| co | 796 | 813 | 870 | 1 | 1 | 1 | 1 | 898 | 862 | 876 | 947 | 1 | 1 | 937 | 1 | 1 | 1 | 1 | 1 | 907 |
| no2 | 20 | 29 | 31 | 21 | 29 | 42 | 31 | 23 | 18 | 13 | 17 | 16 | 21 | 26 | 29 | 21 | 44 | 36 | 35 | 32 |
| o3 | 145 | 116 | 93 | 84 | 59 | 37 | 50 | 59 | 90 | 126 | 116 | 118 | 115 | 116 | 92 | 80 | 56 | 41 | 58 | 76 |
| pm10 | 62 | 56 | 81 | 82 | 101 | 128 | 76 | 43 | 48 | 44 | 42 | 50 | 108 | 58 | 80 | 100 | 146 | 138 | 87 | 78 |
| so2 | 16 | 17 | 14 | 12 | 12 | 17 | 14 | 11 | 10 | 13 | 18 | 11 | 17 | 9.6 | 12 | 12 | 15 | 11 | 12 | 11 |