Air Pollution in Weijia: Real-time Air Quality Index and smog alert.
Pollution and air quality forecast for Weijia. Today is Tuesday, June 2, 2026. The following air pollution values have been recorded for Weijia:- particulate matter (PM10) suspended dust - 179 (Very bad Hazardous)
- particulate matter (PM2.5) dust - 35 (Unhealthy for Sensitive Groups)
- ozone (O3) - 0 (Good)
- nitrogen dioxide (NO2) - 0 (Good)
- sulfur dioxide (SO2) - 0 (Good)

What is the air quality in Weijia today? Is the air polluted in Weijia?. Is there smog?
What is the level of PM10 today in Weijia? (particulate matter (PM10) suspended dust)
The current level of particulate matter PM10 in Weijia is:
179 (Very bad Hazardous)
The highest PM10 values usually occur in month: 161 (January 2019).
The lowest value of particulate matter PM10 pollution in Weijia is usually recorded in: August (45).
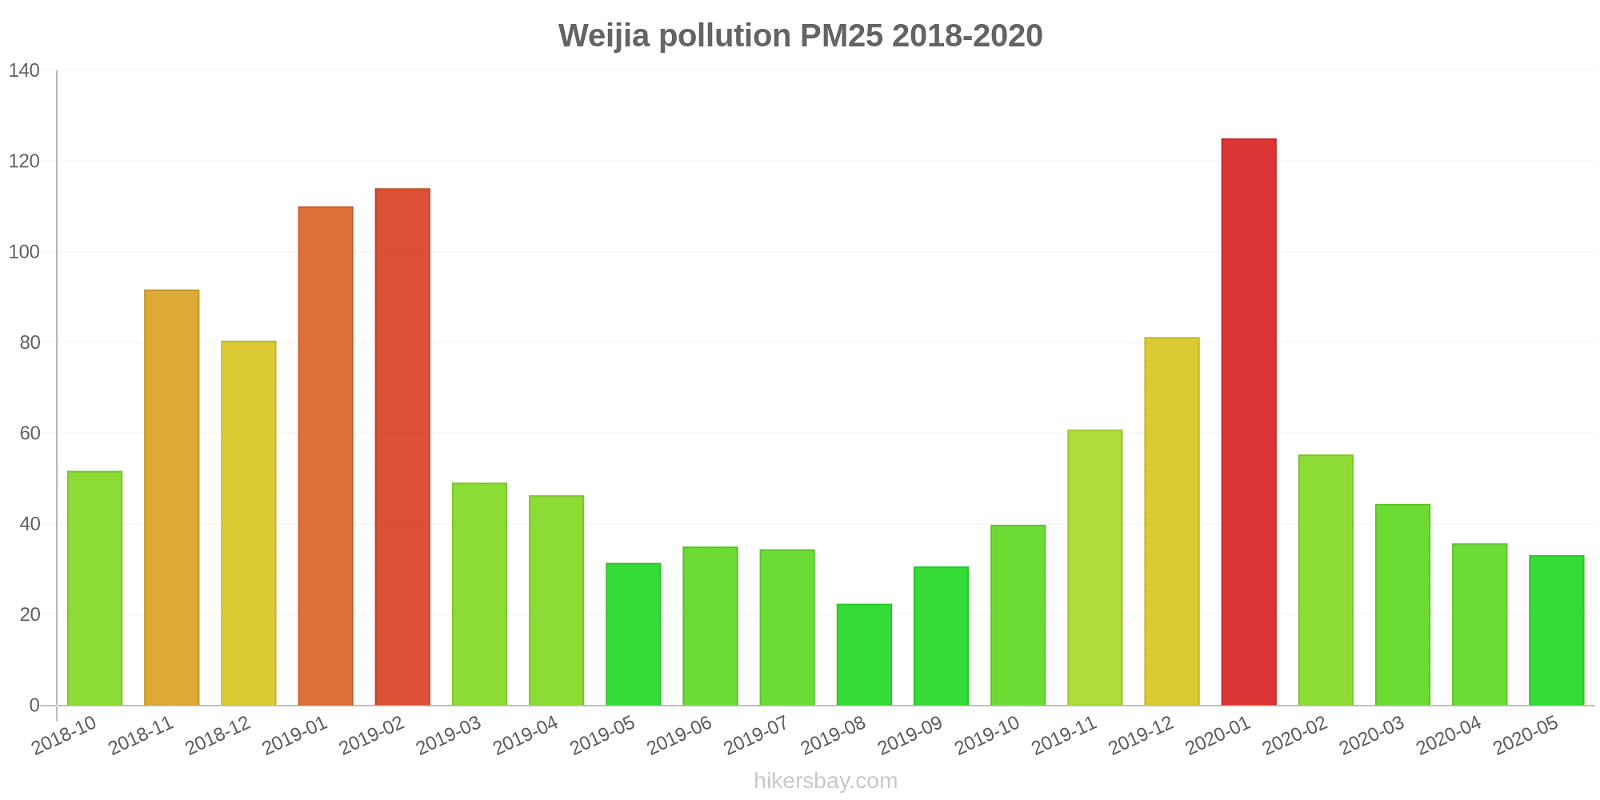
What is the current level of PM2.5 in Weijia? (particulate matter (PM2.5) dust)
Today's PM2.5 level is:
35 (Unhealthy for Sensitive Groups)
For comparison, the highest level of PM2.5 in Weijia in the last 7 days was: 56 (Friday, May 27, 2022) and the lowest: 56 (Friday, May 27, 2022).
The highest PM2.5 values were recorded: 125 (January 2020).
The lowest level of particulate matter PM2.5 pollution occurs in month: August (22).
How is the O3 level today in Weijia? (ozone (O3))
0 (Good)
How high is the level of NO2? (nitrogen dioxide (NO2))
0 (Good)
What is the level of SO2 pollution? (sulfur dioxide (SO2))
0 (Good)
Current data Friday, May 27, 2022, 12:00 PM
PM10 179 (Very bad Hazardous)
PM2,5 35 (Unhealthy for Sensitive Groups)
O3 0 (Good)
NO2 0 (Good)
SO2 0 (Good)
Data on air pollution from recent days in Weijia
index
2022-05-27
pm10
56
Unhealthy for Sensitive Groups
pm25
56
Unhealthy
o3
0
Good
no2
0
Good
so2
0
Good
data source »
Air pollution in Weijia from October 2018 to May 2020
index
2020-05
2020-04
2020-03
2020-02
2020-01
2019-12
2019-11
2019-10
2019-09
2019-08
2019-07
2019-06
2019-05
2019-04
2019-03
2019-02
2019-01
2018-12
2018-11
2018-10
pm25
33 (Moderate)
36 (Unhealthy for Sensitive Groups)
44 (Unhealthy for Sensitive Groups)
55 (Unhealthy)
125 (Very bad Hazardous)
81 (Very Unhealthy)
61 (Unhealthy)
40 (Unhealthy for Sensitive Groups)
31 (Moderate)
22 (Moderate)
34 (Moderate)
35 (Unhealthy for Sensitive Groups)
31 (Moderate)
46 (Unhealthy for Sensitive Groups)
49 (Unhealthy for Sensitive Groups)
114 (Very bad Hazardous)
110 (Very bad Hazardous)
80 (Very Unhealthy)
92 (Very Unhealthy)
52 (Unhealthy for Sensitive Groups)
co
553 (Good)
526 (Good)
614 (Good)
690 (Good)
1 (Good)
1 (Good)
917 (Good)
690 (Good)
677 (Good)
596 (Good)
666 (Good)
579 (Good)
561 (Good)
672 (Good)
619 (Good)
1 (Good)
1 (Good)
1 (Good)
1 (Good)
798 (Good)
no2
21 (Good)
27 (Good)
26 (Good)
19 (Good)
51 (Moderate)
50 (Moderate)
43 (Moderate)
33 (Good)
30 (Good)
21 (Good)
17 (Good)
19 (Good)
18 (Good)
29 (Good)
30 (Good)
37 (Good)
56 (Moderate)
48 (Moderate)
44 (Moderate)
47 (Moderate)
o3
152 (Unhealthy)
148 (Unhealthy for Sensitive Groups)
119 (Moderate)
100 (Moderate)
77 (Moderate)
47 (Good)
63 (Good)
103 (Moderate)
156 (Unhealthy)
142 (Unhealthy for Sensitive Groups)
179 (Unhealthy)
208 (Very Unhealthy)
174 (Unhealthy)
138 (Unhealthy for Sensitive Groups)
118 (Moderate)
84 (Moderate)
55 (Good)
53 (Good)
83 (Moderate)
102 (Moderate)
pm10
55 (Unhealthy for Sensitive Groups)
71 (Unhealthy for Sensitive Groups)
81 (Unhealthy)
73 (Unhealthy for Sensitive Groups)
160 (Very bad Hazardous)
121 (Very Unhealthy)
123 (Very Unhealthy)
89 (Unhealthy)
64 (Unhealthy for Sensitive Groups)
45 (Moderate)
55 (Unhealthy for Sensitive Groups)
65 (Unhealthy for Sensitive Groups)
75 (Unhealthy for Sensitive Groups)
94 (Unhealthy)
93 (Unhealthy)
155 (Very bad Hazardous)
161 (Very bad Hazardous)
137 (Very Unhealthy)
149 (Very Unhealthy)
93 (Unhealthy)
so2
8.2 (Good)
10 (Good)
9.9 (Good)
8.6 (Good)
17 (Good)
14 (Good)
15 (Good)
11 (Good)
8.9 (Good)
5.9 (Good)
6.2 (Good)
11 (Good)
14 (Good)
9.7 (Good)
13 (Good)
18 (Good)
28 (Good)
21 (Good)
14 (Good)
14 (Good)
data source »
电机北厂
Friday, May 27, 2022, 12:00 PM
PM10 179 (Very bad Hazardous)
particulate matter (PM10) suspended dust
PM2,5 35 (Unhealthy for Sensitive Groups)
particulate matter (PM2.5) dust
O3 0.04 (Good)
ozone (O3)
NO2 0 (Good)
nitrogen dioxide (NO2)
SO2 0 (Good)
sulfur dioxide (SO2)
电机北厂
index
2022-05-27
pm10
56
pm25
56
o3
0.03
no2
0
so2
0
电机北厂
2018-10 2020-05

index
2020-05
2020-04
2020-03
2020-02
2020-01
2019-12
2019-11
2019-10
2019-09
2019-08
2019-07
2019-06
2019-05
2019-04
2019-03
2019-02
2019-01
2018-12
2018-11
2018-10
pm25
33
36
44
55
125
81
61
40
31
22
34
35
31
46
49
114
110
80
92
52
co
553
526
614
690
1
1
917
690
677
596
666
579
561
672
619
1
1
1
1
798
no2
21
27
26
19
51
50
43
33
30
21
17
19
18
29
30
37
56
48
44
47
o3
152
148
119
100
77
47
63
103
156
142
179
208
174
138
118
84
55
53
83
102
pm10
55
71
81
73
160
121
123
89
64
45
55
65
75
94
93
155
161
137
149
93
so2
8.2
10
9.9
8.6
17
14
15
11
8.9
5.9
6.2
11
14
9.7
13
18
28
21
14
14
* Pollution data source:
https://openaq.org
(ChinaAQIData)
The data is licensed under CC-By 4.0
PM10 179 (Very bad Hazardous)
PM2,5 35 (Unhealthy for Sensitive Groups)
O3 0 (Good)
NO2 0 (Good)
SO2 0 (Good)
Data on air pollution from recent days in Weijia
| index | 2022-05-27 |
|---|---|
| pm10 | 56 Unhealthy for Sensitive Groups |
| pm25 | 56 Unhealthy |
| o3 | 0 Good |
| no2 | 0 Good |
| so2 | 0 Good |

| index | 2020-05 | 2020-04 | 2020-03 | 2020-02 | 2020-01 | 2019-12 | 2019-11 | 2019-10 | 2019-09 | 2019-08 | 2019-07 | 2019-06 | 2019-05 | 2019-04 | 2019-03 | 2019-02 | 2019-01 | 2018-12 | 2018-11 | 2018-10 |
|---|---|---|---|---|---|---|---|---|---|---|---|---|---|---|---|---|---|---|---|---|
| pm25 | 33 (Moderate) | 36 (Unhealthy for Sensitive Groups) | 44 (Unhealthy for Sensitive Groups) | 55 (Unhealthy) | 125 (Very bad Hazardous) | 81 (Very Unhealthy) | 61 (Unhealthy) | 40 (Unhealthy for Sensitive Groups) | 31 (Moderate) | 22 (Moderate) | 34 (Moderate) | 35 (Unhealthy for Sensitive Groups) | 31 (Moderate) | 46 (Unhealthy for Sensitive Groups) | 49 (Unhealthy for Sensitive Groups) | 114 (Very bad Hazardous) | 110 (Very bad Hazardous) | 80 (Very Unhealthy) | 92 (Very Unhealthy) | 52 (Unhealthy for Sensitive Groups) |
| co | 553 (Good) | 526 (Good) | 614 (Good) | 690 (Good) | 1 (Good) | 1 (Good) | 917 (Good) | 690 (Good) | 677 (Good) | 596 (Good) | 666 (Good) | 579 (Good) | 561 (Good) | 672 (Good) | 619 (Good) | 1 (Good) | 1 (Good) | 1 (Good) | 1 (Good) | 798 (Good) |
| no2 | 21 (Good) | 27 (Good) | 26 (Good) | 19 (Good) | 51 (Moderate) | 50 (Moderate) | 43 (Moderate) | 33 (Good) | 30 (Good) | 21 (Good) | 17 (Good) | 19 (Good) | 18 (Good) | 29 (Good) | 30 (Good) | 37 (Good) | 56 (Moderate) | 48 (Moderate) | 44 (Moderate) | 47 (Moderate) |
| o3 | 152 (Unhealthy) | 148 (Unhealthy for Sensitive Groups) | 119 (Moderate) | 100 (Moderate) | 77 (Moderate) | 47 (Good) | 63 (Good) | 103 (Moderate) | 156 (Unhealthy) | 142 (Unhealthy for Sensitive Groups) | 179 (Unhealthy) | 208 (Very Unhealthy) | 174 (Unhealthy) | 138 (Unhealthy for Sensitive Groups) | 118 (Moderate) | 84 (Moderate) | 55 (Good) | 53 (Good) | 83 (Moderate) | 102 (Moderate) |
| pm10 | 55 (Unhealthy for Sensitive Groups) | 71 (Unhealthy for Sensitive Groups) | 81 (Unhealthy) | 73 (Unhealthy for Sensitive Groups) | 160 (Very bad Hazardous) | 121 (Very Unhealthy) | 123 (Very Unhealthy) | 89 (Unhealthy) | 64 (Unhealthy for Sensitive Groups) | 45 (Moderate) | 55 (Unhealthy for Sensitive Groups) | 65 (Unhealthy for Sensitive Groups) | 75 (Unhealthy for Sensitive Groups) | 94 (Unhealthy) | 93 (Unhealthy) | 155 (Very bad Hazardous) | 161 (Very bad Hazardous) | 137 (Very Unhealthy) | 149 (Very Unhealthy) | 93 (Unhealthy) |
| so2 | 8.2 (Good) | 10 (Good) | 9.9 (Good) | 8.6 (Good) | 17 (Good) | 14 (Good) | 15 (Good) | 11 (Good) | 8.9 (Good) | 5.9 (Good) | 6.2 (Good) | 11 (Good) | 14 (Good) | 9.7 (Good) | 13 (Good) | 18 (Good) | 28 (Good) | 21 (Good) | 14 (Good) | 14 (Good) |
PM10 179 (Very bad Hazardous)
particulate matter (PM10) suspended dustPM2,5 35 (Unhealthy for Sensitive Groups)
particulate matter (PM2.5) dustO3 0.04 (Good)
ozone (O3)NO2 0 (Good)
nitrogen dioxide (NO2)SO2 0 (Good)
sulfur dioxide (SO2)电机北厂
| index | 2022-05-27 |
|---|---|
| pm10 | 56 |
| pm25 | 56 |
| o3 | 0.03 |
| no2 | 0 |
| so2 | 0 |
电机北厂

| index | 2020-05 | 2020-04 | 2020-03 | 2020-02 | 2020-01 | 2019-12 | 2019-11 | 2019-10 | 2019-09 | 2019-08 | 2019-07 | 2019-06 | 2019-05 | 2019-04 | 2019-03 | 2019-02 | 2019-01 | 2018-12 | 2018-11 | 2018-10 |
|---|---|---|---|---|---|---|---|---|---|---|---|---|---|---|---|---|---|---|---|---|
| pm25 | 33 | 36 | 44 | 55 | 125 | 81 | 61 | 40 | 31 | 22 | 34 | 35 | 31 | 46 | 49 | 114 | 110 | 80 | 92 | 52 |
| co | 553 | 526 | 614 | 690 | 1 | 1 | 917 | 690 | 677 | 596 | 666 | 579 | 561 | 672 | 619 | 1 | 1 | 1 | 1 | 798 |
| no2 | 21 | 27 | 26 | 19 | 51 | 50 | 43 | 33 | 30 | 21 | 17 | 19 | 18 | 29 | 30 | 37 | 56 | 48 | 44 | 47 |
| o3 | 152 | 148 | 119 | 100 | 77 | 47 | 63 | 103 | 156 | 142 | 179 | 208 | 174 | 138 | 118 | 84 | 55 | 53 | 83 | 102 |
| pm10 | 55 | 71 | 81 | 73 | 160 | 121 | 123 | 89 | 64 | 45 | 55 | 65 | 75 | 94 | 93 | 155 | 161 | 137 | 149 | 93 |
| so2 | 8.2 | 10 | 9.9 | 8.6 | 17 | 14 | 15 | 11 | 8.9 | 5.9 | 6.2 | 11 | 14 | 9.7 | 13 | 18 | 28 | 21 | 14 | 14 |