Air Pollution in Chengbeicun: Real-time Air Quality Index and smog alert.
Pollution and air quality forecast for Chengbeicun. Today is Tuesday, June 16, 2026. The following air pollution values have been recorded for Chengbeicun:- particulate matter (PM10) suspended dust - 179 (Very bad Hazardous)
- particulate matter (PM2.5) dust - 35 (Unhealthy for Sensitive Groups)
- ozone (O3) - 0 (Good)
- nitrogen dioxide (NO2) - 0 (Good)
- sulfur dioxide (SO2) - 0 (Good)

What is the air quality in Chengbeicun today? Is the air polluted in Chengbeicun?. Is there smog?
What is the level of PM10 today in Chengbeicun? (particulate matter (PM10) suspended dust)
The current level of particulate matter PM10 in Chengbeicun is:
179 (Very bad Hazardous)
The highest PM10 values usually occur in month: 132 (January 2019).
The lowest value of particulate matter PM10 pollution in Chengbeicun is usually recorded in: August (46).
What is the current level of PM2.5 in Chengbeicun? (particulate matter (PM2.5) dust)
Today's PM2.5 level is:
35 (Unhealthy for Sensitive Groups)
For comparison, the highest level of PM2.5 in Chengbeicun in the last 7 days was: 56 (Friday, May 27, 2022) and the lowest: 56 (Friday, May 27, 2022).
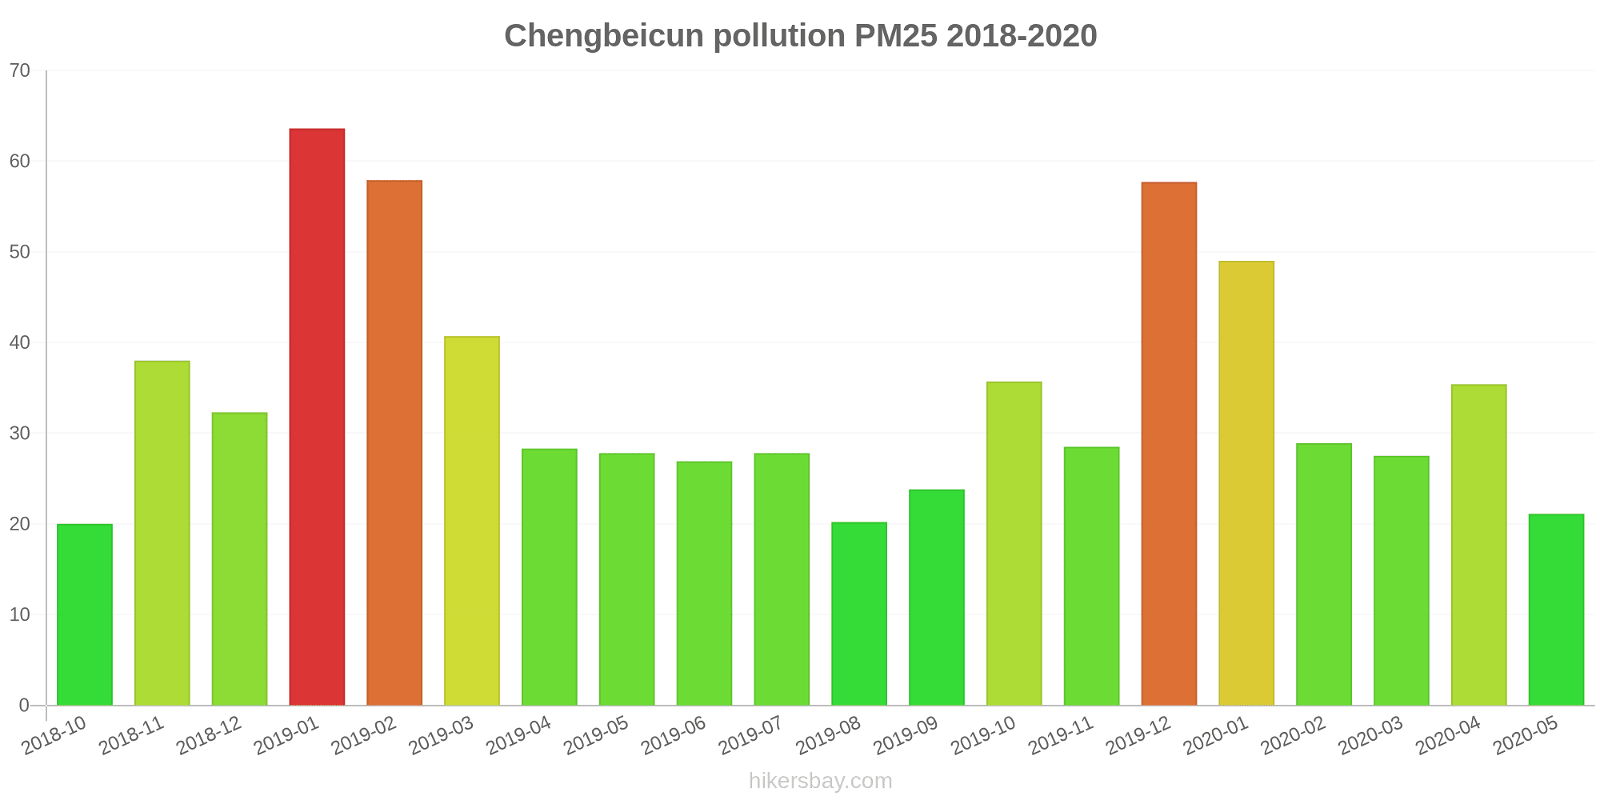
The highest PM2.5 values were recorded: 64 (January 2019).
The lowest level of particulate matter PM2.5 pollution occurs in month: October (20).
How is the O3 level today in Chengbeicun? (ozone (O3))
0 (Good)
How high is the level of NO2? (nitrogen dioxide (NO2))
0 (Good)
What is the level of SO2 pollution? (sulfur dioxide (SO2))
0 (Good)
Current data Friday, May 27, 2022, 12:00 PM
PM10 179 (Very bad Hazardous)
PM2,5 35 (Unhealthy for Sensitive Groups)
O3 0 (Good)
NO2 0 (Good)
SO2 0 (Good)
Data on air pollution from recent days in Chengbeicun
index
2022-05-27
pm10
56
Unhealthy for Sensitive Groups
pm25
56
Unhealthy
o3
0
Good
no2
0
Good
so2
0
Good
data source »
Air pollution in Chengbeicun from October 2018 to May 2020
index
2020-05
2020-04
2020-03
2020-02
2020-01
2019-12
2019-11
2019-10
2019-09
2019-08
2019-07
2019-06
2019-05
2019-04
2019-03
2019-02
2019-01
2018-12
2018-11
2018-10
pm25
21 (Moderate)
35 (Unhealthy for Sensitive Groups)
28 (Moderate)
29 (Moderate)
49 (Unhealthy for Sensitive Groups)
58 (Unhealthy)
29 (Moderate)
36 (Unhealthy for Sensitive Groups)
24 (Moderate)
20 (Moderate)
28 (Moderate)
27 (Moderate)
28 (Moderate)
28 (Moderate)
41 (Unhealthy for Sensitive Groups)
58 (Unhealthy)
64 (Unhealthy)
32 (Moderate)
38 (Unhealthy for Sensitive Groups)
20 (Moderate)
co
491 (Good)
501 (Good)
510 (Good)
625 (Good)
762 (Good)
811 (Good)
586 (Good)
504 (Good)
435 (Good)
443 (Good)
335 (Good)
312 (Good)
272 (Good)
356 (Good)
554 (Good)
824 (Good)
1 (Good)
736 (Good)
847 (Good)
560 (Good)
no2
22 (Good)
28 (Good)
27 (Good)
20 (Good)
30 (Good)
36 (Good)
27 (Good)
26 (Good)
21 (Good)
16 (Good)
16 (Good)
13 (Good)
17 (Good)
21 (Good)
29 (Good)
26 (Good)
38 (Good)
25 (Good)
31 (Good)
22 (Good)
o3
142 (Unhealthy for Sensitive Groups)
144 (Unhealthy for Sensitive Groups)
117 (Moderate)
98 (Moderate)
96 (Moderate)
74 (Moderate)
82 (Moderate)
132 (Unhealthy for Sensitive Groups)
145 (Unhealthy for Sensitive Groups)
141 (Unhealthy for Sensitive Groups)
157 (Unhealthy)
147 (Unhealthy for Sensitive Groups)
169 (Unhealthy)
124 (Unhealthy for Sensitive Groups)
102 (Moderate)
81 (Moderate)
60 (Good)
59 (Good)
97 (Moderate)
104 (Moderate)
pm10
48 (Moderate)
76 (Unhealthy for Sensitive Groups)
64 (Unhealthy for Sensitive Groups)
53 (Unhealthy for Sensitive Groups)
86 (Unhealthy)
84 (Unhealthy)
69 (Unhealthy for Sensitive Groups)
99 (Unhealthy)
60 (Unhealthy for Sensitive Groups)
46 (Moderate)
53 (Unhealthy for Sensitive Groups)
52 (Unhealthy for Sensitive Groups)
76 (Unhealthy for Sensitive Groups)
79 (Unhealthy for Sensitive Groups)
102 (Unhealthy)
115 (Very Unhealthy)
132 (Very Unhealthy)
81 (Unhealthy)
112 (Very Unhealthy)
67 (Unhealthy for Sensitive Groups)
so2
9.2 (Good)
15 (Good)
15 (Good)
11 (Good)
12 (Good)
17 (Good)
12 (Good)
11 (Good)
11 (Good)
8.7 (Good)
6.1 (Good)
6.6 (Good)
10 (Good)
8.5 (Good)
11 (Good)
11 (Good)
17 (Good)
9.3 (Good)
11 (Good)
9 (Good)
data source »
牟平检察院(启用170519)
Friday, May 27, 2022, 12:00 PM
PM10 179 (Very bad Hazardous)
particulate matter (PM10) suspended dust
PM2,5 35 (Unhealthy for Sensitive Groups)
particulate matter (PM2.5) dust
O3 0.04 (Good)
ozone (O3)
NO2 0 (Good)
nitrogen dioxide (NO2)
SO2 0 (Good)
sulfur dioxide (SO2)
牟平检察院(启用170519)
index
2022-05-27
pm10
56
pm25
56
o3
0.03
no2
0
so2
0
牟平检察院
2018-10 2020-05

index
2020-05
2020-04
2020-03
2020-02
2020-01
2019-12
2019-11
2019-10
2019-09
2019-08
2019-07
2019-06
2019-05
2019-04
2019-03
2019-02
2019-01
2018-12
2018-11
2018-10
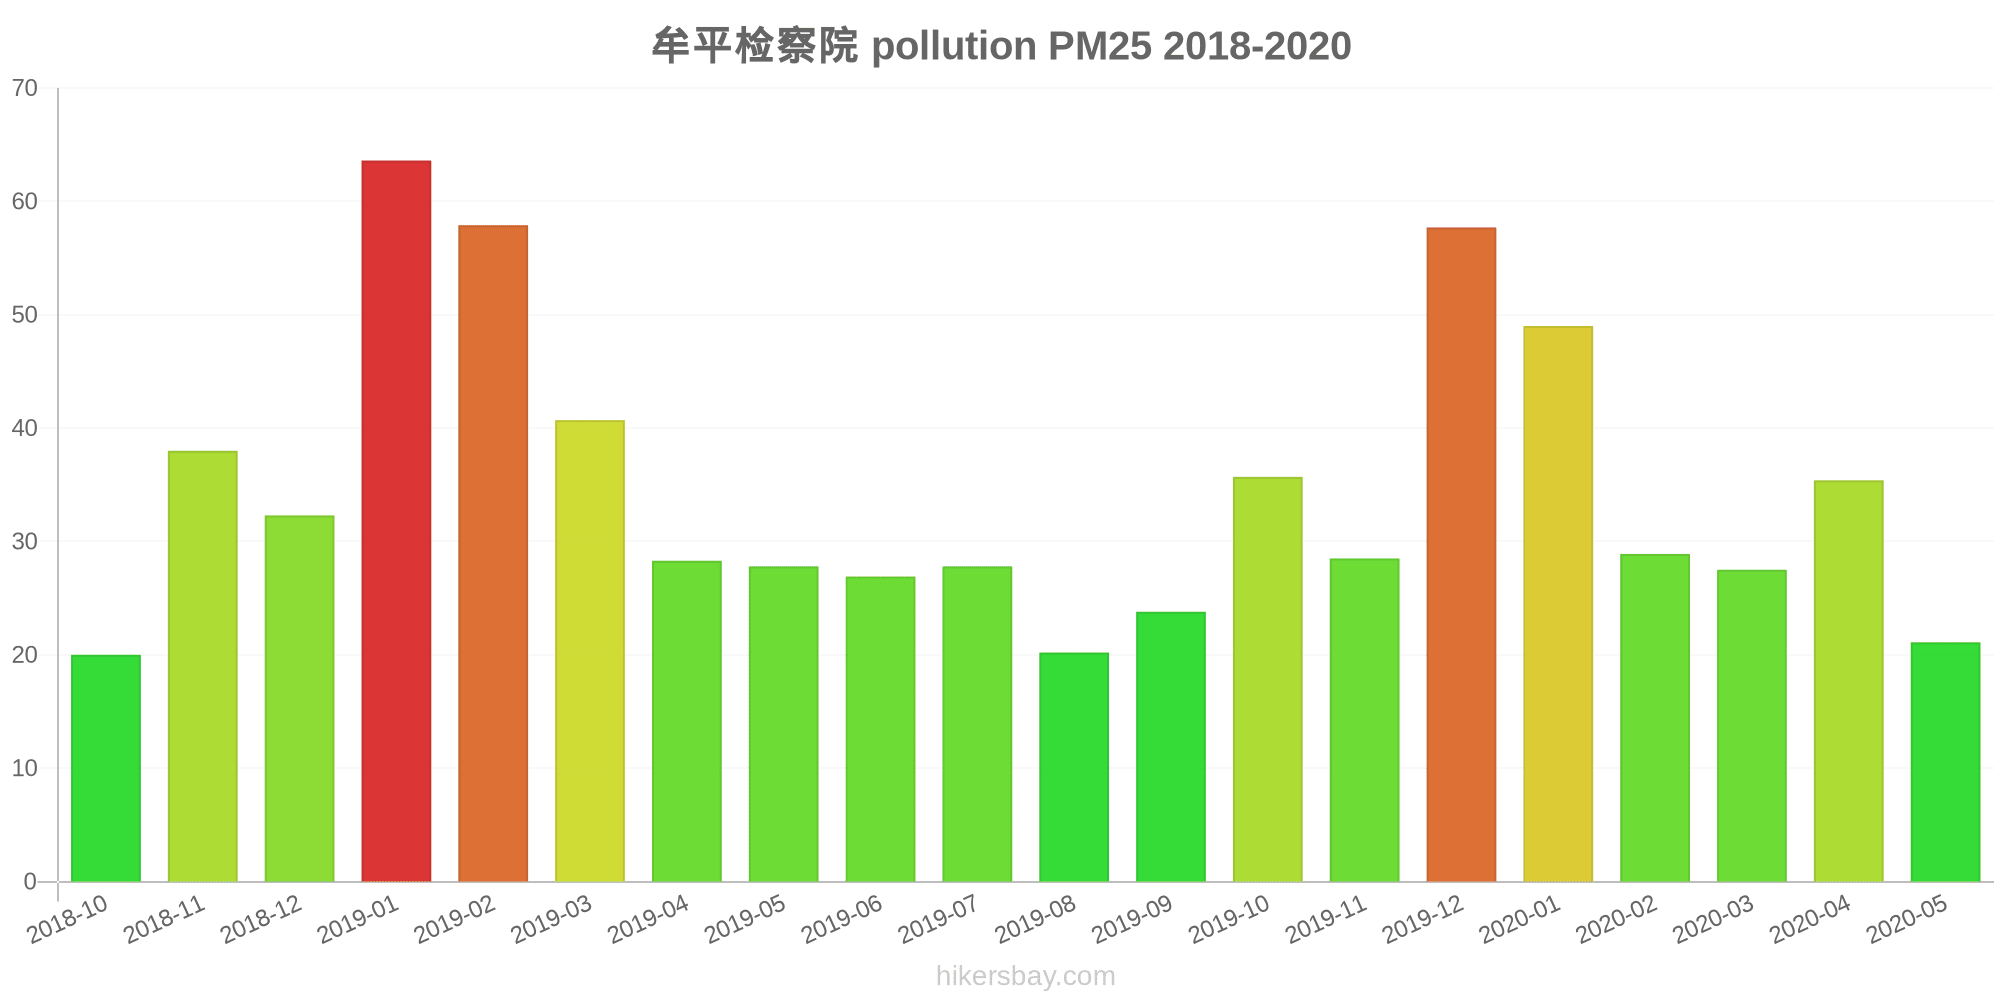
pm25
21
35
28
29
49
58
29
36
24
20
28
27
28
28
41
58
64
32
38
20
co
491
501
510
625
762
811
586
504
435
443
335
312
272
356
554
824
1
736
847
560
no2
22
28
27
20
30
36
27
26
21
16
16
13
17
21
29
26
38
25
31
22
o3
142
144
117
98
96
74
82
132
145
141
157
147
169
124
102
81
60
59
97
104
pm10
48
76
64
53
86
84
69
99
60
46
53
52
76
79
102
115
132
81
112
67
so2
9.2
15
15
11
12
17
12
11
11
8.7
6.1
6.6
10
8.5
11
11
17
9.3
11
9
* Pollution data source:
https://openaq.org
(ChinaAQIData)
The data is licensed under CC-By 4.0
PM10 179 (Very bad Hazardous)
PM2,5 35 (Unhealthy for Sensitive Groups)
O3 0 (Good)
NO2 0 (Good)
SO2 0 (Good)
Data on air pollution from recent days in Chengbeicun
| index | 2022-05-27 |
|---|---|
| pm10 | 56 Unhealthy for Sensitive Groups |
| pm25 | 56 Unhealthy |
| o3 | 0 Good |
| no2 | 0 Good |
| so2 | 0 Good |

| index | 2020-05 | 2020-04 | 2020-03 | 2020-02 | 2020-01 | 2019-12 | 2019-11 | 2019-10 | 2019-09 | 2019-08 | 2019-07 | 2019-06 | 2019-05 | 2019-04 | 2019-03 | 2019-02 | 2019-01 | 2018-12 | 2018-11 | 2018-10 |
|---|---|---|---|---|---|---|---|---|---|---|---|---|---|---|---|---|---|---|---|---|
| pm25 | 21 (Moderate) | 35 (Unhealthy for Sensitive Groups) | 28 (Moderate) | 29 (Moderate) | 49 (Unhealthy for Sensitive Groups) | 58 (Unhealthy) | 29 (Moderate) | 36 (Unhealthy for Sensitive Groups) | 24 (Moderate) | 20 (Moderate) | 28 (Moderate) | 27 (Moderate) | 28 (Moderate) | 28 (Moderate) | 41 (Unhealthy for Sensitive Groups) | 58 (Unhealthy) | 64 (Unhealthy) | 32 (Moderate) | 38 (Unhealthy for Sensitive Groups) | 20 (Moderate) |
| co | 491 (Good) | 501 (Good) | 510 (Good) | 625 (Good) | 762 (Good) | 811 (Good) | 586 (Good) | 504 (Good) | 435 (Good) | 443 (Good) | 335 (Good) | 312 (Good) | 272 (Good) | 356 (Good) | 554 (Good) | 824 (Good) | 1 (Good) | 736 (Good) | 847 (Good) | 560 (Good) |
| no2 | 22 (Good) | 28 (Good) | 27 (Good) | 20 (Good) | 30 (Good) | 36 (Good) | 27 (Good) | 26 (Good) | 21 (Good) | 16 (Good) | 16 (Good) | 13 (Good) | 17 (Good) | 21 (Good) | 29 (Good) | 26 (Good) | 38 (Good) | 25 (Good) | 31 (Good) | 22 (Good) |
| o3 | 142 (Unhealthy for Sensitive Groups) | 144 (Unhealthy for Sensitive Groups) | 117 (Moderate) | 98 (Moderate) | 96 (Moderate) | 74 (Moderate) | 82 (Moderate) | 132 (Unhealthy for Sensitive Groups) | 145 (Unhealthy for Sensitive Groups) | 141 (Unhealthy for Sensitive Groups) | 157 (Unhealthy) | 147 (Unhealthy for Sensitive Groups) | 169 (Unhealthy) | 124 (Unhealthy for Sensitive Groups) | 102 (Moderate) | 81 (Moderate) | 60 (Good) | 59 (Good) | 97 (Moderate) | 104 (Moderate) |
| pm10 | 48 (Moderate) | 76 (Unhealthy for Sensitive Groups) | 64 (Unhealthy for Sensitive Groups) | 53 (Unhealthy for Sensitive Groups) | 86 (Unhealthy) | 84 (Unhealthy) | 69 (Unhealthy for Sensitive Groups) | 99 (Unhealthy) | 60 (Unhealthy for Sensitive Groups) | 46 (Moderate) | 53 (Unhealthy for Sensitive Groups) | 52 (Unhealthy for Sensitive Groups) | 76 (Unhealthy for Sensitive Groups) | 79 (Unhealthy for Sensitive Groups) | 102 (Unhealthy) | 115 (Very Unhealthy) | 132 (Very Unhealthy) | 81 (Unhealthy) | 112 (Very Unhealthy) | 67 (Unhealthy for Sensitive Groups) |
| so2 | 9.2 (Good) | 15 (Good) | 15 (Good) | 11 (Good) | 12 (Good) | 17 (Good) | 12 (Good) | 11 (Good) | 11 (Good) | 8.7 (Good) | 6.1 (Good) | 6.6 (Good) | 10 (Good) | 8.5 (Good) | 11 (Good) | 11 (Good) | 17 (Good) | 9.3 (Good) | 11 (Good) | 9 (Good) |
PM10 179 (Very bad Hazardous)
particulate matter (PM10) suspended dustPM2,5 35 (Unhealthy for Sensitive Groups)
particulate matter (PM2.5) dustO3 0.04 (Good)
ozone (O3)NO2 0 (Good)
nitrogen dioxide (NO2)SO2 0 (Good)
sulfur dioxide (SO2)牟平检察院(启用170519)
| index | 2022-05-27 |
|---|---|
| pm10 | 56 |
| pm25 | 56 |
| o3 | 0.03 |
| no2 | 0 |
| so2 | 0 |
牟平检察院
| index | 2020-05 | 2020-04 | 2020-03 | 2020-02 | 2020-01 | 2019-12 | 2019-11 | 2019-10 | 2019-09 | 2019-08 | 2019-07 | 2019-06 | 2019-05 | 2019-04 | 2019-03 | 2019-02 | 2019-01 | 2018-12 | 2018-11 | 2018-10 |
|---|---|---|---|---|---|---|---|---|---|---|---|---|---|---|---|---|---|---|---|---|
| pm25 | 21 | 35 | 28 | 29 | 49 | 58 | 29 | 36 | 24 | 20 | 28 | 27 | 28 | 28 | 41 | 58 | 64 | 32 | 38 | 20 |
| co | 491 | 501 | 510 | 625 | 762 | 811 | 586 | 504 | 435 | 443 | 335 | 312 | 272 | 356 | 554 | 824 | 1 | 736 | 847 | 560 |
| no2 | 22 | 28 | 27 | 20 | 30 | 36 | 27 | 26 | 21 | 16 | 16 | 13 | 17 | 21 | 29 | 26 | 38 | 25 | 31 | 22 |
| o3 | 142 | 144 | 117 | 98 | 96 | 74 | 82 | 132 | 145 | 141 | 157 | 147 | 169 | 124 | 102 | 81 | 60 | 59 | 97 | 104 |
| pm10 | 48 | 76 | 64 | 53 | 86 | 84 | 69 | 99 | 60 | 46 | 53 | 52 | 76 | 79 | 102 | 115 | 132 | 81 | 112 | 67 |
| so2 | 9.2 | 15 | 15 | 11 | 12 | 17 | 12 | 11 | 11 | 8.7 | 6.1 | 6.6 | 10 | 8.5 | 11 | 11 | 17 | 9.3 | 11 | 9 |