Air Pollution in Beiwuli: Real-time Air Quality Index and smog alert.
Pollution and air quality forecast for Beiwuli. Today is Tuesday, June 16, 2026. The following air pollution values have been recorded for Beiwuli:- particulate matter (PM10) suspended dust - 179 (Very bad Hazardous)
- particulate matter (PM2.5) dust - 35 (Unhealthy for Sensitive Groups)
- ozone (O3) - 0 (Good)
- nitrogen dioxide (NO2) - 0 (Good)
- sulfur dioxide (SO2) - 0 (Good)

What is the air quality in Beiwuli today? Is the air polluted in Beiwuli?. Is there smog?
What is the level of PM10 today in Beiwuli? (particulate matter (PM10) suspended dust)
The current level of particulate matter PM10 in Beiwuli is:
179 (Very bad Hazardous)
The highest PM10 values usually occur in month: 118 (January 2019).
The lowest value of particulate matter PM10 pollution in Beiwuli is usually recorded in: August (36).
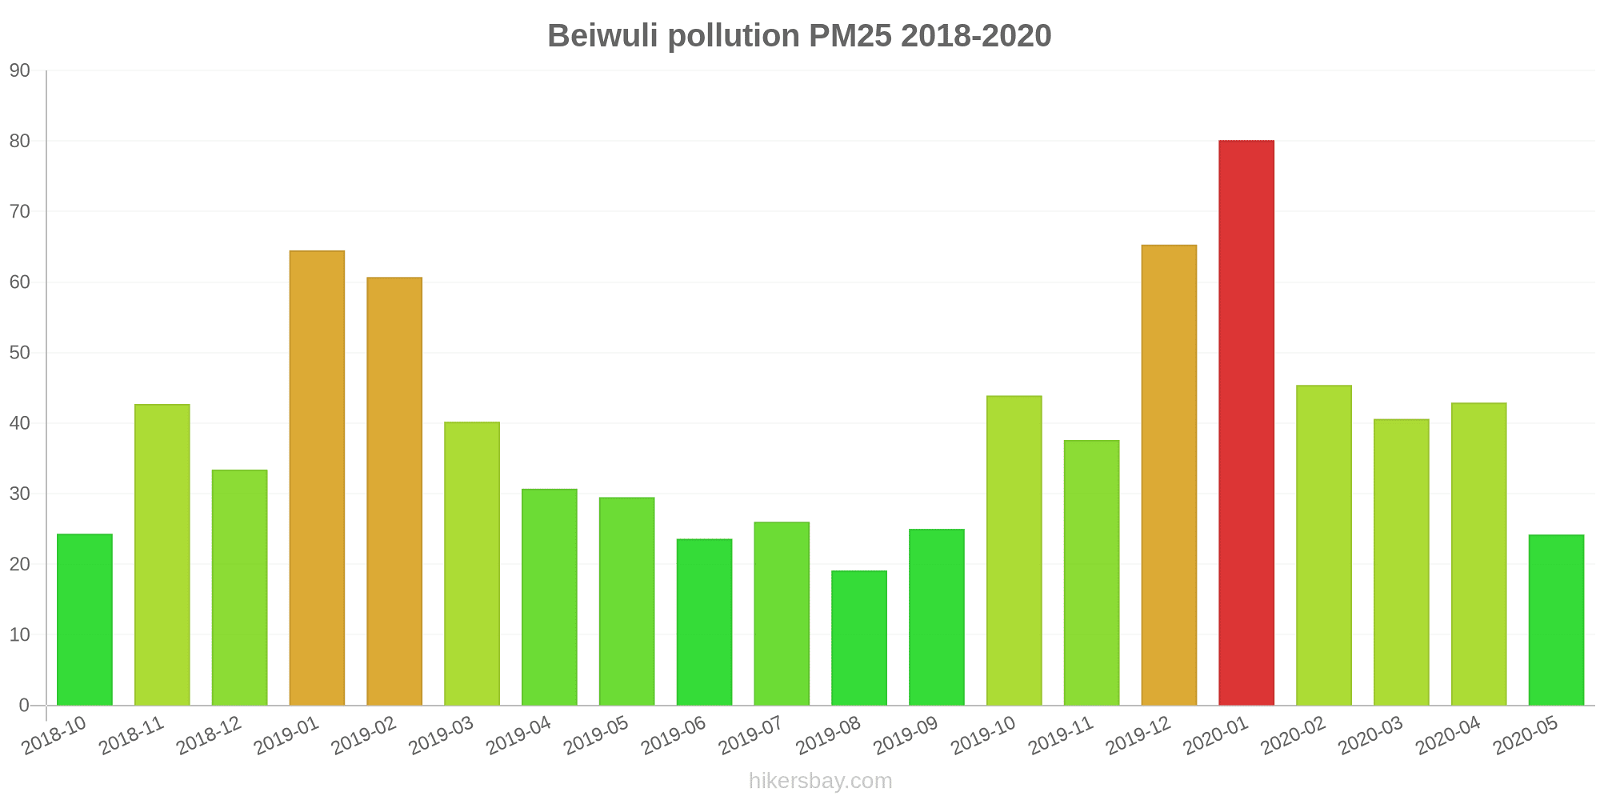
What is the current level of PM2.5 in Beiwuli? (particulate matter (PM2.5) dust)
Today's PM2.5 level is:
35 (Unhealthy for Sensitive Groups)
For comparison, the highest level of PM2.5 in Beiwuli in the last 7 days was: 56 (Friday, May 27, 2022) and the lowest: 56 (Friday, May 27, 2022).
The highest PM2.5 values were recorded: 80 (January 2020).
The lowest level of particulate matter PM2.5 pollution occurs in month: August (19).
How is the O3 level today in Beiwuli? (ozone (O3))
0 (Good)
How high is the level of NO2? (nitrogen dioxide (NO2))
0 (Good)
What is the level of SO2 pollution? (sulfur dioxide (SO2))
0 (Good)
Current data Friday, May 27, 2022, 12:00 PM
PM10 179 (Very bad Hazardous)
PM2,5 35 (Unhealthy for Sensitive Groups)
O3 0 (Good)
NO2 0 (Good)
SO2 0 (Good)
Data on air pollution from recent days in Beiwuli
index
2022-05-27
pm10
56
Unhealthy for Sensitive Groups
pm25
56
Unhealthy
o3
0
Good
no2
0
Good
so2
0
Good
data source »
Air pollution in Beiwuli from October 2018 to May 2020
index
2020-05
2020-04
2020-03
2020-02
2020-01
2019-12
2019-11
2019-10
2019-09
2019-08
2019-07
2019-06
2019-05
2019-04
2019-03
2019-02
2019-01
2018-12
2018-11
2018-10
pm25
24 (Moderate)
43 (Unhealthy for Sensitive Groups)
41 (Unhealthy for Sensitive Groups)
45 (Unhealthy for Sensitive Groups)
80 (Very Unhealthy)
65 (Unhealthy)
38 (Unhealthy for Sensitive Groups)
44 (Unhealthy for Sensitive Groups)
25 (Moderate)
19 (Moderate)
26 (Moderate)
24 (Moderate)
30 (Moderate)
31 (Moderate)
40 (Unhealthy for Sensitive Groups)
61 (Unhealthy)
65 (Unhealthy)
33 (Moderate)
43 (Unhealthy for Sensitive Groups)
24 (Moderate)
co
824 (Good)
933 (Good)
946 (Good)
957 (Good)
1 (Good)
1 (Good)
860 (Good)
951 (Good)
946 (Good)
921 (Good)
789 (Good)
743 (Good)
754 (Good)
771 (Good)
1 (Good)
1 (Good)
2 (Good)
1 (Good)
1 (Good)
683 (Good)
no2
17 (Good)
29 (Good)
24 (Good)
18 (Good)
36 (Good)
33 (Good)
32 (Good)
33 (Good)
28 (Good)
21 (Good)
16 (Good)
18 (Good)
25 (Good)
24 (Good)
37 (Good)
39 (Good)
56 (Moderate)
41 (Moderate)
40 (Moderate)
33 (Good)
o3
140 (Unhealthy for Sensitive Groups)
139 (Unhealthy for Sensitive Groups)
124 (Unhealthy for Sensitive Groups)
94 (Moderate)
82 (Moderate)
68 (Good)
84 (Moderate)
125 (Unhealthy for Sensitive Groups)
181 (Very Unhealthy)
163 (Unhealthy)
195 (Very Unhealthy)
225 (Very Unhealthy)
208 (Very Unhealthy)
135 (Unhealthy for Sensitive Groups)
122 (Unhealthy for Sensitive Groups)
90 (Moderate)
66 (Good)
69 (Good)
92 (Moderate)
113 (Moderate)
pm10
42 (Moderate)
80 (Unhealthy for Sensitive Groups)
78 (Unhealthy for Sensitive Groups)
61 (Unhealthy for Sensitive Groups)
108 (Unhealthy)
94 (Unhealthy)
81 (Unhealthy)
92 (Unhealthy)
55 (Unhealthy for Sensitive Groups)
36 (Moderate)
39 (Moderate)
41 (Moderate)
68 (Unhealthy for Sensitive Groups)
71 (Unhealthy for Sensitive Groups)
85 (Unhealthy)
107 (Unhealthy)
118 (Very Unhealthy)
74 (Unhealthy for Sensitive Groups)
102 (Unhealthy)
58 (Unhealthy for Sensitive Groups)
so2
11 (Good)
15 (Good)
15 (Good)
17 (Good)
27 (Good)
20 (Good)
12 (Good)
11 (Good)
9.3 (Good)
10 (Good)
7.9 (Good)
9.2 (Good)
13 (Good)
10 (Good)
17 (Good)
24 (Good)
37 (Good)
25 (Good)
17 (Good)
12 (Good)
data source »
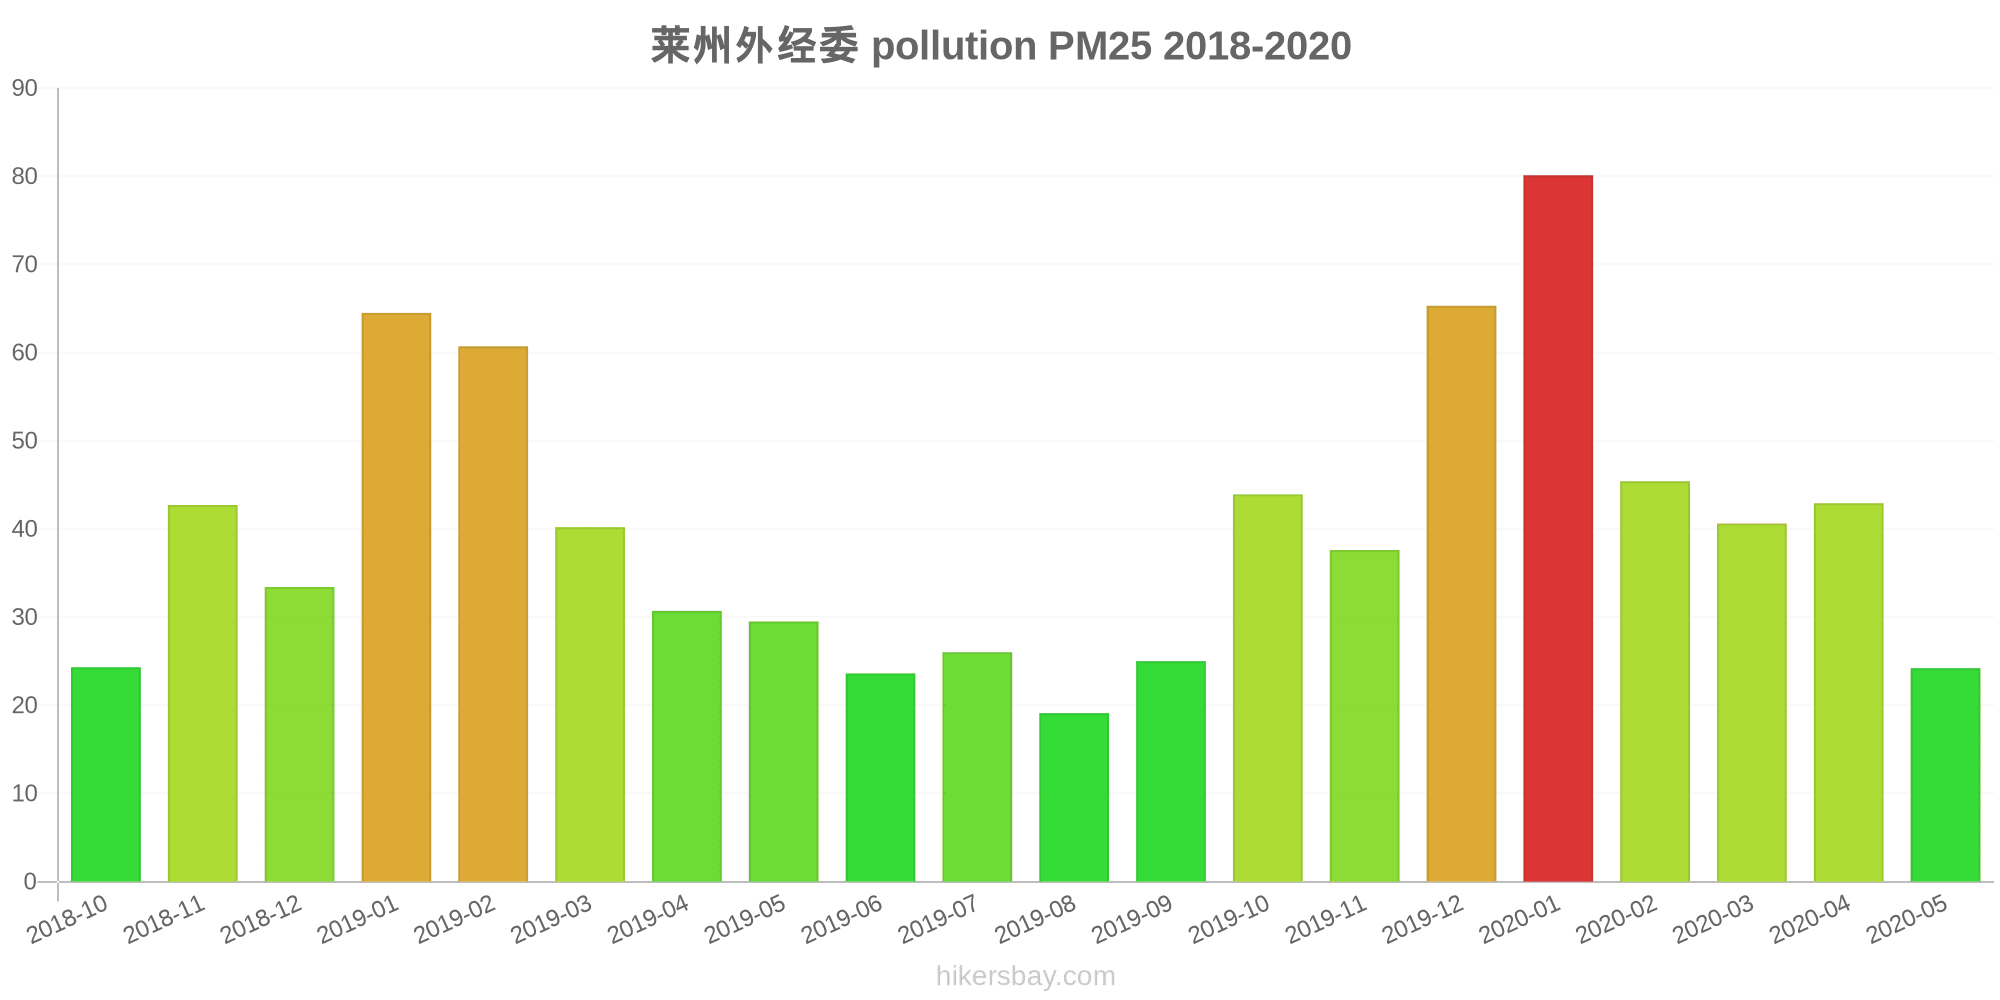
莱州外经委
Friday, May 27, 2022, 12:00 PM
PM10 179 (Very bad Hazardous)
particulate matter (PM10) suspended dust
PM2,5 35 (Unhealthy for Sensitive Groups)
particulate matter (PM2.5) dust
O3 0.04 (Good)
ozone (O3)
NO2 0 (Good)
nitrogen dioxide (NO2)
SO2 0 (Good)
sulfur dioxide (SO2)
莱州外经委
index
2022-05-27
pm10
56
pm25
56
o3
0.03
no2
0
so2
0
莱州外经委
2018-10 2020-05

index
2020-05
2020-04
2020-03
2020-02
2020-01
2019-12
2019-11
2019-10
2019-09
2019-08
2019-07
2019-06
2019-05
2019-04
2019-03
2019-02
2019-01
2018-12
2018-11
2018-10
pm25
24
43
41
45
80
65
38
44
25
19
26
24
30
31
40
61
65
33
43
24
co
824
933
946
957
1
1
860
951
946
921
789
743
754
771
1
1
2
1
1
683
no2
17
29
24
18
36
33
32
33
28
21
16
18
25
24
37
39
56
41
40
33
o3
140
139
124
94
82
68
84
125
181
163
195
225
208
135
122
90
66
69
92
113
pm10
42
80
78
61
108
94
81
92
55
36
39
41
68
71
85
107
118
74
102
58
so2
11
15
15
17
27
20
12
11
9.3
10
7.9
9.2
13
10
17
24
37
25
17
12
* Pollution data source:
https://openaq.org
(ChinaAQIData)
The data is licensed under CC-By 4.0
PM10 179 (Very bad Hazardous)
PM2,5 35 (Unhealthy for Sensitive Groups)
O3 0 (Good)
NO2 0 (Good)
SO2 0 (Good)
Data on air pollution from recent days in Beiwuli
| index | 2022-05-27 |
|---|---|
| pm10 | 56 Unhealthy for Sensitive Groups |
| pm25 | 56 Unhealthy |
| o3 | 0 Good |
| no2 | 0 Good |
| so2 | 0 Good |

| index | 2020-05 | 2020-04 | 2020-03 | 2020-02 | 2020-01 | 2019-12 | 2019-11 | 2019-10 | 2019-09 | 2019-08 | 2019-07 | 2019-06 | 2019-05 | 2019-04 | 2019-03 | 2019-02 | 2019-01 | 2018-12 | 2018-11 | 2018-10 |
|---|---|---|---|---|---|---|---|---|---|---|---|---|---|---|---|---|---|---|---|---|
| pm25 | 24 (Moderate) | 43 (Unhealthy for Sensitive Groups) | 41 (Unhealthy for Sensitive Groups) | 45 (Unhealthy for Sensitive Groups) | 80 (Very Unhealthy) | 65 (Unhealthy) | 38 (Unhealthy for Sensitive Groups) | 44 (Unhealthy for Sensitive Groups) | 25 (Moderate) | 19 (Moderate) | 26 (Moderate) | 24 (Moderate) | 30 (Moderate) | 31 (Moderate) | 40 (Unhealthy for Sensitive Groups) | 61 (Unhealthy) | 65 (Unhealthy) | 33 (Moderate) | 43 (Unhealthy for Sensitive Groups) | 24 (Moderate) |
| co | 824 (Good) | 933 (Good) | 946 (Good) | 957 (Good) | 1 (Good) | 1 (Good) | 860 (Good) | 951 (Good) | 946 (Good) | 921 (Good) | 789 (Good) | 743 (Good) | 754 (Good) | 771 (Good) | 1 (Good) | 1 (Good) | 2 (Good) | 1 (Good) | 1 (Good) | 683 (Good) |
| no2 | 17 (Good) | 29 (Good) | 24 (Good) | 18 (Good) | 36 (Good) | 33 (Good) | 32 (Good) | 33 (Good) | 28 (Good) | 21 (Good) | 16 (Good) | 18 (Good) | 25 (Good) | 24 (Good) | 37 (Good) | 39 (Good) | 56 (Moderate) | 41 (Moderate) | 40 (Moderate) | 33 (Good) |
| o3 | 140 (Unhealthy for Sensitive Groups) | 139 (Unhealthy for Sensitive Groups) | 124 (Unhealthy for Sensitive Groups) | 94 (Moderate) | 82 (Moderate) | 68 (Good) | 84 (Moderate) | 125 (Unhealthy for Sensitive Groups) | 181 (Very Unhealthy) | 163 (Unhealthy) | 195 (Very Unhealthy) | 225 (Very Unhealthy) | 208 (Very Unhealthy) | 135 (Unhealthy for Sensitive Groups) | 122 (Unhealthy for Sensitive Groups) | 90 (Moderate) | 66 (Good) | 69 (Good) | 92 (Moderate) | 113 (Moderate) |
| pm10 | 42 (Moderate) | 80 (Unhealthy for Sensitive Groups) | 78 (Unhealthy for Sensitive Groups) | 61 (Unhealthy for Sensitive Groups) | 108 (Unhealthy) | 94 (Unhealthy) | 81 (Unhealthy) | 92 (Unhealthy) | 55 (Unhealthy for Sensitive Groups) | 36 (Moderate) | 39 (Moderate) | 41 (Moderate) | 68 (Unhealthy for Sensitive Groups) | 71 (Unhealthy for Sensitive Groups) | 85 (Unhealthy) | 107 (Unhealthy) | 118 (Very Unhealthy) | 74 (Unhealthy for Sensitive Groups) | 102 (Unhealthy) | 58 (Unhealthy for Sensitive Groups) |
| so2 | 11 (Good) | 15 (Good) | 15 (Good) | 17 (Good) | 27 (Good) | 20 (Good) | 12 (Good) | 11 (Good) | 9.3 (Good) | 10 (Good) | 7.9 (Good) | 9.2 (Good) | 13 (Good) | 10 (Good) | 17 (Good) | 24 (Good) | 37 (Good) | 25 (Good) | 17 (Good) | 12 (Good) |
PM10 179 (Very bad Hazardous)
particulate matter (PM10) suspended dustPM2,5 35 (Unhealthy for Sensitive Groups)
particulate matter (PM2.5) dustO3 0.04 (Good)
ozone (O3)NO2 0 (Good)
nitrogen dioxide (NO2)SO2 0 (Good)
sulfur dioxide (SO2)莱州外经委
| index | 2022-05-27 |
|---|---|
| pm10 | 56 |
| pm25 | 56 |
| o3 | 0.03 |
| no2 | 0 |
| so2 | 0 |
莱州外经委
| index | 2020-05 | 2020-04 | 2020-03 | 2020-02 | 2020-01 | 2019-12 | 2019-11 | 2019-10 | 2019-09 | 2019-08 | 2019-07 | 2019-06 | 2019-05 | 2019-04 | 2019-03 | 2019-02 | 2019-01 | 2018-12 | 2018-11 | 2018-10 |
|---|---|---|---|---|---|---|---|---|---|---|---|---|---|---|---|---|---|---|---|---|
| pm25 | 24 | 43 | 41 | 45 | 80 | 65 | 38 | 44 | 25 | 19 | 26 | 24 | 30 | 31 | 40 | 61 | 65 | 33 | 43 | 24 |
| co | 824 | 933 | 946 | 957 | 1 | 1 | 860 | 951 | 946 | 921 | 789 | 743 | 754 | 771 | 1 | 1 | 2 | 1 | 1 | 683 |
| no2 | 17 | 29 | 24 | 18 | 36 | 33 | 32 | 33 | 28 | 21 | 16 | 18 | 25 | 24 | 37 | 39 | 56 | 41 | 40 | 33 |
| o3 | 140 | 139 | 124 | 94 | 82 | 68 | 84 | 125 | 181 | 163 | 195 | 225 | 208 | 135 | 122 | 90 | 66 | 69 | 92 | 113 |
| pm10 | 42 | 80 | 78 | 61 | 108 | 94 | 81 | 92 | 55 | 36 | 39 | 41 | 68 | 71 | 85 | 107 | 118 | 74 | 102 | 58 |
| so2 | 11 | 15 | 15 | 17 | 27 | 20 | 12 | 11 | 9.3 | 10 | 7.9 | 9.2 | 13 | 10 | 17 | 24 | 37 | 25 | 17 | 12 |