Air Pollution in Guqintai: Real-time Air Quality Index and smog alert.
Pollution and air quality forecast for Guqintai. Today is Tuesday, June 2, 2026. The following air pollution values have been recorded for Guqintai:- particulate matter (PM10) suspended dust - 179 (Very bad Hazardous)
- particulate matter (PM2.5) dust - 35 (Unhealthy for Sensitive Groups)
- ozone (O3) - 0 (Good)
- nitrogen dioxide (NO2) - 0 (Good)
- sulfur dioxide (SO2) - 0 (Good)

What is the air quality in Guqintai today? Is the air polluted in Guqintai?. Is there smog?
What is the level of PM10 today in Guqintai? (particulate matter (PM10) suspended dust)
The current level of particulate matter PM10 in Guqintai is:
179 (Very bad Hazardous)
The highest PM10 values usually occur in month: 113 (January 2019).
The lowest value of particulate matter PM10 pollution in Guqintai is usually recorded in: July (47).
What is the current level of PM2.5 in Guqintai? (particulate matter (PM2.5) dust)
Today's PM2.5 level is:
35 (Unhealthy for Sensitive Groups)
For comparison, the highest level of PM2.5 in Guqintai in the last 7 days was: 56 (Friday, May 27, 2022) and the lowest: 56 (Friday, May 27, 2022).
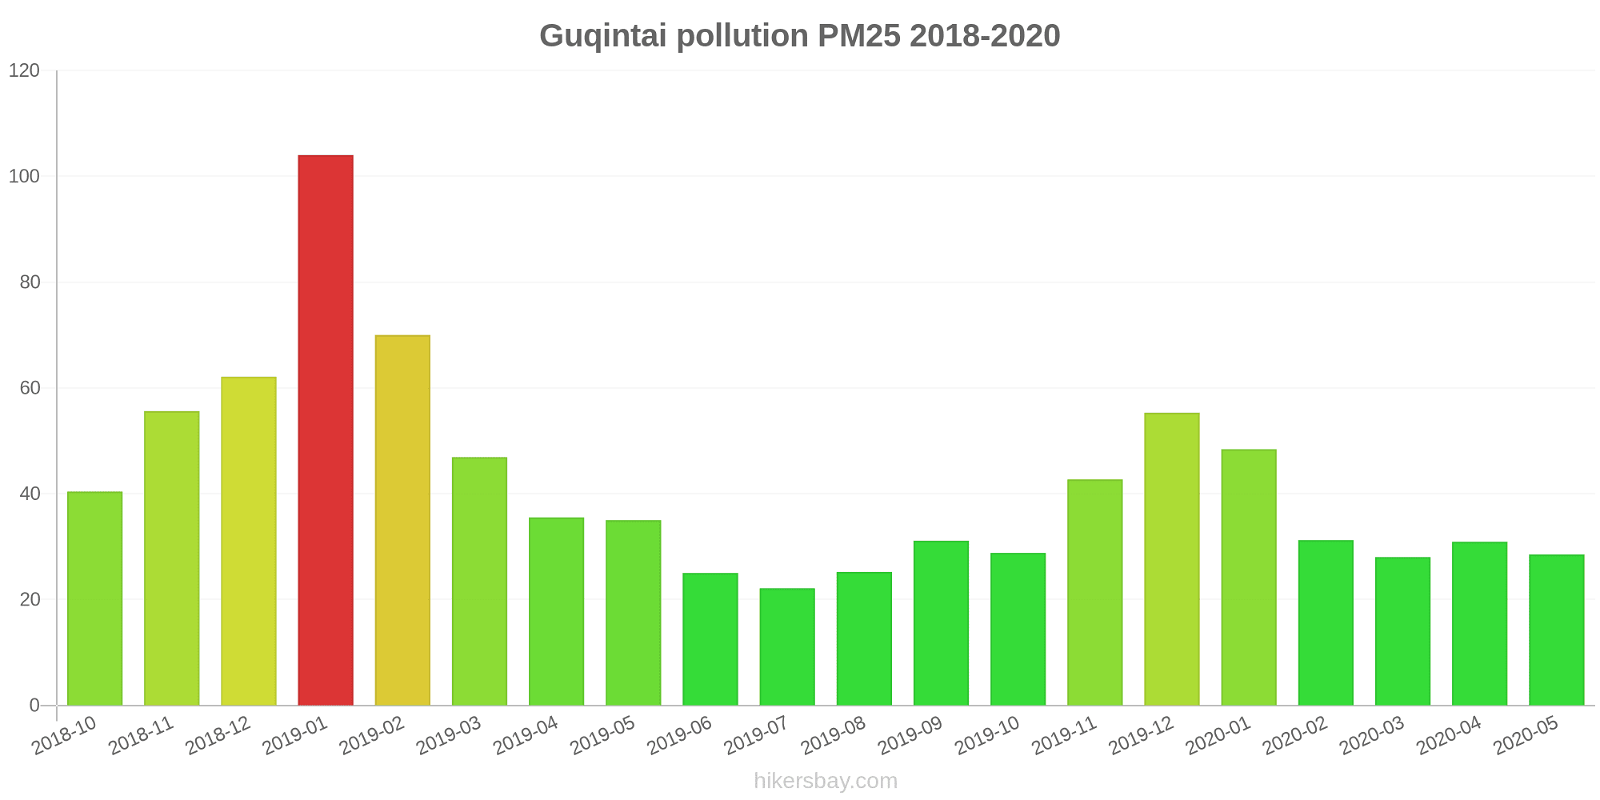
The highest PM2.5 values were recorded: 104 (January 2019).
The lowest level of particulate matter PM2.5 pollution occurs in month: July (22).
How is the O3 level today in Guqintai? (ozone (O3))
0 (Good)
How high is the level of NO2? (nitrogen dioxide (NO2))
0 (Good)
What is the level of SO2 pollution? (sulfur dioxide (SO2))
0 (Good)
Current data Friday, May 27, 2022, 12:00 PM
PM10 179 (Very bad Hazardous)
PM2,5 35 (Unhealthy for Sensitive Groups)
O3 0 (Good)
NO2 0 (Good)
SO2 0 (Good)
Data on air pollution from recent days in Guqintai
index
2022-05-27
pm10
56
Unhealthy for Sensitive Groups
pm25
56
Unhealthy
o3
0
Good
no2
0
Good
so2
0
Good
data source »
Air pollution in Guqintai from October 2018 to May 2020
index
2020-05
2020-04
2020-03
2020-02
2020-01
2019-12
2019-11
2019-10
2019-09
2019-08
2019-07
2019-06
2019-05
2019-04
2019-03
2019-02
2019-01
2018-12
2018-11
2018-10
pm25
29 (Moderate)
31 (Moderate)
28 (Moderate)
31 (Moderate)
48 (Unhealthy for Sensitive Groups)
55 (Unhealthy)
43 (Unhealthy for Sensitive Groups)
29 (Moderate)
31 (Moderate)
25 (Moderate)
22 (Moderate)
25 (Moderate)
35 (Unhealthy for Sensitive Groups)
36 (Unhealthy for Sensitive Groups)
47 (Unhealthy for Sensitive Groups)
70 (Unhealthy)
104 (Very Unhealthy)
62 (Unhealthy)
56 (Unhealthy)
40 (Unhealthy for Sensitive Groups)
co
853 (Good)
822 (Good)
933 (Good)
1 (Good)
1 (Good)
1 (Good)
954 (Good)
882 (Good)
1 (Good)
1 (Good)
737 (Good)
954 (Good)
1 (Good)
1 (Good)
1 (Good)
1 (Good)
1 (Good)
971 (Good)
880 (Good)
808 (Good)
no2
28 (Good)
37 (Good)
20 (Good)
18 (Good)
36 (Good)
66 (Moderate)
63 (Moderate)
48 (Moderate)
46 (Moderate)
28 (Good)
28 (Good)
35 (Good)
51 (Moderate)
47 (Moderate)
58 (Moderate)
39 (Good)
55 (Moderate)
44 (Moderate)
54 (Moderate)
61 (Moderate)
o3
127 (Unhealthy for Sensitive Groups)
135 (Unhealthy for Sensitive Groups)
98 (Moderate)
85 (Moderate)
55 (Good)
54 (Good)
87 (Moderate)
119 (Moderate)
181 (Very Unhealthy)
176 (Unhealthy)
147 (Unhealthy for Sensitive Groups)
162 (Unhealthy)
143 (Unhealthy for Sensitive Groups)
131 (Unhealthy for Sensitive Groups)
99 (Moderate)
54 (Good)
37 (Good)
43 (Good)
83 (Moderate)
110 (Moderate)
pm10
54 (Unhealthy for Sensitive Groups)
61 (Unhealthy for Sensitive Groups)
54 (Unhealthy for Sensitive Groups)
48 (Moderate)
74 (Unhealthy for Sensitive Groups)
100 (Unhealthy)
92 (Unhealthy)
60 (Unhealthy for Sensitive Groups)
61 (Unhealthy for Sensitive Groups)
51 (Unhealthy for Sensitive Groups)
47 (Moderate)
50 (Unhealthy for Sensitive Groups)
80 (Unhealthy)
70 (Unhealthy for Sensitive Groups)
84 (Unhealthy)
81 (Unhealthy)
113 (Very Unhealthy)
83 (Unhealthy)
79 (Unhealthy for Sensitive Groups)
76 (Unhealthy for Sensitive Groups)
so2
6.2 (Good)
8.5 (Good)
7.5 (Good)
7 (Good)
6.8 (Good)
9.8 (Good)
10 (Good)
8.2 (Good)
9.2 (Good)
6.5 (Good)
6 (Good)
6.2 (Good)
5.7 (Good)
7.8 (Good)
9.4 (Good)
7.7 (Good)
8.4 (Good)
11 (Good)
12 (Good)
11 (Good)
data source »
汉阳月湖
Friday, May 27, 2022, 12:00 PM
PM10 179 (Very bad Hazardous)
particulate matter (PM10) suspended dust
PM2,5 35 (Unhealthy for Sensitive Groups)
particulate matter (PM2.5) dust
O3 0.04 (Good)
ozone (O3)
NO2 0 (Good)
nitrogen dioxide (NO2)
SO2 0 (Good)
sulfur dioxide (SO2)
汉阳月湖
index
2022-05-27
pm10
56
pm25
56
o3
0.03
no2
0
so2
0
汉阳月湖
2018-10 2020-05

index
2020-05
2020-04
2020-03
2020-02
2020-01
2019-12
2019-11
2019-10
2019-09
2019-08
2019-07
2019-06
2019-05
2019-04
2019-03
2019-02
2019-01
2018-12
2018-11
2018-10
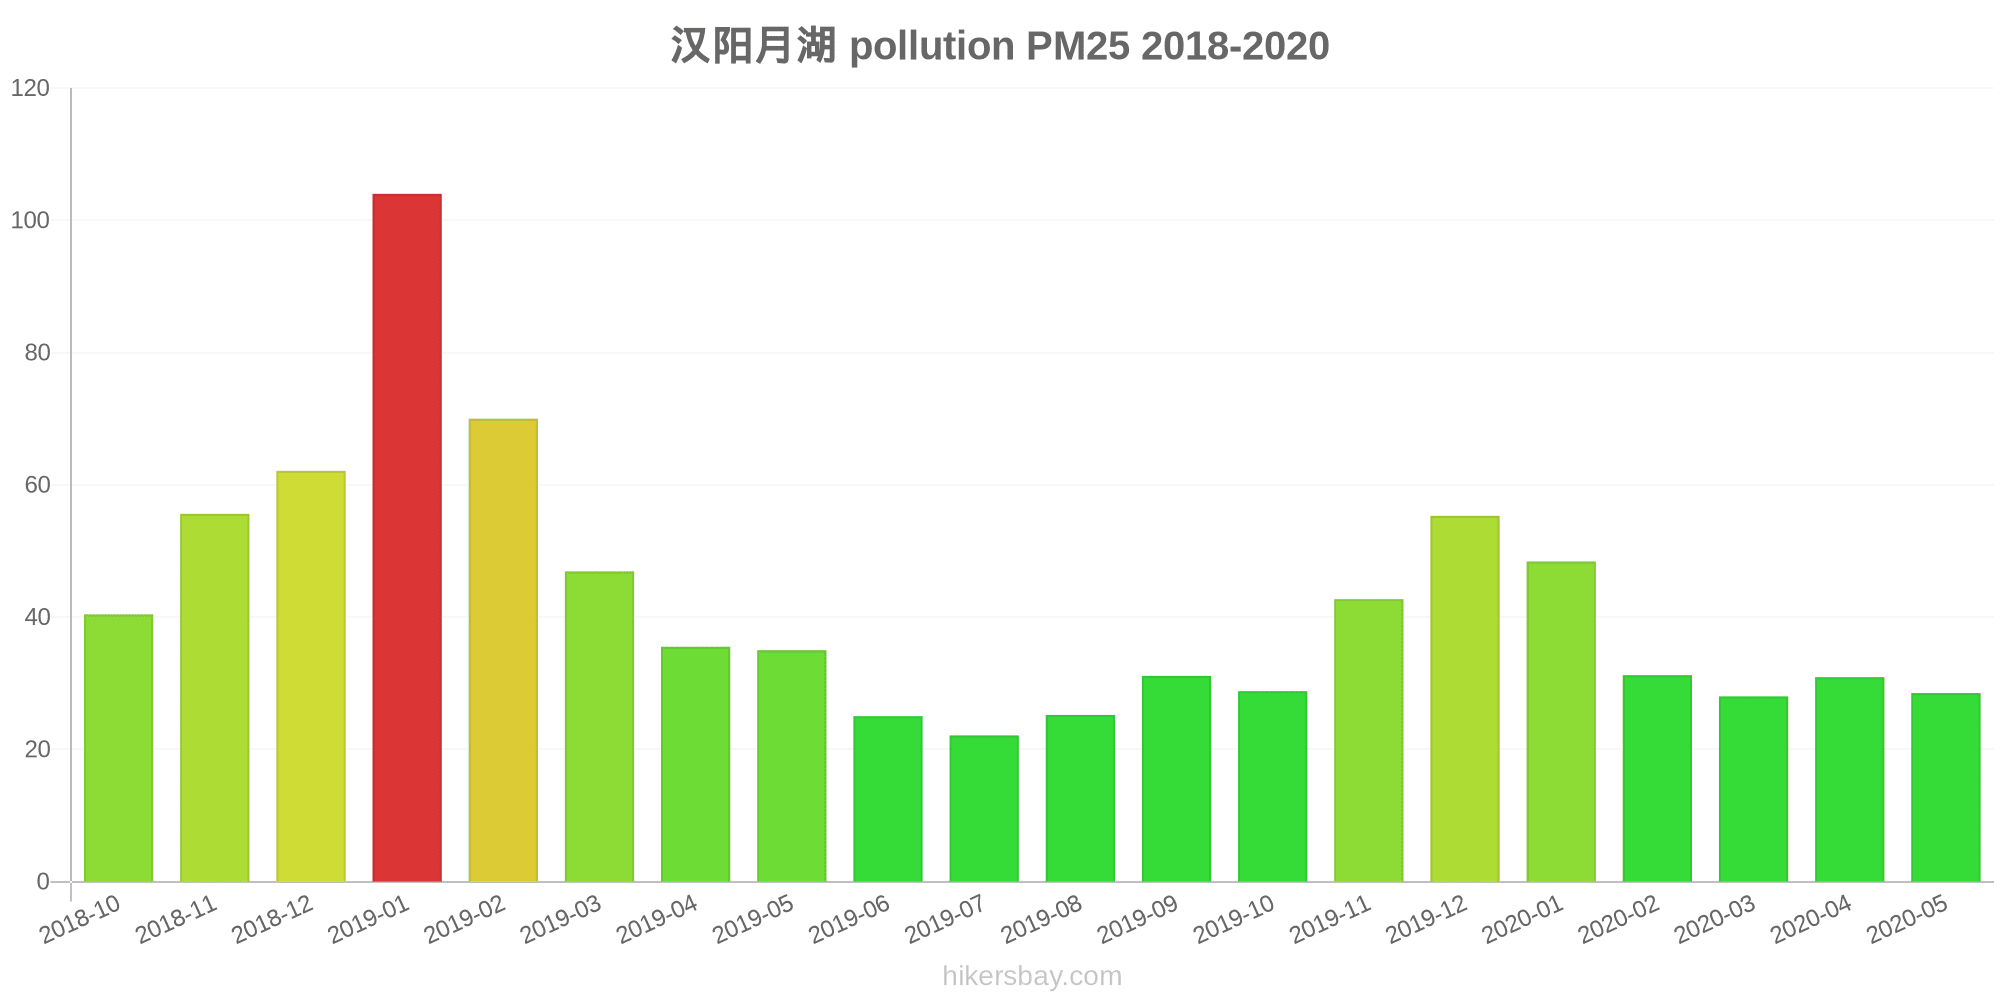
pm25
29
31
28
31
48
55
43
29
31
25
22
25
35
36
47
70
104
62
56
40
co
853
822
933
1
1
1
954
882
1
1
737
954
1
1
1
1
1
971
880
808
no2
28
37
20
18
36
66
63
48
46
28
28
35
51
47
58
39
55
44
54
61
o3
127
135
98
85
55
54
87
119
181
176
147
162
143
131
99
54
37
43
83
110
pm10
54
61
54
48
74
100
92
60
61
51
47
50
80
70
84
81
113
83
79
76
so2
6.2
8.5
7.5
7
6.8
9.8
10
8.2
9.2
6.5
6
6.2
5.7
7.8
9.4
7.7
8.4
11
12
11
* Pollution data source:
https://openaq.org
(ChinaAQIData)
The data is licensed under CC-By 4.0
PM10 179 (Very bad Hazardous)
PM2,5 35 (Unhealthy for Sensitive Groups)
O3 0 (Good)
NO2 0 (Good)
SO2 0 (Good)
Data on air pollution from recent days in Guqintai
| index | 2022-05-27 |
|---|---|
| pm10 | 56 Unhealthy for Sensitive Groups |
| pm25 | 56 Unhealthy |
| o3 | 0 Good |
| no2 | 0 Good |
| so2 | 0 Good |

| index | 2020-05 | 2020-04 | 2020-03 | 2020-02 | 2020-01 | 2019-12 | 2019-11 | 2019-10 | 2019-09 | 2019-08 | 2019-07 | 2019-06 | 2019-05 | 2019-04 | 2019-03 | 2019-02 | 2019-01 | 2018-12 | 2018-11 | 2018-10 |
|---|---|---|---|---|---|---|---|---|---|---|---|---|---|---|---|---|---|---|---|---|
| pm25 | 29 (Moderate) | 31 (Moderate) | 28 (Moderate) | 31 (Moderate) | 48 (Unhealthy for Sensitive Groups) | 55 (Unhealthy) | 43 (Unhealthy for Sensitive Groups) | 29 (Moderate) | 31 (Moderate) | 25 (Moderate) | 22 (Moderate) | 25 (Moderate) | 35 (Unhealthy for Sensitive Groups) | 36 (Unhealthy for Sensitive Groups) | 47 (Unhealthy for Sensitive Groups) | 70 (Unhealthy) | 104 (Very Unhealthy) | 62 (Unhealthy) | 56 (Unhealthy) | 40 (Unhealthy for Sensitive Groups) |
| co | 853 (Good) | 822 (Good) | 933 (Good) | 1 (Good) | 1 (Good) | 1 (Good) | 954 (Good) | 882 (Good) | 1 (Good) | 1 (Good) | 737 (Good) | 954 (Good) | 1 (Good) | 1 (Good) | 1 (Good) | 1 (Good) | 1 (Good) | 971 (Good) | 880 (Good) | 808 (Good) |
| no2 | 28 (Good) | 37 (Good) | 20 (Good) | 18 (Good) | 36 (Good) | 66 (Moderate) | 63 (Moderate) | 48 (Moderate) | 46 (Moderate) | 28 (Good) | 28 (Good) | 35 (Good) | 51 (Moderate) | 47 (Moderate) | 58 (Moderate) | 39 (Good) | 55 (Moderate) | 44 (Moderate) | 54 (Moderate) | 61 (Moderate) |
| o3 | 127 (Unhealthy for Sensitive Groups) | 135 (Unhealthy for Sensitive Groups) | 98 (Moderate) | 85 (Moderate) | 55 (Good) | 54 (Good) | 87 (Moderate) | 119 (Moderate) | 181 (Very Unhealthy) | 176 (Unhealthy) | 147 (Unhealthy for Sensitive Groups) | 162 (Unhealthy) | 143 (Unhealthy for Sensitive Groups) | 131 (Unhealthy for Sensitive Groups) | 99 (Moderate) | 54 (Good) | 37 (Good) | 43 (Good) | 83 (Moderate) | 110 (Moderate) |
| pm10 | 54 (Unhealthy for Sensitive Groups) | 61 (Unhealthy for Sensitive Groups) | 54 (Unhealthy for Sensitive Groups) | 48 (Moderate) | 74 (Unhealthy for Sensitive Groups) | 100 (Unhealthy) | 92 (Unhealthy) | 60 (Unhealthy for Sensitive Groups) | 61 (Unhealthy for Sensitive Groups) | 51 (Unhealthy for Sensitive Groups) | 47 (Moderate) | 50 (Unhealthy for Sensitive Groups) | 80 (Unhealthy) | 70 (Unhealthy for Sensitive Groups) | 84 (Unhealthy) | 81 (Unhealthy) | 113 (Very Unhealthy) | 83 (Unhealthy) | 79 (Unhealthy for Sensitive Groups) | 76 (Unhealthy for Sensitive Groups) |
| so2 | 6.2 (Good) | 8.5 (Good) | 7.5 (Good) | 7 (Good) | 6.8 (Good) | 9.8 (Good) | 10 (Good) | 8.2 (Good) | 9.2 (Good) | 6.5 (Good) | 6 (Good) | 6.2 (Good) | 5.7 (Good) | 7.8 (Good) | 9.4 (Good) | 7.7 (Good) | 8.4 (Good) | 11 (Good) | 12 (Good) | 11 (Good) |
PM10 179 (Very bad Hazardous)
particulate matter (PM10) suspended dustPM2,5 35 (Unhealthy for Sensitive Groups)
particulate matter (PM2.5) dustO3 0.04 (Good)
ozone (O3)NO2 0 (Good)
nitrogen dioxide (NO2)SO2 0 (Good)
sulfur dioxide (SO2)汉阳月湖
| index | 2022-05-27 |
|---|---|
| pm10 | 56 |
| pm25 | 56 |
| o3 | 0.03 |
| no2 | 0 |
| so2 | 0 |
汉阳月湖
| index | 2020-05 | 2020-04 | 2020-03 | 2020-02 | 2020-01 | 2019-12 | 2019-11 | 2019-10 | 2019-09 | 2019-08 | 2019-07 | 2019-06 | 2019-05 | 2019-04 | 2019-03 | 2019-02 | 2019-01 | 2018-12 | 2018-11 | 2018-10 |
|---|---|---|---|---|---|---|---|---|---|---|---|---|---|---|---|---|---|---|---|---|
| pm25 | 29 | 31 | 28 | 31 | 48 | 55 | 43 | 29 | 31 | 25 | 22 | 25 | 35 | 36 | 47 | 70 | 104 | 62 | 56 | 40 |
| co | 853 | 822 | 933 | 1 | 1 | 1 | 954 | 882 | 1 | 1 | 737 | 954 | 1 | 1 | 1 | 1 | 1 | 971 | 880 | 808 |
| no2 | 28 | 37 | 20 | 18 | 36 | 66 | 63 | 48 | 46 | 28 | 28 | 35 | 51 | 47 | 58 | 39 | 55 | 44 | 54 | 61 |
| o3 | 127 | 135 | 98 | 85 | 55 | 54 | 87 | 119 | 181 | 176 | 147 | 162 | 143 | 131 | 99 | 54 | 37 | 43 | 83 | 110 |
| pm10 | 54 | 61 | 54 | 48 | 74 | 100 | 92 | 60 | 61 | 51 | 47 | 50 | 80 | 70 | 84 | 81 | 113 | 83 | 79 | 76 |
| so2 | 6.2 | 8.5 | 7.5 | 7 | 6.8 | 9.8 | 10 | 8.2 | 9.2 | 6.5 | 6 | 6.2 | 5.7 | 7.8 | 9.4 | 7.7 | 8.4 | 11 | 12 | 11 |