Air Pollution in Zhaocun: Real-time Air Quality Index and smog alert.
Pollution and air quality forecast for Zhaocun. Today is Tuesday, June 2, 2026. The following air pollution values have been recorded for Zhaocun:- particulate matter (PM10) suspended dust - 179 (Very bad Hazardous)
- particulate matter (PM2.5) dust - 35 (Unhealthy for Sensitive Groups)
- ozone (O3) - 0 (Good)
- nitrogen dioxide (NO2) - 0 (Good)
- sulfur dioxide (SO2) - 0 (Good)

What is the air quality in Zhaocun today? Is the air polluted in Zhaocun?. Is there smog?
What is the level of PM10 today in Zhaocun? (particulate matter (PM10) suspended dust)
The current level of particulate matter PM10 in Zhaocun is:
179 (Very bad Hazardous)
The highest PM10 values usually occur in month: 179 (February 2019).
The lowest value of particulate matter PM10 pollution in Zhaocun is usually recorded in: August (50).
What is the current level of PM2.5 in Zhaocun? (particulate matter (PM2.5) dust)
Today's PM2.5 level is:
35 (Unhealthy for Sensitive Groups)
For comparison, the highest level of PM2.5 in Zhaocun in the last 7 days was: 56 (Friday, May 27, 2022) and the lowest: 56 (Friday, May 27, 2022).
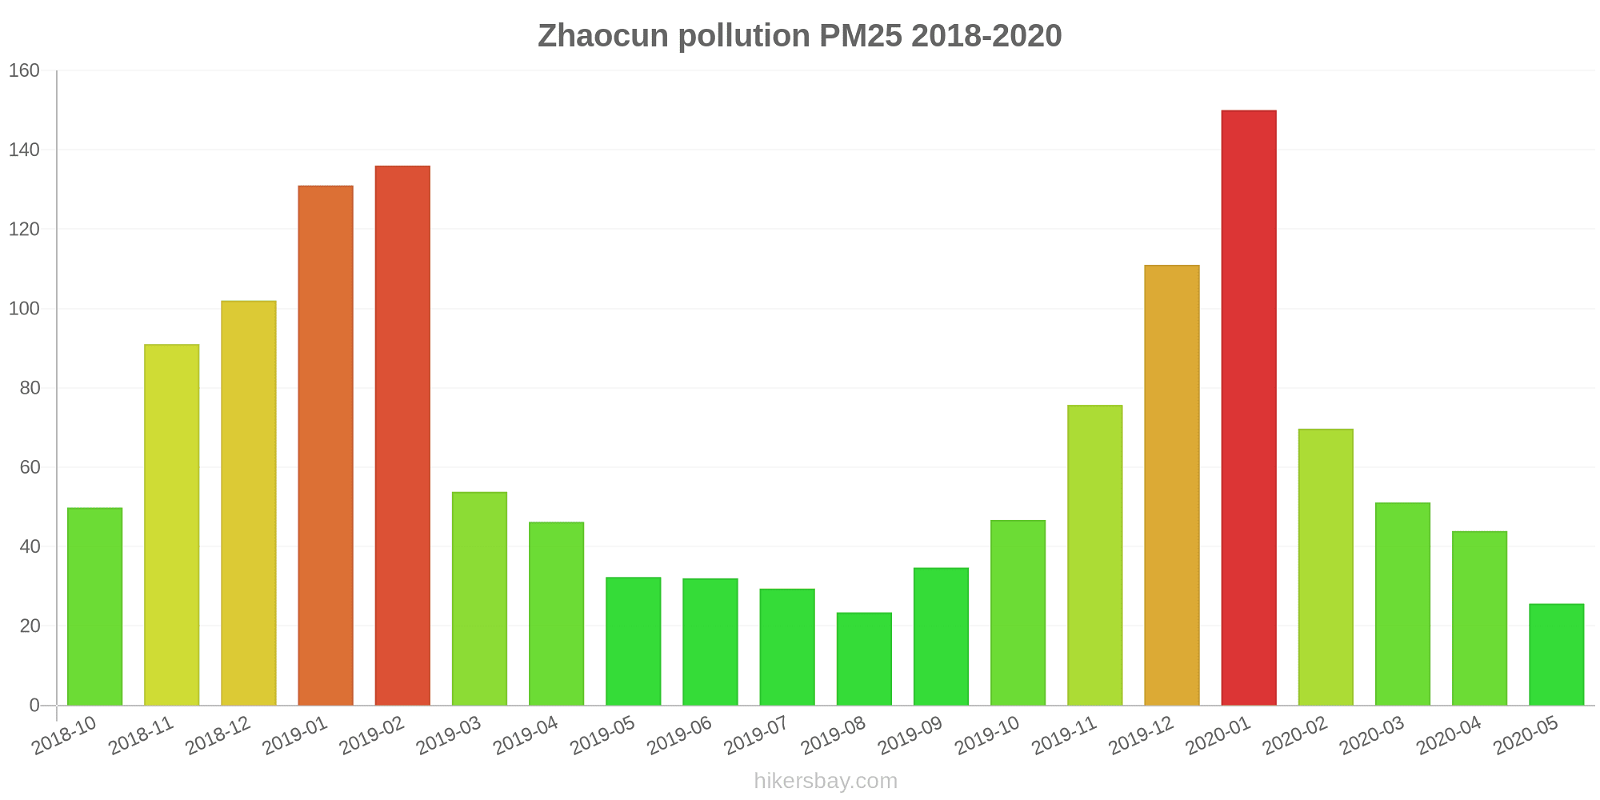
The highest PM2.5 values were recorded: 150 (January 2020).
The lowest level of particulate matter PM2.5 pollution occurs in month: August (23).
How is the O3 level today in Zhaocun? (ozone (O3))
0 (Good)
How high is the level of NO2? (nitrogen dioxide (NO2))
0 (Good)
What is the level of SO2 pollution? (sulfur dioxide (SO2))
0 (Good)
Current data Friday, May 27, 2022, 12:00 PM
PM10 179 (Very bad Hazardous)
PM2,5 35 (Unhealthy for Sensitive Groups)
O3 0 (Good)
NO2 0 (Good)
SO2 0 (Good)
Data on air pollution from recent days in Zhaocun
index
2022-05-27
pm10
56
Unhealthy for Sensitive Groups
pm25
56
Unhealthy
o3
0
Good
no2
0
Good
so2
0
Good
data source »
Air pollution in Zhaocun from October 2018 to May 2020
index
2020-05
2020-04
2020-03
2020-02
2020-01
2019-12
2019-11
2019-10
2019-09
2019-08
2019-07
2019-06
2019-05
2019-04
2019-03
2019-02
2019-01
2018-12
2018-11
2018-10
pm25
26 (Moderate)
44 (Unhealthy for Sensitive Groups)
51 (Unhealthy for Sensitive Groups)
70 (Unhealthy)
150 (Very bad Hazardous)
111 (Very bad Hazardous)
76 (Very Unhealthy)
47 (Unhealthy for Sensitive Groups)
35 (Moderate)
23 (Moderate)
29 (Moderate)
32 (Moderate)
32 (Moderate)
46 (Unhealthy for Sensitive Groups)
54 (Unhealthy for Sensitive Groups)
136 (Very bad Hazardous)
131 (Very bad Hazardous)
102 (Very Unhealthy)
91 (Very Unhealthy)
50 (Unhealthy for Sensitive Groups)
co
490 (Good)
613 (Good)
691 (Good)
879 (Good)
1 (Good)
1 (Good)
1 (Good)
758 (Good)
778 (Good)
726 (Good)
729 (Good)
767 (Good)
770 (Good)
726 (Good)
730 (Good)
1 (Good)
1 (Good)
1 (Good)
1 (Good)
1 (Good)
no2
17 (Good)
30 (Good)
30 (Good)
16 (Good)
45 (Moderate)
49 (Moderate)
45 (Moderate)
38 (Good)
38 (Good)
24 (Good)
22 (Good)
21 (Good)
26 (Good)
24 (Good)
29 (Good)
36 (Good)
59 (Moderate)
55 (Moderate)
47 (Moderate)
47 (Moderate)
o3
139 (Unhealthy for Sensitive Groups)
138 (Unhealthy for Sensitive Groups)
111 (Moderate)
86 (Moderate)
74 (Moderate)
51 (Good)
85 (Moderate)
118 (Moderate)
162 (Unhealthy)
146 (Unhealthy for Sensitive Groups)
184 (Very Unhealthy)
204 (Very Unhealthy)
166 (Unhealthy)
132 (Unhealthy for Sensitive Groups)
134 (Unhealthy for Sensitive Groups)
98 (Moderate)
71 (Moderate)
57 (Good)
86 (Moderate)
118 (Moderate)
pm10
81 (Unhealthy)
89 (Unhealthy)
95 (Unhealthy)
83 (Unhealthy)
159 (Very bad Hazardous)
125 (Very Unhealthy)
128 (Very Unhealthy)
106 (Unhealthy)
80 (Unhealthy)
50 (Moderate)
63 (Unhealthy for Sensitive Groups)
86 (Unhealthy)
103 (Unhealthy)
97 (Unhealthy)
101 (Unhealthy)
179 (Very bad Hazardous)
168 (Very bad Hazardous)
158 (Very bad Hazardous)
154 (Very bad Hazardous)
105 (Unhealthy)
so2
5.1 (Good)
16 (Good)
12 (Good)
8.9 (Good)
13 (Good)
13 (Good)
18 (Good)
13 (Good)
14 (Good)
11 (Good)
3.6 (Good)
6.2 (Good)
9.5 (Good)
11 (Good)
12 (Good)
14 (Good)
23 (Good)
25 (Good)
18 (Good)
26 (Good)
data source »
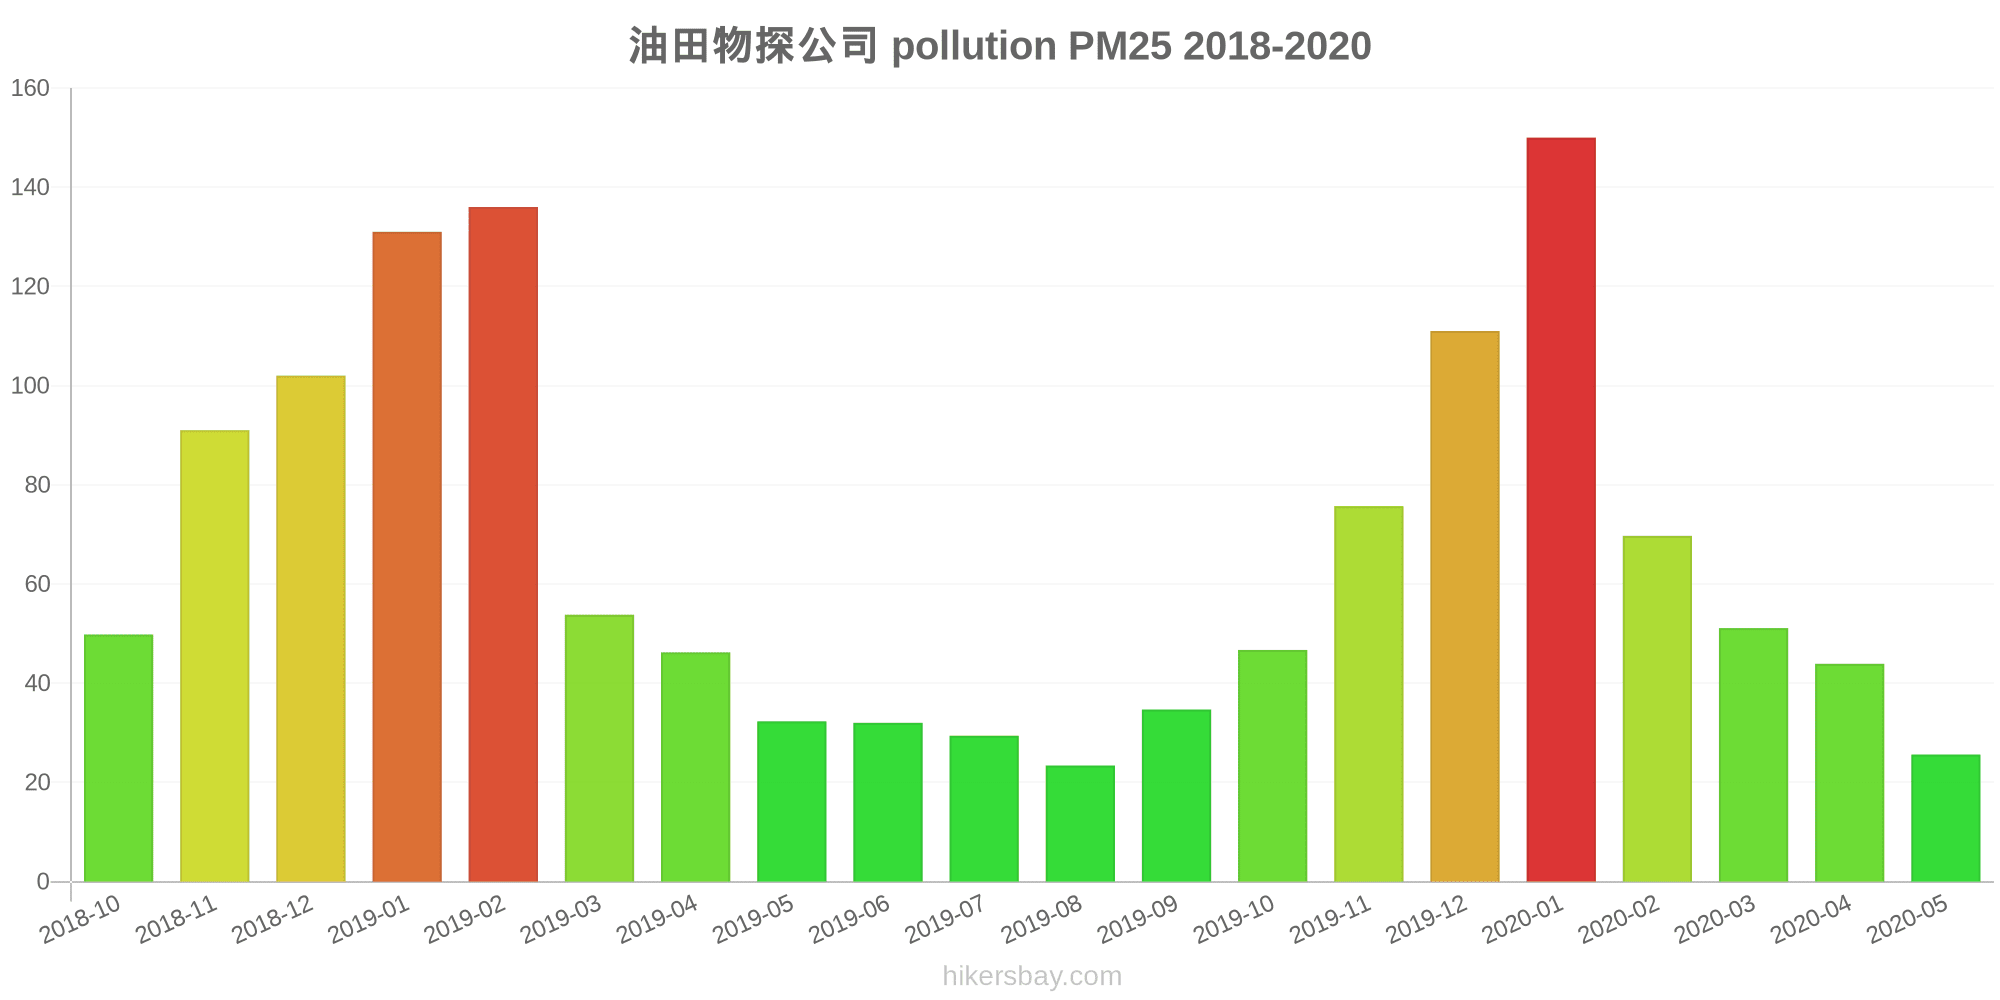
油田物探公司
Friday, May 27, 2022, 12:00 PM
PM10 179 (Very bad Hazardous)
particulate matter (PM10) suspended dust
PM2,5 35 (Unhealthy for Sensitive Groups)
particulate matter (PM2.5) dust
O3 0.04 (Good)
ozone (O3)
NO2 0 (Good)
nitrogen dioxide (NO2)
SO2 0 (Good)
sulfur dioxide (SO2)
油田物探公司
index
2022-05-27
pm10
56
pm25
56
o3
0.03
no2
0
so2
0
油田物探公司
2018-10 2020-05

index
2020-05
2020-04
2020-03
2020-02
2020-01
2019-12
2019-11
2019-10
2019-09
2019-08
2019-07
2019-06
2019-05
2019-04
2019-03
2019-02
2019-01
2018-12
2018-11
2018-10
pm25
26
44
51
70
150
111
76
47
35
23
29
32
32
46
54
136
131
102
91
50
co
490
613
691
879
1
1
1
758
778
726
729
767
770
726
730
1
1
1
1
1
no2
17
30
30
16
45
49
45
38
38
24
22
21
26
24
29
36
59
55
47
47
o3
139
138
111
86
74
51
85
118
162
146
184
204
166
132
134
98
71
57
86
118
pm10
81
89
95
83
159
125
128
106
80
50
63
86
103
97
101
179
168
158
154
105
so2
5.1
16
12
8.9
13
13
18
13
14
11
3.6
6.2
9.5
11
12
14
23
25
18
26
* Pollution data source:
https://openaq.org
(ChinaAQIData)
The data is licensed under CC-By 4.0
PM10 179 (Very bad Hazardous)
PM2,5 35 (Unhealthy for Sensitive Groups)
O3 0 (Good)
NO2 0 (Good)
SO2 0 (Good)
Data on air pollution from recent days in Zhaocun
| index | 2022-05-27 |
|---|---|
| pm10 | 56 Unhealthy for Sensitive Groups |
| pm25 | 56 Unhealthy |
| o3 | 0 Good |
| no2 | 0 Good |
| so2 | 0 Good |

| index | 2020-05 | 2020-04 | 2020-03 | 2020-02 | 2020-01 | 2019-12 | 2019-11 | 2019-10 | 2019-09 | 2019-08 | 2019-07 | 2019-06 | 2019-05 | 2019-04 | 2019-03 | 2019-02 | 2019-01 | 2018-12 | 2018-11 | 2018-10 |
|---|---|---|---|---|---|---|---|---|---|---|---|---|---|---|---|---|---|---|---|---|
| pm25 | 26 (Moderate) | 44 (Unhealthy for Sensitive Groups) | 51 (Unhealthy for Sensitive Groups) | 70 (Unhealthy) | 150 (Very bad Hazardous) | 111 (Very bad Hazardous) | 76 (Very Unhealthy) | 47 (Unhealthy for Sensitive Groups) | 35 (Moderate) | 23 (Moderate) | 29 (Moderate) | 32 (Moderate) | 32 (Moderate) | 46 (Unhealthy for Sensitive Groups) | 54 (Unhealthy for Sensitive Groups) | 136 (Very bad Hazardous) | 131 (Very bad Hazardous) | 102 (Very Unhealthy) | 91 (Very Unhealthy) | 50 (Unhealthy for Sensitive Groups) |
| co | 490 (Good) | 613 (Good) | 691 (Good) | 879 (Good) | 1 (Good) | 1 (Good) | 1 (Good) | 758 (Good) | 778 (Good) | 726 (Good) | 729 (Good) | 767 (Good) | 770 (Good) | 726 (Good) | 730 (Good) | 1 (Good) | 1 (Good) | 1 (Good) | 1 (Good) | 1 (Good) |
| no2 | 17 (Good) | 30 (Good) | 30 (Good) | 16 (Good) | 45 (Moderate) | 49 (Moderate) | 45 (Moderate) | 38 (Good) | 38 (Good) | 24 (Good) | 22 (Good) | 21 (Good) | 26 (Good) | 24 (Good) | 29 (Good) | 36 (Good) | 59 (Moderate) | 55 (Moderate) | 47 (Moderate) | 47 (Moderate) |
| o3 | 139 (Unhealthy for Sensitive Groups) | 138 (Unhealthy for Sensitive Groups) | 111 (Moderate) | 86 (Moderate) | 74 (Moderate) | 51 (Good) | 85 (Moderate) | 118 (Moderate) | 162 (Unhealthy) | 146 (Unhealthy for Sensitive Groups) | 184 (Very Unhealthy) | 204 (Very Unhealthy) | 166 (Unhealthy) | 132 (Unhealthy for Sensitive Groups) | 134 (Unhealthy for Sensitive Groups) | 98 (Moderate) | 71 (Moderate) | 57 (Good) | 86 (Moderate) | 118 (Moderate) |
| pm10 | 81 (Unhealthy) | 89 (Unhealthy) | 95 (Unhealthy) | 83 (Unhealthy) | 159 (Very bad Hazardous) | 125 (Very Unhealthy) | 128 (Very Unhealthy) | 106 (Unhealthy) | 80 (Unhealthy) | 50 (Moderate) | 63 (Unhealthy for Sensitive Groups) | 86 (Unhealthy) | 103 (Unhealthy) | 97 (Unhealthy) | 101 (Unhealthy) | 179 (Very bad Hazardous) | 168 (Very bad Hazardous) | 158 (Very bad Hazardous) | 154 (Very bad Hazardous) | 105 (Unhealthy) |
| so2 | 5.1 (Good) | 16 (Good) | 12 (Good) | 8.9 (Good) | 13 (Good) | 13 (Good) | 18 (Good) | 13 (Good) | 14 (Good) | 11 (Good) | 3.6 (Good) | 6.2 (Good) | 9.5 (Good) | 11 (Good) | 12 (Good) | 14 (Good) | 23 (Good) | 25 (Good) | 18 (Good) | 26 (Good) |
PM10 179 (Very bad Hazardous)
particulate matter (PM10) suspended dustPM2,5 35 (Unhealthy for Sensitive Groups)
particulate matter (PM2.5) dustO3 0.04 (Good)
ozone (O3)NO2 0 (Good)
nitrogen dioxide (NO2)SO2 0 (Good)
sulfur dioxide (SO2)油田物探公司
| index | 2022-05-27 |
|---|---|
| pm10 | 56 |
| pm25 | 56 |
| o3 | 0.03 |
| no2 | 0 |
| so2 | 0 |
油田物探公司
| index | 2020-05 | 2020-04 | 2020-03 | 2020-02 | 2020-01 | 2019-12 | 2019-11 | 2019-10 | 2019-09 | 2019-08 | 2019-07 | 2019-06 | 2019-05 | 2019-04 | 2019-03 | 2019-02 | 2019-01 | 2018-12 | 2018-11 | 2018-10 |
|---|---|---|---|---|---|---|---|---|---|---|---|---|---|---|---|---|---|---|---|---|
| pm25 | 26 | 44 | 51 | 70 | 150 | 111 | 76 | 47 | 35 | 23 | 29 | 32 | 32 | 46 | 54 | 136 | 131 | 102 | 91 | 50 |
| co | 490 | 613 | 691 | 879 | 1 | 1 | 1 | 758 | 778 | 726 | 729 | 767 | 770 | 726 | 730 | 1 | 1 | 1 | 1 | 1 |
| no2 | 17 | 30 | 30 | 16 | 45 | 49 | 45 | 38 | 38 | 24 | 22 | 21 | 26 | 24 | 29 | 36 | 59 | 55 | 47 | 47 |
| o3 | 139 | 138 | 111 | 86 | 74 | 51 | 85 | 118 | 162 | 146 | 184 | 204 | 166 | 132 | 134 | 98 | 71 | 57 | 86 | 118 |
| pm10 | 81 | 89 | 95 | 83 | 159 | 125 | 128 | 106 | 80 | 50 | 63 | 86 | 103 | 97 | 101 | 179 | 168 | 158 | 154 | 105 |
| so2 | 5.1 | 16 | 12 | 8.9 | 13 | 13 | 18 | 13 | 14 | 11 | 3.6 | 6.2 | 9.5 | 11 | 12 | 14 | 23 | 25 | 18 | 26 |