Air Pollution in Botouji: Real-time Air Quality Index and smog alert.
Pollution and air quality forecast for Botouji. Today is Tuesday, June 2, 2026. The following air pollution values have been recorded for Botouji:- particulate matter (PM10) suspended dust - 179 (Very bad Hazardous)
- particulate matter (PM2.5) dust - 35 (Unhealthy for Sensitive Groups)
- ozone (O3) - 0 (Good)
- nitrogen dioxide (NO2) - 0 (Good)
- sulfur dioxide (SO2) - 0 (Good)

What is the air quality in Botouji today? Is the air polluted in Botouji?. Is there smog?
What is the level of PM10 today in Botouji? (particulate matter (PM10) suspended dust)
The current level of particulate matter PM10 in Botouji is:
179 (Very bad Hazardous)
The highest PM10 values usually occur in month: 186 (February 2019).
The lowest value of particulate matter PM10 pollution in Botouji is usually recorded in: August (46).
What is the current level of PM2.5 in Botouji? (particulate matter (PM2.5) dust)
Today's PM2.5 level is:
35 (Unhealthy for Sensitive Groups)
For comparison, the highest level of PM2.5 in Botouji in the last 7 days was: 56 (Friday, May 27, 2022) and the lowest: 56 (Friday, May 27, 2022).
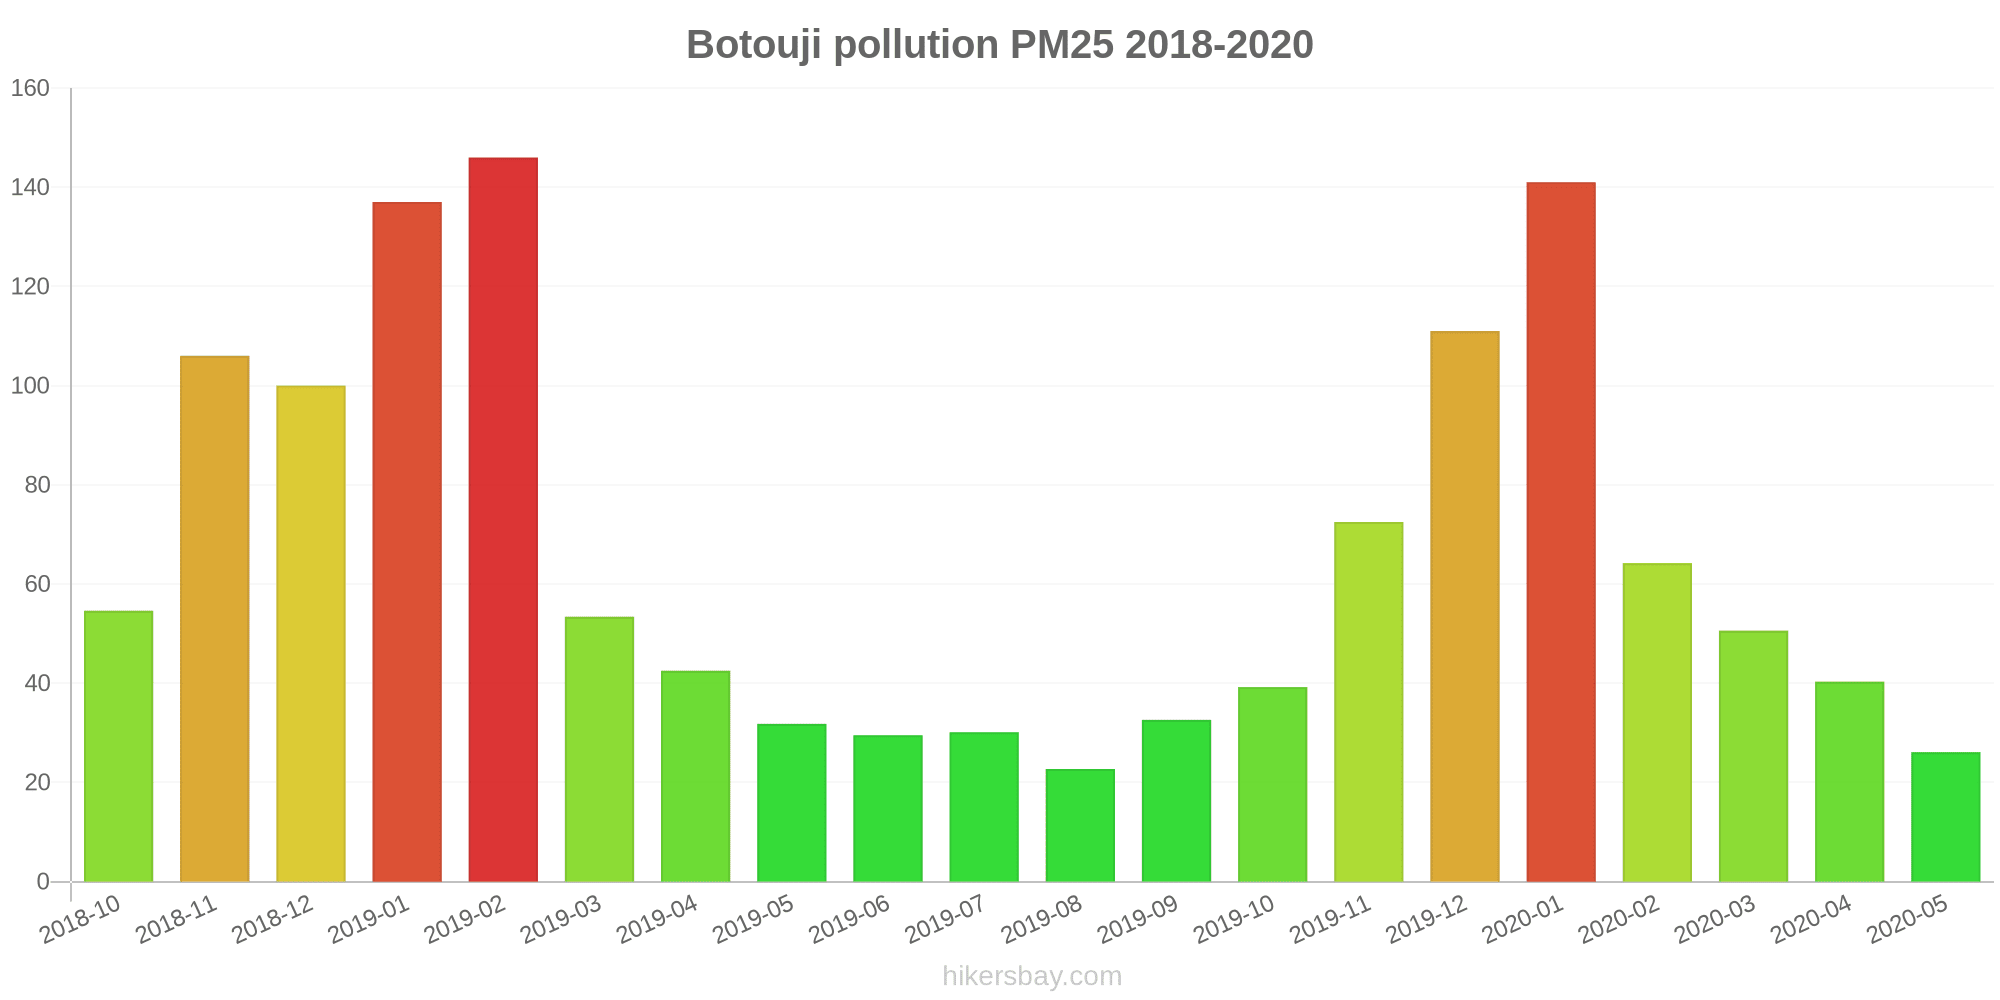
The highest PM2.5 values were recorded: 146 (February 2019).
The lowest level of particulate matter PM2.5 pollution occurs in month: August (23).
How is the O3 level today in Botouji? (ozone (O3))
0 (Good)
How high is the level of NO2? (nitrogen dioxide (NO2))
0 (Good)
What is the level of SO2 pollution? (sulfur dioxide (SO2))
0 (Good)
Current data Friday, May 27, 2022, 12:00 PM
PM10 179 (Very bad Hazardous)
PM2,5 35 (Unhealthy for Sensitive Groups)
O3 0 (Good)
NO2 0 (Good)
SO2 0 (Good)
Data on air pollution from recent days in Botouji
index
2022-05-27
pm10
56
Unhealthy for Sensitive Groups
pm25
56
Unhealthy
o3
0
Good
no2
0
Good
so2
0
Good
data source »
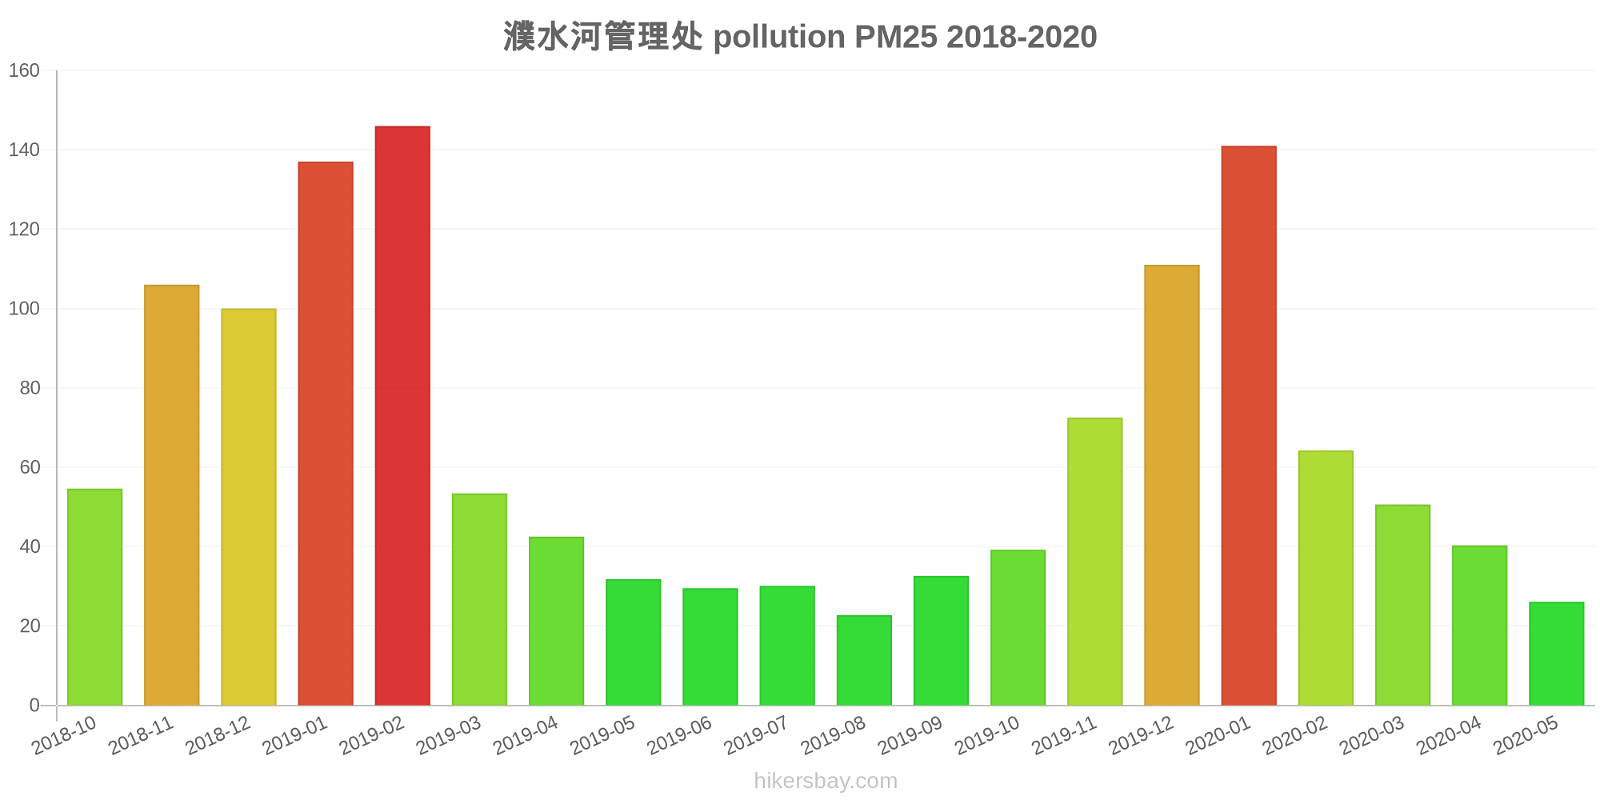
Air pollution in Botouji from October 2018 to May 2020

index
2020-05
2020-04
2020-03
2020-02
2020-01
2019-12
2019-11
2019-10
2019-09
2019-08
2019-07
2019-06
2019-05
2019-04
2019-03
2019-02
2019-01
2018-12
2018-11
2018-10
pm25
26 (Moderate)
40 (Unhealthy for Sensitive Groups)
51 (Unhealthy for Sensitive Groups)
64 (Unhealthy)
141 (Very bad Hazardous)
111 (Very bad Hazardous)
73 (Unhealthy)
39 (Unhealthy for Sensitive Groups)
33 (Moderate)
23 (Moderate)
30 (Moderate)
30 (Moderate)
32 (Moderate)
43 (Unhealthy for Sensitive Groups)
53 (Unhealthy for Sensitive Groups)
146 (Very bad Hazardous)
137 (Very bad Hazardous)
100 (Very Unhealthy)
106 (Very Unhealthy)
55 (Unhealthy for Sensitive Groups)
co
704 (Good)
626 (Good)
725 (Good)
927 (Good)
1 (Good)
1 (Good)
991 (Good)
868 (Good)
804 (Good)
746 (Good)
673 (Good)
807 (Good)
753 (Good)
838 (Good)
843 (Good)
1 (Good)
1 (Good)
1 (Good)
1 (Good)
1 (Good)
no2
18 (Good)
25 (Good)
27 (Good)
14 (Good)
44 (Moderate)
51 (Moderate)
45 (Moderate)
35 (Good)
28 (Good)
20 (Good)
19 (Good)
24 (Good)
25 (Good)
24 (Good)
30 (Good)
30 (Good)
55 (Moderate)
52 (Moderate)
42 (Moderate)
43 (Moderate)
o3
137 (Unhealthy for Sensitive Groups)
130 (Unhealthy for Sensitive Groups)
106 (Moderate)
82 (Moderate)
74 (Moderate)
50 (Good)
81 (Moderate)
110 (Moderate)
164 (Unhealthy)
139 (Unhealthy for Sensitive Groups)
172 (Unhealthy)
189 (Very Unhealthy)
163 (Unhealthy)
128 (Unhealthy for Sensitive Groups)
115 (Moderate)
91 (Moderate)
69 (Good)
57 (Good)
82 (Moderate)
116 (Moderate)
pm10
79 (Unhealthy for Sensitive Groups)
81 (Unhealthy)
89 (Unhealthy)
80 (Unhealthy)
160 (Very bad Hazardous)
128 (Very Unhealthy)
124 (Very Unhealthy)
92 (Unhealthy)
70 (Unhealthy for Sensitive Groups)
46 (Moderate)
56 (Unhealthy for Sensitive Groups)
77 (Unhealthy for Sensitive Groups)
89 (Unhealthy)
98 (Unhealthy)
101 (Unhealthy)
186 (Very bad Hazardous)
163 (Very bad Hazardous)
149 (Very Unhealthy)
141 (Very Unhealthy)
90 (Unhealthy)
so2
9.1 (Good)
14 (Good)
11 (Good)
7.7 (Good)
11 (Good)
11 (Good)
15 (Good)
11 (Good)
11 (Good)
10 (Good)
5.6 (Good)
8.1 (Good)
10 (Good)
9.5 (Good)
11 (Good)
13 (Good)
19 (Good)
19 (Good)
15 (Good)
20 (Good)
data source »
濮水河管理处
Friday, May 27, 2022, 12:00 PM
PM10 179 (Very bad Hazardous)
particulate matter (PM10) suspended dust
PM2,5 35 (Unhealthy for Sensitive Groups)
particulate matter (PM2.5) dust
O3 0.04 (Good)
ozone (O3)
NO2 0 (Good)
nitrogen dioxide (NO2)
SO2 0 (Good)
sulfur dioxide (SO2)
濮水河管理处
index
2022-05-27
pm10
56
pm25
56
o3
0.03
no2
0
so2
0
濮水河管理处
2018-10 2020-05
index
2020-05
2020-04
2020-03
2020-02
2020-01
2019-12
2019-11
2019-10
2019-09
2019-08
2019-07
2019-06
2019-05
2019-04
2019-03
2019-02
2019-01
2018-12
2018-11
2018-10
pm25
26
40
51
64
141
111
73
39
33
23
30
30
32
43
53
146
137
100
106
55
co
704
626
725
927
1
1
991
868
804
746
673
807
753
838
843
1
1
1
1
1
no2
18
25
27
14
44
51
45
35
28
20
19
24
25
24
30
30
55
52
42
43
o3
137
130
106
82
74
50
81
110
164
139
172
189
163
128
115
91
69
57
82
116
pm10
79
81
89
80
160
128
124
92
70
46
56
77
89
98
101
186
163
149
141
90
so2
9.1
14
11
7.7
11
11
15
11
11
10
5.6
8.1
10
9.5
11
13
19
19
15
20
* Pollution data source:
https://openaq.org
(ChinaAQIData)
The data is licensed under CC-By 4.0
PM10 179 (Very bad Hazardous)
PM2,5 35 (Unhealthy for Sensitive Groups)
O3 0 (Good)
NO2 0 (Good)
SO2 0 (Good)
Data on air pollution from recent days in Botouji
| index | 2022-05-27 |
|---|---|
| pm10 | 56 Unhealthy for Sensitive Groups |
| pm25 | 56 Unhealthy |
| o3 | 0 Good |
| no2 | 0 Good |
| so2 | 0 Good |
| index | 2020-05 | 2020-04 | 2020-03 | 2020-02 | 2020-01 | 2019-12 | 2019-11 | 2019-10 | 2019-09 | 2019-08 | 2019-07 | 2019-06 | 2019-05 | 2019-04 | 2019-03 | 2019-02 | 2019-01 | 2018-12 | 2018-11 | 2018-10 |
|---|---|---|---|---|---|---|---|---|---|---|---|---|---|---|---|---|---|---|---|---|
| pm25 | 26 (Moderate) | 40 (Unhealthy for Sensitive Groups) | 51 (Unhealthy for Sensitive Groups) | 64 (Unhealthy) | 141 (Very bad Hazardous) | 111 (Very bad Hazardous) | 73 (Unhealthy) | 39 (Unhealthy for Sensitive Groups) | 33 (Moderate) | 23 (Moderate) | 30 (Moderate) | 30 (Moderate) | 32 (Moderate) | 43 (Unhealthy for Sensitive Groups) | 53 (Unhealthy for Sensitive Groups) | 146 (Very bad Hazardous) | 137 (Very bad Hazardous) | 100 (Very Unhealthy) | 106 (Very Unhealthy) | 55 (Unhealthy for Sensitive Groups) |
| co | 704 (Good) | 626 (Good) | 725 (Good) | 927 (Good) | 1 (Good) | 1 (Good) | 991 (Good) | 868 (Good) | 804 (Good) | 746 (Good) | 673 (Good) | 807 (Good) | 753 (Good) | 838 (Good) | 843 (Good) | 1 (Good) | 1 (Good) | 1 (Good) | 1 (Good) | 1 (Good) |
| no2 | 18 (Good) | 25 (Good) | 27 (Good) | 14 (Good) | 44 (Moderate) | 51 (Moderate) | 45 (Moderate) | 35 (Good) | 28 (Good) | 20 (Good) | 19 (Good) | 24 (Good) | 25 (Good) | 24 (Good) | 30 (Good) | 30 (Good) | 55 (Moderate) | 52 (Moderate) | 42 (Moderate) | 43 (Moderate) |
| o3 | 137 (Unhealthy for Sensitive Groups) | 130 (Unhealthy for Sensitive Groups) | 106 (Moderate) | 82 (Moderate) | 74 (Moderate) | 50 (Good) | 81 (Moderate) | 110 (Moderate) | 164 (Unhealthy) | 139 (Unhealthy for Sensitive Groups) | 172 (Unhealthy) | 189 (Very Unhealthy) | 163 (Unhealthy) | 128 (Unhealthy for Sensitive Groups) | 115 (Moderate) | 91 (Moderate) | 69 (Good) | 57 (Good) | 82 (Moderate) | 116 (Moderate) |
| pm10 | 79 (Unhealthy for Sensitive Groups) | 81 (Unhealthy) | 89 (Unhealthy) | 80 (Unhealthy) | 160 (Very bad Hazardous) | 128 (Very Unhealthy) | 124 (Very Unhealthy) | 92 (Unhealthy) | 70 (Unhealthy for Sensitive Groups) | 46 (Moderate) | 56 (Unhealthy for Sensitive Groups) | 77 (Unhealthy for Sensitive Groups) | 89 (Unhealthy) | 98 (Unhealthy) | 101 (Unhealthy) | 186 (Very bad Hazardous) | 163 (Very bad Hazardous) | 149 (Very Unhealthy) | 141 (Very Unhealthy) | 90 (Unhealthy) |
| so2 | 9.1 (Good) | 14 (Good) | 11 (Good) | 7.7 (Good) | 11 (Good) | 11 (Good) | 15 (Good) | 11 (Good) | 11 (Good) | 10 (Good) | 5.6 (Good) | 8.1 (Good) | 10 (Good) | 9.5 (Good) | 11 (Good) | 13 (Good) | 19 (Good) | 19 (Good) | 15 (Good) | 20 (Good) |
PM10 179 (Very bad Hazardous)
particulate matter (PM10) suspended dustPM2,5 35 (Unhealthy for Sensitive Groups)
particulate matter (PM2.5) dustO3 0.04 (Good)
ozone (O3)NO2 0 (Good)
nitrogen dioxide (NO2)SO2 0 (Good)
sulfur dioxide (SO2)濮水河管理处
| index | 2022-05-27 |
|---|---|
| pm10 | 56 |
| pm25 | 56 |
| o3 | 0.03 |
| no2 | 0 |
| so2 | 0 |
濮水河管理处

| index | 2020-05 | 2020-04 | 2020-03 | 2020-02 | 2020-01 | 2019-12 | 2019-11 | 2019-10 | 2019-09 | 2019-08 | 2019-07 | 2019-06 | 2019-05 | 2019-04 | 2019-03 | 2019-02 | 2019-01 | 2018-12 | 2018-11 | 2018-10 |
|---|---|---|---|---|---|---|---|---|---|---|---|---|---|---|---|---|---|---|---|---|
| pm25 | 26 | 40 | 51 | 64 | 141 | 111 | 73 | 39 | 33 | 23 | 30 | 30 | 32 | 43 | 53 | 146 | 137 | 100 | 106 | 55 |
| co | 704 | 626 | 725 | 927 | 1 | 1 | 991 | 868 | 804 | 746 | 673 | 807 | 753 | 838 | 843 | 1 | 1 | 1 | 1 | 1 |
| no2 | 18 | 25 | 27 | 14 | 44 | 51 | 45 | 35 | 28 | 20 | 19 | 24 | 25 | 24 | 30 | 30 | 55 | 52 | 42 | 43 |
| o3 | 137 | 130 | 106 | 82 | 74 | 50 | 81 | 110 | 164 | 139 | 172 | 189 | 163 | 128 | 115 | 91 | 69 | 57 | 82 | 116 |
| pm10 | 79 | 81 | 89 | 80 | 160 | 128 | 124 | 92 | 70 | 46 | 56 | 77 | 89 | 98 | 101 | 186 | 163 | 149 | 141 | 90 |
| so2 | 9.1 | 14 | 11 | 7.7 | 11 | 11 | 15 | 11 | 11 | 10 | 5.6 | 8.1 | 10 | 9.5 | 11 | 13 | 19 | 19 | 15 | 20 |