Air Pollution in Daizhuang: Real-time Air Quality Index and smog alert.
Pollution and air quality forecast for Daizhuang. Today is Tuesday, June 2, 2026. The following air pollution values have been recorded for Daizhuang:- particulate matter (PM10) suspended dust - 179 (Very bad Hazardous)
- particulate matter (PM2.5) dust - 35 (Unhealthy for Sensitive Groups)
- ozone (O3) - 0 (Good)
- nitrogen dioxide (NO2) - 0 (Good)
- sulfur dioxide (SO2) - 0 (Good)

What is the air quality in Daizhuang today? Is the air polluted in Daizhuang?. Is there smog?
What is the level of PM10 today in Daizhuang? (particulate matter (PM10) suspended dust)
The current level of particulate matter PM10 in Daizhuang is:
179 (Very bad Hazardous)
The highest PM10 values usually occur in month: 156 (February 2019).
The lowest value of particulate matter PM10 pollution in Daizhuang is usually recorded in: July (52).
What is the current level of PM2.5 in Daizhuang? (particulate matter (PM2.5) dust)
Today's PM2.5 level is:
35 (Unhealthy for Sensitive Groups)
For comparison, the highest level of PM2.5 in Daizhuang in the last 7 days was: 56 (Friday, May 27, 2022) and the lowest: 56 (Friday, May 27, 2022).
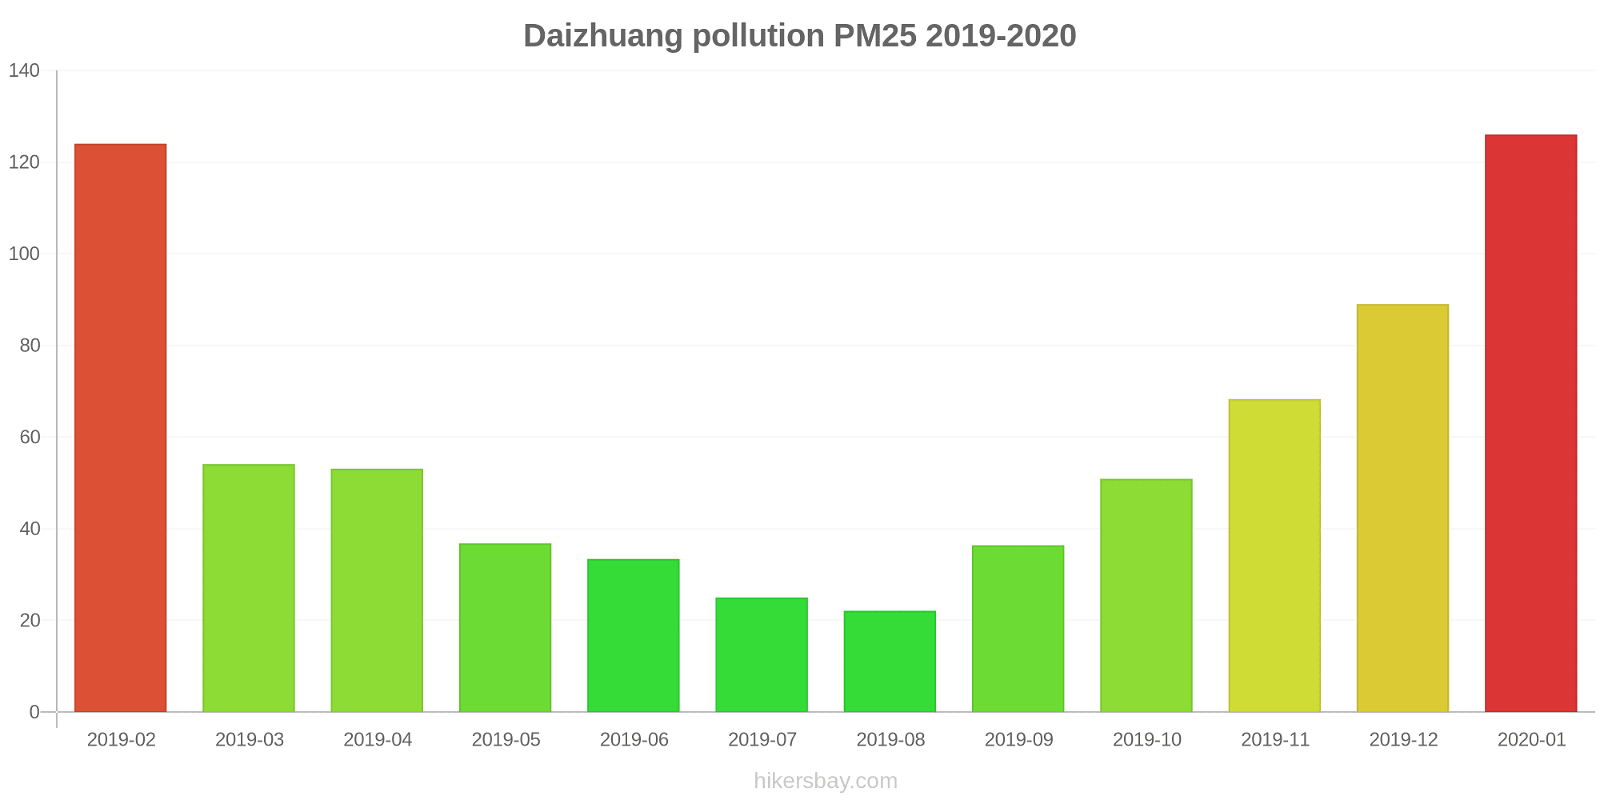
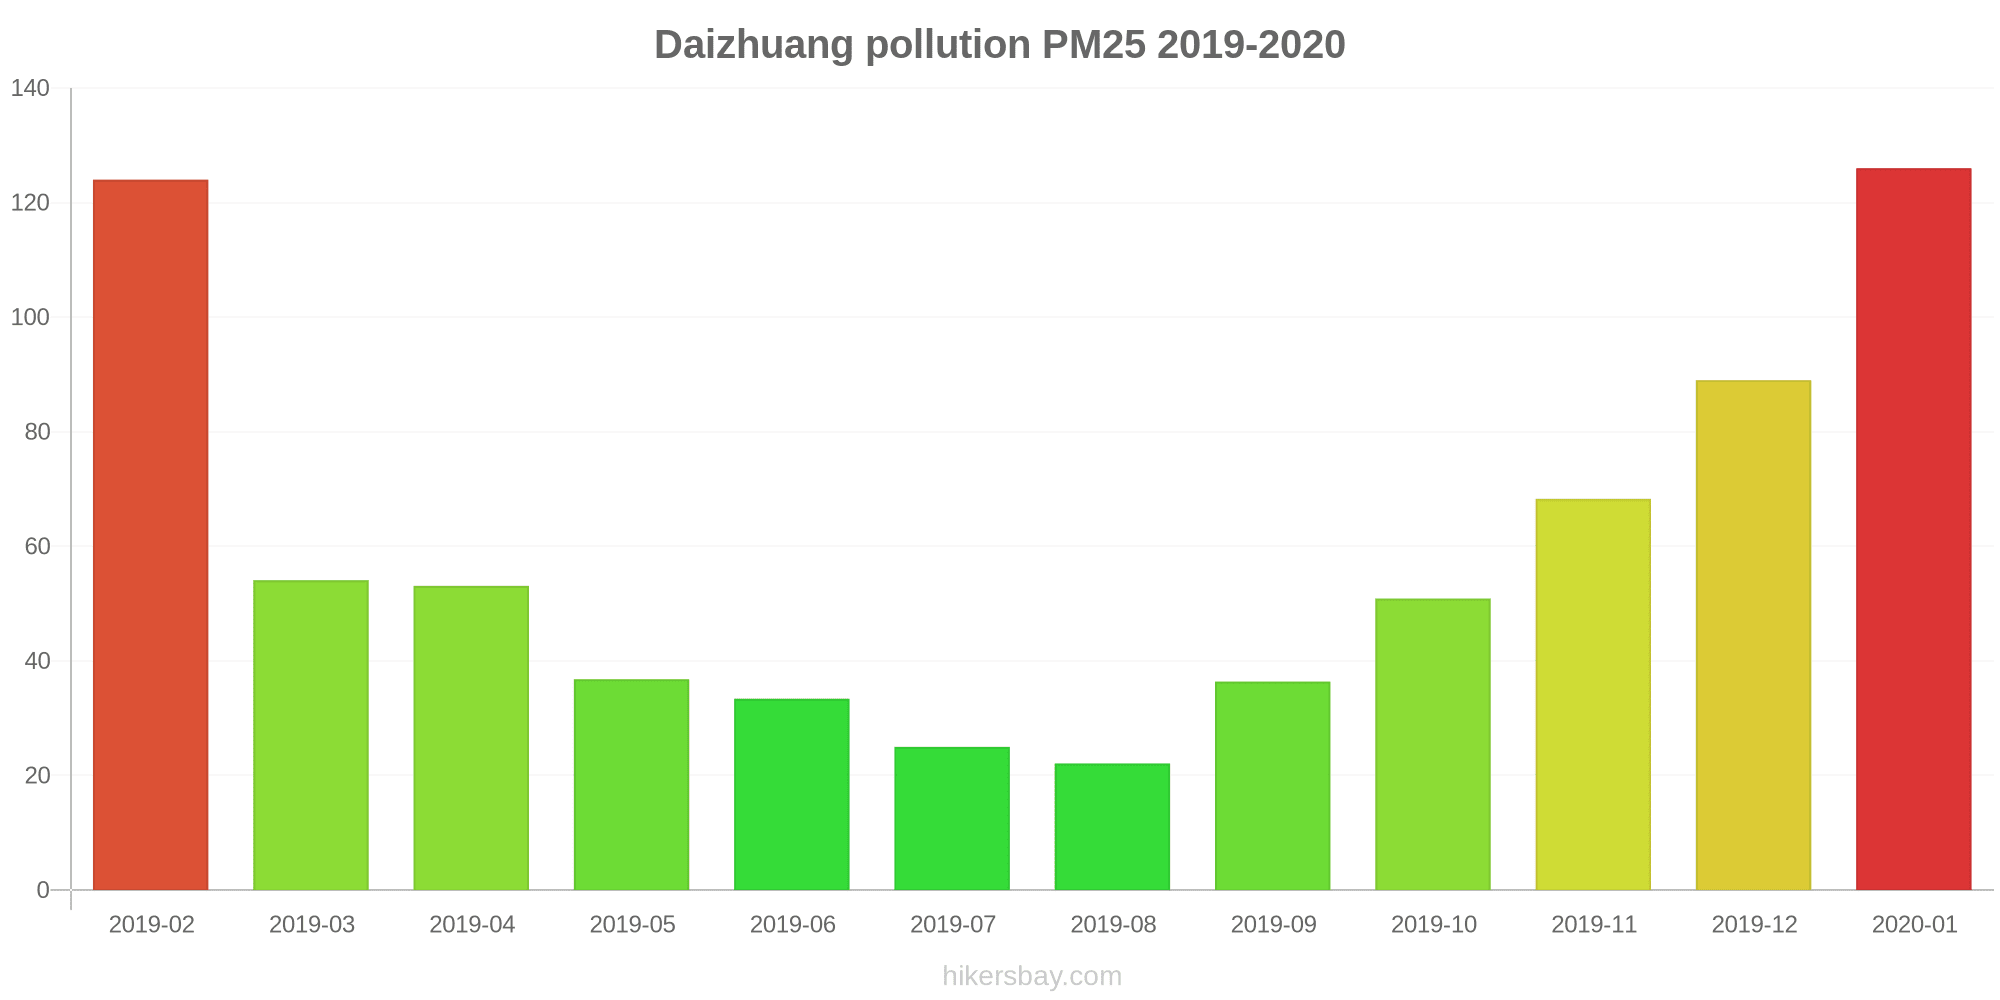
The highest PM2.5 values were recorded: 126 (January 2020).
The lowest level of particulate matter PM2.5 pollution occurs in month: August (22).
How is the O3 level today in Daizhuang? (ozone (O3))
0 (Good)
How high is the level of NO2? (nitrogen dioxide (NO2))
0 (Good)
What is the level of SO2 pollution? (sulfur dioxide (SO2))
0 (Good)
Current data Friday, May 27, 2022, 12:00 PM
PM10 179 (Very bad Hazardous)
PM2,5 35 (Unhealthy for Sensitive Groups)
O3 0 (Good)
NO2 0 (Good)
SO2 0 (Good)
Data on air pollution from recent days in Daizhuang
index
2022-05-27
pm10
56
Unhealthy for Sensitive Groups
pm25
56
Unhealthy
o3
0
Good
no2
0
Good
so2
0
Good
data source »
Air pollution in Daizhuang from February 2019 to January 2020
index
2020-01
2019-12
2019-11
2019-10
2019-09
2019-08
2019-07
2019-06
2019-05
2019-04
2019-03
2019-02
pm25
126 (Very bad Hazardous)
89 (Very Unhealthy)
68 (Unhealthy)
51 (Unhealthy for Sensitive Groups)
36 (Unhealthy for Sensitive Groups)
22 (Moderate)
25 (Moderate)
33 (Moderate)
37 (Unhealthy for Sensitive Groups)
53 (Unhealthy for Sensitive Groups)
54 (Unhealthy for Sensitive Groups)
124 (Very bad Hazardous)
co
1 (Good)
986 (Good)
845 (Good)
588 (Good)
639 (Good)
574 (Good)
655 (Good)
661 (Good)
606 (Good)
768 (Good)
643 (Good)
1 (Good)
no2
43 (Moderate)
42 (Moderate)
44 (Moderate)
41 (Moderate)
30 (Good)
22 (Good)
17 (Good)
22 (Good)
27 (Good)
27 (Good)
33 (Good)
54 (Moderate)
o3
57 (Good)
65 (Good)
95 (Moderate)
118 (Moderate)
166 (Unhealthy)
144 (Unhealthy for Sensitive Groups)
180 (Very Unhealthy)
191 (Very Unhealthy)
155 (Unhealthy)
132 (Unhealthy for Sensitive Groups)
118 (Moderate)
142 (Unhealthy for Sensitive Groups)
pm10
125 (Very Unhealthy)
96 (Unhealthy)
116 (Very Unhealthy)
107 (Unhealthy)
75 (Unhealthy for Sensitive Groups)
53 (Unhealthy for Sensitive Groups)
52 (Unhealthy for Sensitive Groups)
70 (Unhealthy for Sensitive Groups)
91 (Unhealthy)
87 (Unhealthy)
98 (Unhealthy)
156 (Very bad Hazardous)
so2
7.9 (Good)
7.7 (Good)
16 (Good)
14 (Good)
14 (Good)
10 (Good)
7 (Good)
6.8 (Good)
7.5 (Good)
8.3 (Good)
9.2 (Good)
11 (Good)
data source »
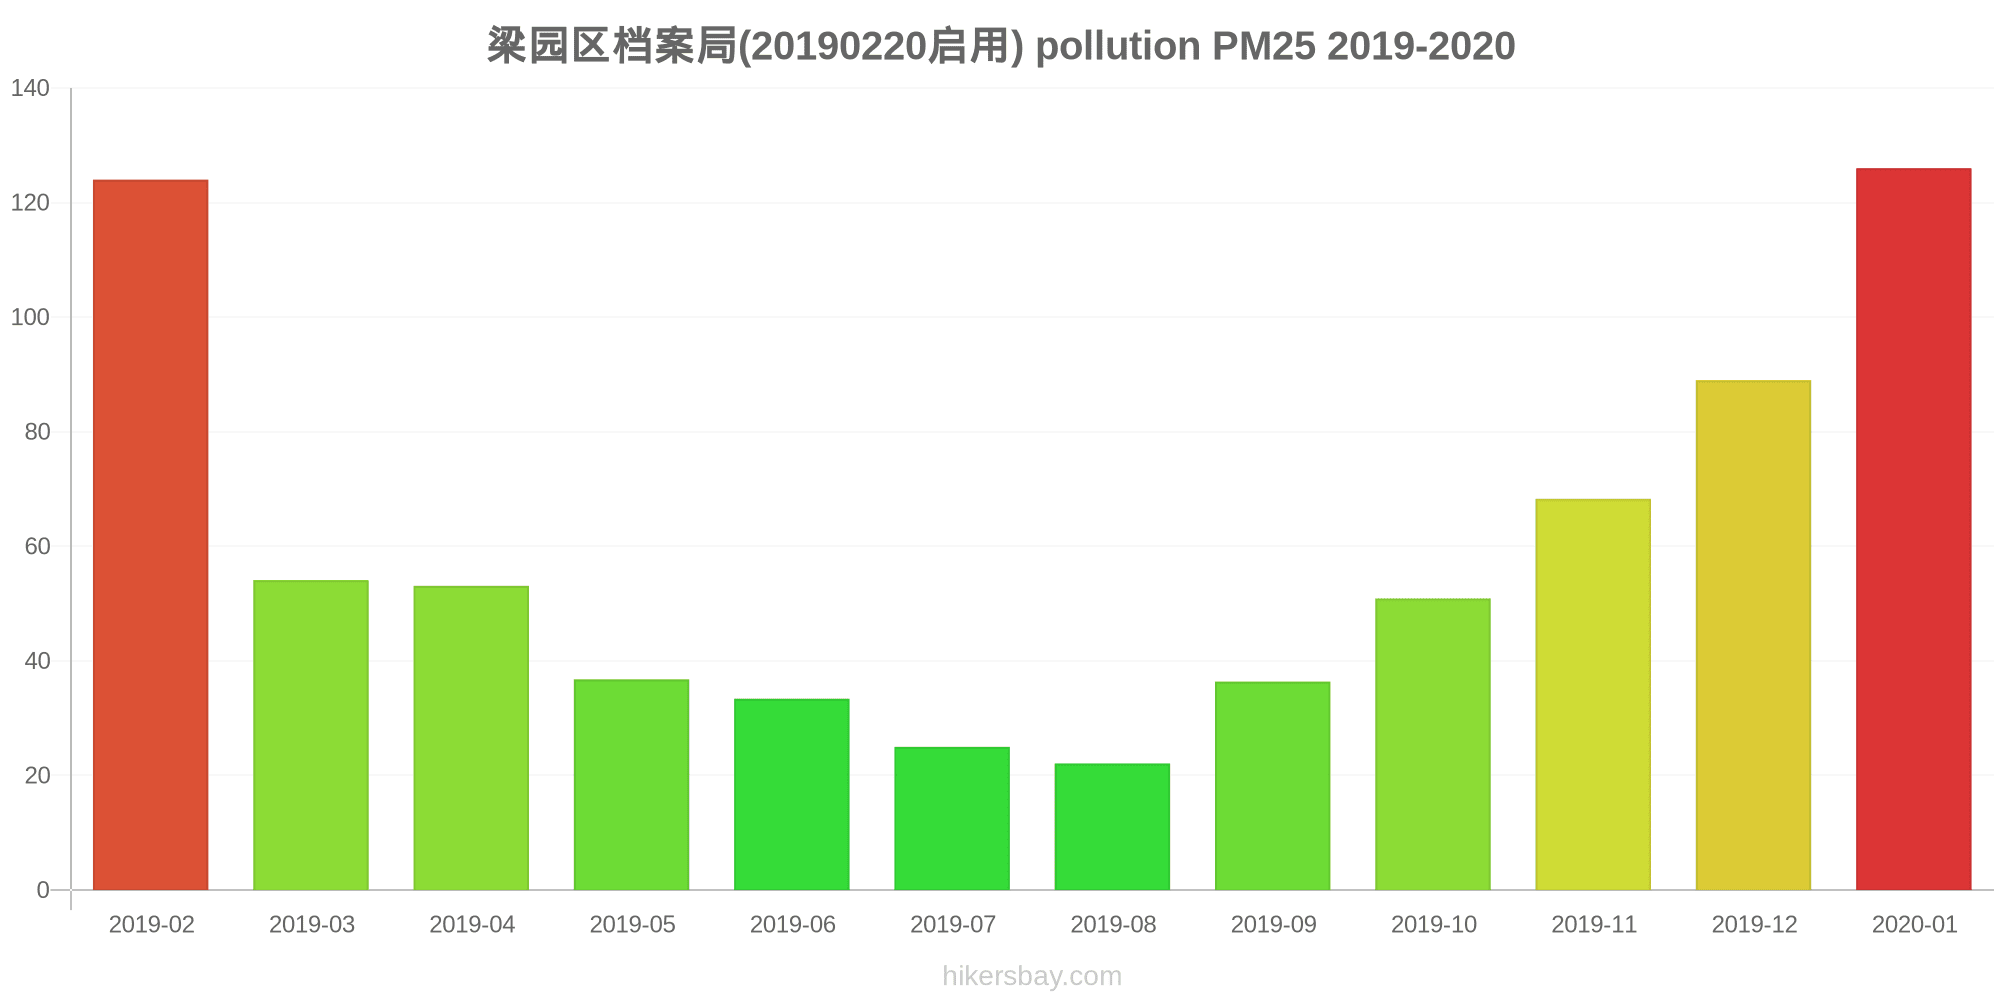
梁园区档案局(20190220启用)
Friday, May 27, 2022, 12:00 PM
PM10 179 (Very bad Hazardous)
particulate matter (PM10) suspended dust
PM2,5 35 (Unhealthy for Sensitive Groups)
particulate matter (PM2.5) dust
O3 0.04 (Good)
ozone (O3)
NO2 0 (Good)
nitrogen dioxide (NO2)
SO2 0 (Good)
sulfur dioxide (SO2)
梁园区档案局(20190220启用)
index
2022-05-27
pm10
56
pm25
56
o3
0.03
no2
0
so2
0
梁园区档案局(20190220启用)
2019-02 2020-01

index
2020-01
2019-12
2019-11
2019-10
2019-09
2019-08
2019-07
2019-06
2019-05
2019-04
2019-03
2019-02
pm25
126
89
68
51
36
22
25
33
37
53
54
124
co
1
986
845
588
639
574
655
661
606
768
643
1
no2
43
42
44
41
30
22
17
22
27
27
33
54
o3
57
65
95
118
166
144
180
191
155
132
118
142
pm10
125
96
116
107
75
53
52
70
91
87
98
156
so2
7.9
7.7
16
14
14
10
7
6.8
7.5
8.3
9.2
11
* Pollution data source:
https://openaq.org
()
The data is licensed under CC-By 4.0
PM10 179 (Very bad Hazardous)
PM2,5 35 (Unhealthy for Sensitive Groups)
O3 0 (Good)
NO2 0 (Good)
SO2 0 (Good)
Data on air pollution from recent days in Daizhuang
| index | 2022-05-27 |
|---|---|
| pm10 | 56 Unhealthy for Sensitive Groups |
| pm25 | 56 Unhealthy |
| o3 | 0 Good |
| no2 | 0 Good |
| so2 | 0 Good |
| index | 2020-01 | 2019-12 | 2019-11 | 2019-10 | 2019-09 | 2019-08 | 2019-07 | 2019-06 | 2019-05 | 2019-04 | 2019-03 | 2019-02 |
|---|---|---|---|---|---|---|---|---|---|---|---|---|
| pm25 | 126 (Very bad Hazardous) | 89 (Very Unhealthy) | 68 (Unhealthy) | 51 (Unhealthy for Sensitive Groups) | 36 (Unhealthy for Sensitive Groups) | 22 (Moderate) | 25 (Moderate) | 33 (Moderate) | 37 (Unhealthy for Sensitive Groups) | 53 (Unhealthy for Sensitive Groups) | 54 (Unhealthy for Sensitive Groups) | 124 (Very bad Hazardous) |
| co | 1 (Good) | 986 (Good) | 845 (Good) | 588 (Good) | 639 (Good) | 574 (Good) | 655 (Good) | 661 (Good) | 606 (Good) | 768 (Good) | 643 (Good) | 1 (Good) |
| no2 | 43 (Moderate) | 42 (Moderate) | 44 (Moderate) | 41 (Moderate) | 30 (Good) | 22 (Good) | 17 (Good) | 22 (Good) | 27 (Good) | 27 (Good) | 33 (Good) | 54 (Moderate) |
| o3 | 57 (Good) | 65 (Good) | 95 (Moderate) | 118 (Moderate) | 166 (Unhealthy) | 144 (Unhealthy for Sensitive Groups) | 180 (Very Unhealthy) | 191 (Very Unhealthy) | 155 (Unhealthy) | 132 (Unhealthy for Sensitive Groups) | 118 (Moderate) | 142 (Unhealthy for Sensitive Groups) |
| pm10 | 125 (Very Unhealthy) | 96 (Unhealthy) | 116 (Very Unhealthy) | 107 (Unhealthy) | 75 (Unhealthy for Sensitive Groups) | 53 (Unhealthy for Sensitive Groups) | 52 (Unhealthy for Sensitive Groups) | 70 (Unhealthy for Sensitive Groups) | 91 (Unhealthy) | 87 (Unhealthy) | 98 (Unhealthy) | 156 (Very bad Hazardous) |
| so2 | 7.9 (Good) | 7.7 (Good) | 16 (Good) | 14 (Good) | 14 (Good) | 10 (Good) | 7 (Good) | 6.8 (Good) | 7.5 (Good) | 8.3 (Good) | 9.2 (Good) | 11 (Good) |
PM10 179 (Very bad Hazardous)
particulate matter (PM10) suspended dustPM2,5 35 (Unhealthy for Sensitive Groups)
particulate matter (PM2.5) dustO3 0.04 (Good)
ozone (O3)NO2 0 (Good)
nitrogen dioxide (NO2)SO2 0 (Good)
sulfur dioxide (SO2)梁园区档案局(20190220启用)
| index | 2022-05-27 |
|---|---|
| pm10 | 56 |
| pm25 | 56 |
| o3 | 0.03 |
| no2 | 0 |
| so2 | 0 |
梁园区档案局(20190220启用)
| index | 2020-01 | 2019-12 | 2019-11 | 2019-10 | 2019-09 | 2019-08 | 2019-07 | 2019-06 | 2019-05 | 2019-04 | 2019-03 | 2019-02 |
|---|---|---|---|---|---|---|---|---|---|---|---|---|
| pm25 | 126 | 89 | 68 | 51 | 36 | 22 | 25 | 33 | 37 | 53 | 54 | 124 |
| co | 1 | 986 | 845 | 588 | 639 | 574 | 655 | 661 | 606 | 768 | 643 | 1 |
| no2 | 43 | 42 | 44 | 41 | 30 | 22 | 17 | 22 | 27 | 27 | 33 | 54 |
| o3 | 57 | 65 | 95 | 118 | 166 | 144 | 180 | 191 | 155 | 132 | 118 | 142 |
| pm10 | 125 | 96 | 116 | 107 | 75 | 53 | 52 | 70 | 91 | 87 | 98 | 156 |
| so2 | 7.9 | 7.7 | 16 | 14 | 14 | 10 | 7 | 6.8 | 7.5 | 8.3 | 9.2 | 11 |