Air Pollution in Wulou: Real-time Air Quality Index and smog alert.
Pollution and air quality forecast for Wulou. Today is Tuesday, June 16, 2026. The following air pollution values have been recorded for Wulou:- particulate matter (PM10) suspended dust - 53 (Unhealthy for Sensitive Groups)
- ozone (O3) - 0 (Good)
- particulate matter (PM2.5) dust - 7 (Good)
- sulfur dioxide (SO2) - 18 (Good)
- nitrogen dioxide (NO2) - 3 (Good)
- carbon monoxide (CO) - 1 (Good)

What is the air quality in Wulou today? Is the air polluted in Wulou?. Is there smog?
What is the level of PM10 today in Wulou? (particulate matter (PM10) suspended dust)
The current level of particulate matter PM10 in Wulou is:
53 (Unhealthy for Sensitive Groups)
The highest PM10 values usually occur in month: 186 (January 2019).
The lowest value of particulate matter PM10 pollution in Wulou is usually recorded in: August (51).
How is the O3 level today in Wulou? (ozone (O3))
0 (Good)
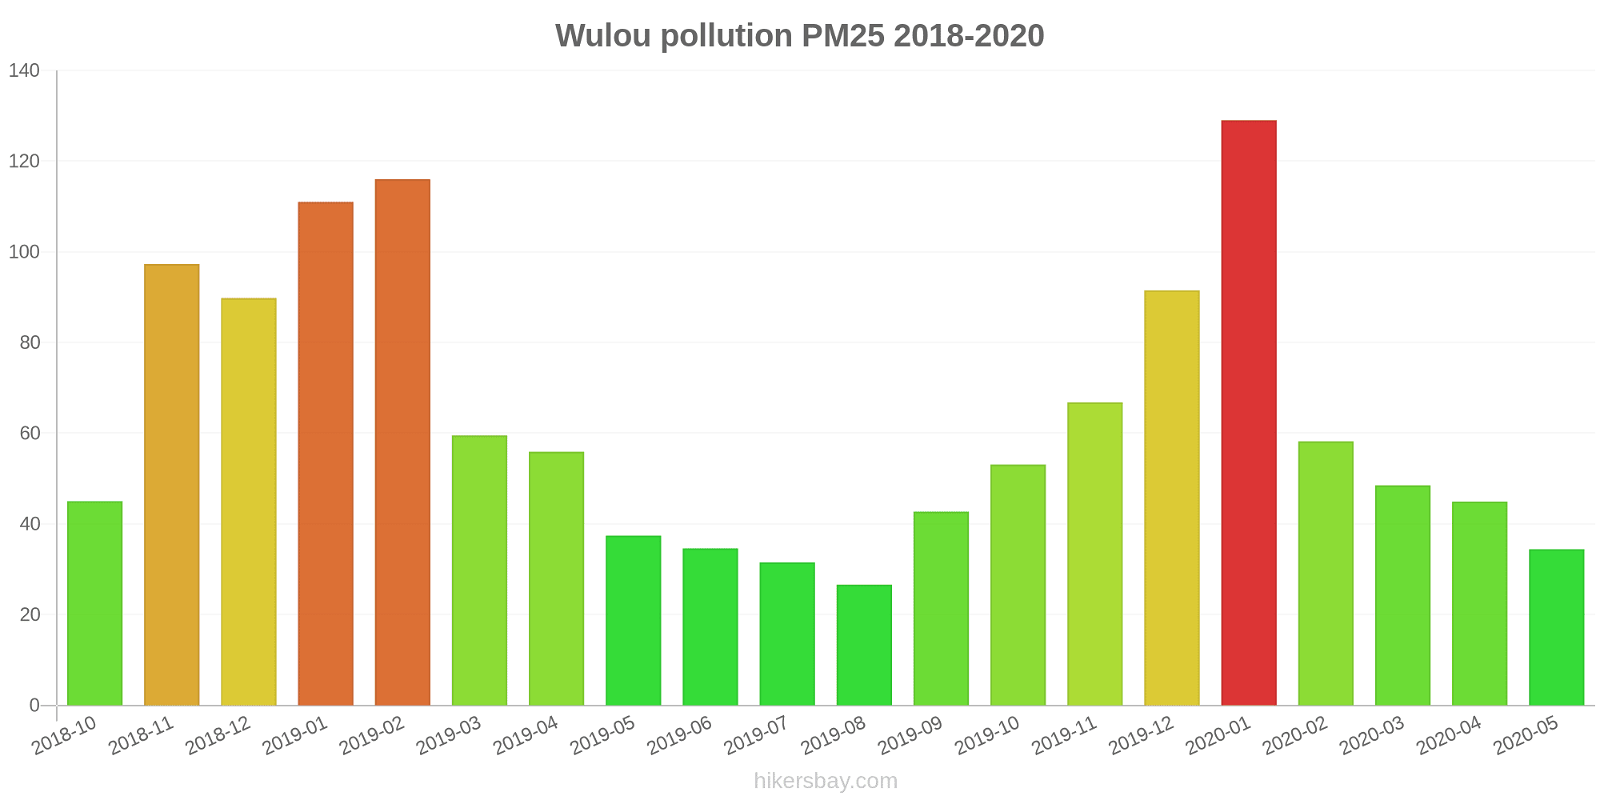
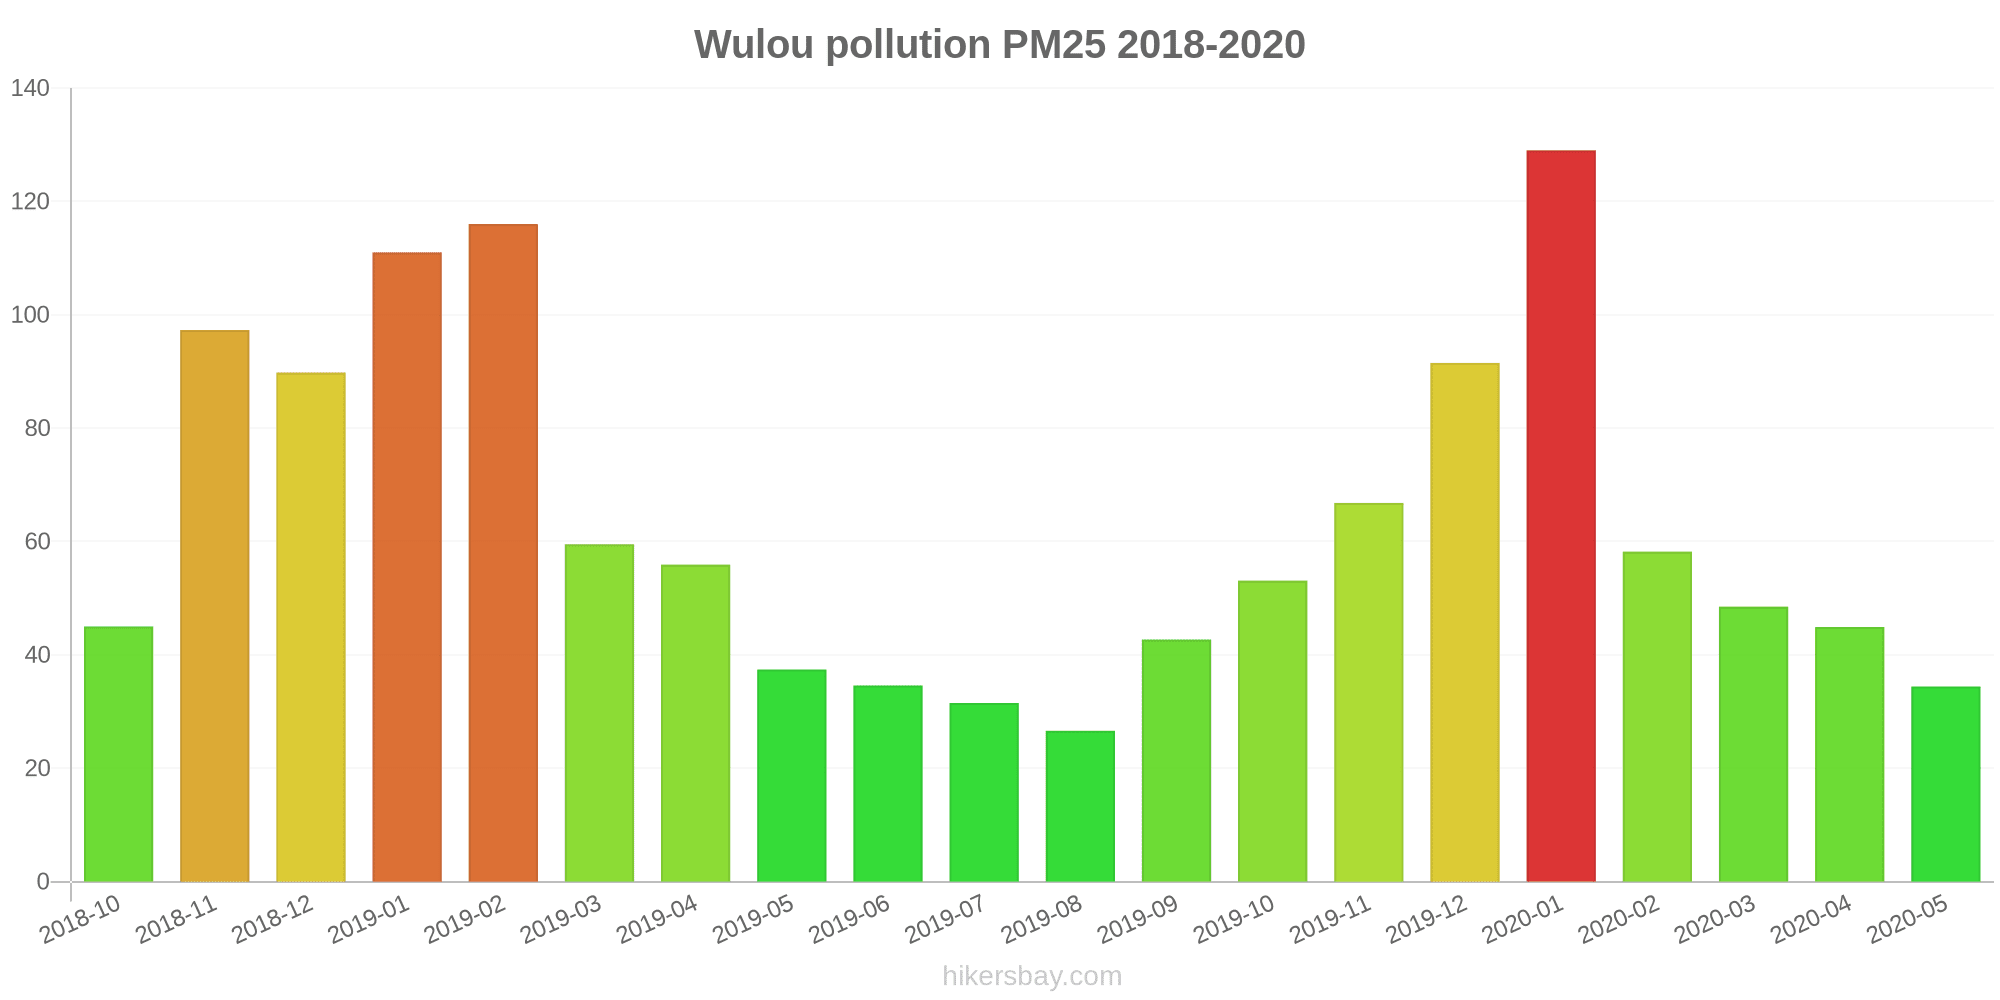
What is the current level of PM2.5 in Wulou? (particulate matter (PM2.5) dust)
Today's PM2.5 level is:
7 (Good)
For comparison, the highest level of PM2.5 in Wulou in the last 7 days was: 21 (Friday, May 27, 2022) and the lowest: 21 (Friday, May 27, 2022).
The highest PM2.5 values were recorded: 129 (January 2020).
The lowest level of particulate matter PM2.5 pollution occurs in month: August (27).
What is the level of SO2 pollution? (sulfur dioxide (SO2))
18 (Good)
How high is the level of NO2? (nitrogen dioxide (NO2))
3 (Good)
How high is the CO level? (carbon monoxide (CO))
1 (Good)
Current data Friday, May 27, 2022, 12:00 PM
PM10 53 (Unhealthy for Sensitive Groups)
O3 0 (Good)
PM2,5 7 (Good)
SO2 18 (Good)
NO2 3 (Good)
CO 1 (Good)
Data on air pollution from recent days in Wulou
index
2022-05-27
pm10
51
Unhealthy for Sensitive Groups
o3
0
Good
pm25
21
Moderate
so2
10
Good
no2
0
Good
co
1
Good
data source »
Air pollution in Wulou from October 2018 to May 2020
index
2020-05
2020-04
2020-03
2020-02
2020-01
2019-12
2019-11
2019-10
2019-09
2019-08
2019-07
2019-06
2019-05
2019-04
2019-03
2019-02
2019-01
2018-12
2018-11
2018-10
pm25
34 (Moderate)
45 (Unhealthy for Sensitive Groups)
49 (Unhealthy for Sensitive Groups)
58 (Unhealthy)
129 (Very bad Hazardous)
92 (Very Unhealthy)
67 (Unhealthy)
53 (Unhealthy for Sensitive Groups)
43 (Unhealthy for Sensitive Groups)
27 (Moderate)
32 (Moderate)
35 (Moderate)
37 (Unhealthy for Sensitive Groups)
56 (Unhealthy)
60 (Unhealthy)
116 (Very bad Hazardous)
111 (Very bad Hazardous)
90 (Very Unhealthy)
97 (Very Unhealthy)
45 (Unhealthy for Sensitive Groups)
co
520 (Good)
509 (Good)
517 (Good)
718 (Good)
1 (Good)
1 (Good)
740 (Good)
850 (Good)
876 (Good)
815 (Good)
740 (Good)
754 (Good)
524 (Good)
671 (Good)
708 (Good)
1 (Good)
1 (Good)
1 (Good)
1 (Good)
746 (Good)
no2
18 (Good)
29 (Good)
32 (Good)
21 (Good)
48 (Moderate)
50 (Moderate)
50 (Moderate)
45 (Moderate)
34 (Good)
30 (Good)
21 (Good)
24 (Good)
27 (Good)
31 (Good)
38 (Good)
41 (Moderate)
59 (Moderate)
61 (Moderate)
52 (Moderate)
53 (Moderate)
o3
151 (Unhealthy)
136 (Unhealthy for Sensitive Groups)
113 (Moderate)
93 (Moderate)
72 (Moderate)
51 (Good)
81 (Moderate)
122 (Unhealthy for Sensitive Groups)
180 (Very Unhealthy)
152 (Unhealthy)
207 (Very Unhealthy)
225 (Very Unhealthy)
175 (Unhealthy)
139 (Unhealthy for Sensitive Groups)
131 (Unhealthy for Sensitive Groups)
100 (Moderate)
70 (Good)
51 (Good)
81 (Moderate)
109 (Moderate)
pm10
67 (Unhealthy for Sensitive Groups)
87 (Unhealthy)
104 (Unhealthy)
76 (Unhealthy for Sensitive Groups)
159 (Very bad Hazardous)
131 (Very Unhealthy)
138 (Very Unhealthy)
112 (Very Unhealthy)
87 (Unhealthy)
51 (Unhealthy for Sensitive Groups)
63 (Unhealthy for Sensitive Groups)
87 (Unhealthy)
99 (Unhealthy)
115 (Very Unhealthy)
133 (Very Unhealthy)
166 (Very bad Hazardous)
186 (Very bad Hazardous)
166 (Very bad Hazardous)
170 (Very bad Hazardous)
104 (Unhealthy)
so2
7.5 (Good)
11 (Good)
13 (Good)
7.5 (Good)
14 (Good)
13 (Good)
17 (Good)
14 (Good)
12 (Good)
11 (Good)
9.2 (Good)
16 (Good)
17 (Good)
14 (Good)
13 (Good)
16 (Good)
24 (Good)
23 (Good)
13 (Good)
16 (Good)
data source »
聊大东校
Friday, May 27, 2022, 12:00 PM
PM10 53 (Unhealthy for Sensitive Groups)
particulate matter (PM10) suspended dust
O3 0.02 (Good)
ozone (O3)
PM2,5 6.6 (Good)
particulate matter (PM2.5) dust
SO2 18 (Good)
sulfur dioxide (SO2)
NO2 3 (Good)
nitrogen dioxide (NO2)
CO 1.3 (Good)
carbon monoxide (CO)
聊大东校
index
2022-05-27
pm10
51
o3
0.02
pm25
21
so2
9.6
no2
0.38
co
0.64
聊大东校
2018-10 2020-05

index
2020-05
2020-04
2020-03
2020-02
2020-01
2019-12
2019-11
2019-10
2019-09
2019-08
2019-07
2019-06
2019-05
2019-04
2019-03
2019-02
2019-01
2018-12
2018-11
2018-10
pm25
34
45
49
58
129
92
67
53
43
27
32
35
37
56
60
116
111
90
97
45
co
520
509
517
718
1
1
740
850
876
815
740
754
524
671
708
1
1
1
1
746
no2
18
29
32
21
48
50
50
45
34
30
21
24
27
31
38
41
59
61
52
53
o3
151
136
113
93
72
51
81
122
180
152
207
225
175
139
131
100
70
51
81
109
pm10
67
87
104
76
159
131
138
112
87
51
63
87
99
115
133
166
186
166
170
104
so2
7.5
11
13
7.5
14
13
17
14
12
11
9.2
16
17
14
13
16
24
23
13
16
* Pollution data source:
https://openaq.org
(ChinaAQIData)
The data is licensed under CC-By 4.0
PM10 53 (Unhealthy for Sensitive Groups)
O3 0 (Good)
PM2,5 7 (Good)
SO2 18 (Good)
NO2 3 (Good)
CO 1 (Good)
Data on air pollution from recent days in Wulou
| index | 2022-05-27 |
|---|---|
| pm10 | 51 Unhealthy for Sensitive Groups |
| o3 | 0 Good |
| pm25 | 21 Moderate |
| so2 | 10 Good |
| no2 | 0 Good |
| co | 1 Good |
| index | 2020-05 | 2020-04 | 2020-03 | 2020-02 | 2020-01 | 2019-12 | 2019-11 | 2019-10 | 2019-09 | 2019-08 | 2019-07 | 2019-06 | 2019-05 | 2019-04 | 2019-03 | 2019-02 | 2019-01 | 2018-12 | 2018-11 | 2018-10 |
|---|---|---|---|---|---|---|---|---|---|---|---|---|---|---|---|---|---|---|---|---|
| pm25 | 34 (Moderate) | 45 (Unhealthy for Sensitive Groups) | 49 (Unhealthy for Sensitive Groups) | 58 (Unhealthy) | 129 (Very bad Hazardous) | 92 (Very Unhealthy) | 67 (Unhealthy) | 53 (Unhealthy for Sensitive Groups) | 43 (Unhealthy for Sensitive Groups) | 27 (Moderate) | 32 (Moderate) | 35 (Moderate) | 37 (Unhealthy for Sensitive Groups) | 56 (Unhealthy) | 60 (Unhealthy) | 116 (Very bad Hazardous) | 111 (Very bad Hazardous) | 90 (Very Unhealthy) | 97 (Very Unhealthy) | 45 (Unhealthy for Sensitive Groups) |
| co | 520 (Good) | 509 (Good) | 517 (Good) | 718 (Good) | 1 (Good) | 1 (Good) | 740 (Good) | 850 (Good) | 876 (Good) | 815 (Good) | 740 (Good) | 754 (Good) | 524 (Good) | 671 (Good) | 708 (Good) | 1 (Good) | 1 (Good) | 1 (Good) | 1 (Good) | 746 (Good) |
| no2 | 18 (Good) | 29 (Good) | 32 (Good) | 21 (Good) | 48 (Moderate) | 50 (Moderate) | 50 (Moderate) | 45 (Moderate) | 34 (Good) | 30 (Good) | 21 (Good) | 24 (Good) | 27 (Good) | 31 (Good) | 38 (Good) | 41 (Moderate) | 59 (Moderate) | 61 (Moderate) | 52 (Moderate) | 53 (Moderate) |
| o3 | 151 (Unhealthy) | 136 (Unhealthy for Sensitive Groups) | 113 (Moderate) | 93 (Moderate) | 72 (Moderate) | 51 (Good) | 81 (Moderate) | 122 (Unhealthy for Sensitive Groups) | 180 (Very Unhealthy) | 152 (Unhealthy) | 207 (Very Unhealthy) | 225 (Very Unhealthy) | 175 (Unhealthy) | 139 (Unhealthy for Sensitive Groups) | 131 (Unhealthy for Sensitive Groups) | 100 (Moderate) | 70 (Good) | 51 (Good) | 81 (Moderate) | 109 (Moderate) |
| pm10 | 67 (Unhealthy for Sensitive Groups) | 87 (Unhealthy) | 104 (Unhealthy) | 76 (Unhealthy for Sensitive Groups) | 159 (Very bad Hazardous) | 131 (Very Unhealthy) | 138 (Very Unhealthy) | 112 (Very Unhealthy) | 87 (Unhealthy) | 51 (Unhealthy for Sensitive Groups) | 63 (Unhealthy for Sensitive Groups) | 87 (Unhealthy) | 99 (Unhealthy) | 115 (Very Unhealthy) | 133 (Very Unhealthy) | 166 (Very bad Hazardous) | 186 (Very bad Hazardous) | 166 (Very bad Hazardous) | 170 (Very bad Hazardous) | 104 (Unhealthy) |
| so2 | 7.5 (Good) | 11 (Good) | 13 (Good) | 7.5 (Good) | 14 (Good) | 13 (Good) | 17 (Good) | 14 (Good) | 12 (Good) | 11 (Good) | 9.2 (Good) | 16 (Good) | 17 (Good) | 14 (Good) | 13 (Good) | 16 (Good) | 24 (Good) | 23 (Good) | 13 (Good) | 16 (Good) |
PM10 53 (Unhealthy for Sensitive Groups)
particulate matter (PM10) suspended dustO3 0.02 (Good)
ozone (O3)PM2,5 6.6 (Good)
particulate matter (PM2.5) dustSO2 18 (Good)
sulfur dioxide (SO2)NO2 3 (Good)
nitrogen dioxide (NO2)CO 1.3 (Good)
carbon monoxide (CO)聊大东校
| index | 2022-05-27 |
|---|---|
| pm10 | 51 |
| o3 | 0.02 |
| pm25 | 21 |
| so2 | 9.6 |
| no2 | 0.38 |
| co | 0.64 |
聊大东校

| index | 2020-05 | 2020-04 | 2020-03 | 2020-02 | 2020-01 | 2019-12 | 2019-11 | 2019-10 | 2019-09 | 2019-08 | 2019-07 | 2019-06 | 2019-05 | 2019-04 | 2019-03 | 2019-02 | 2019-01 | 2018-12 | 2018-11 | 2018-10 |
|---|---|---|---|---|---|---|---|---|---|---|---|---|---|---|---|---|---|---|---|---|
| pm25 | 34 | 45 | 49 | 58 | 129 | 92 | 67 | 53 | 43 | 27 | 32 | 35 | 37 | 56 | 60 | 116 | 111 | 90 | 97 | 45 |
| co | 520 | 509 | 517 | 718 | 1 | 1 | 740 | 850 | 876 | 815 | 740 | 754 | 524 | 671 | 708 | 1 | 1 | 1 | 1 | 746 |
| no2 | 18 | 29 | 32 | 21 | 48 | 50 | 50 | 45 | 34 | 30 | 21 | 24 | 27 | 31 | 38 | 41 | 59 | 61 | 52 | 53 |
| o3 | 151 | 136 | 113 | 93 | 72 | 51 | 81 | 122 | 180 | 152 | 207 | 225 | 175 | 139 | 131 | 100 | 70 | 51 | 81 | 109 |
| pm10 | 67 | 87 | 104 | 76 | 159 | 131 | 138 | 112 | 87 | 51 | 63 | 87 | 99 | 115 | 133 | 166 | 186 | 166 | 170 | 104 |
| so2 | 7.5 | 11 | 13 | 7.5 | 14 | 13 | 17 | 14 | 12 | 11 | 9.2 | 16 | 17 | 14 | 13 | 16 | 24 | 23 | 13 | 16 |