Air Pollution in Laowangfu: Real-time Air Quality Index and smog alert.
Pollution and air quality forecast for Laowangfu. Today is Tuesday, June 16, 2026. The following air pollution values have been recorded for Laowangfu:- particulate matter (PM10) suspended dust - 53 (Unhealthy for Sensitive Groups)
- ozone (O3) - 0 (Good)
- particulate matter (PM2.5) dust - 7 (Good)
- sulfur dioxide (SO2) - 18 (Good)
- nitrogen dioxide (NO2) - 3 (Good)
- carbon monoxide (CO) - 1 (Good)

What is the air quality in Laowangfu today? Is the air polluted in Laowangfu?. Is there smog?
What is the level of PM10 today in Laowangfu? (particulate matter (PM10) suspended dust)
The current level of particulate matter PM10 in Laowangfu is:
53 (Unhealthy for Sensitive Groups)
The highest PM10 values usually occur in month: 163 (January 2019).
The lowest value of particulate matter PM10 pollution in Laowangfu is usually recorded in: August (43).
How is the O3 level today in Laowangfu? (ozone (O3))
0 (Good)
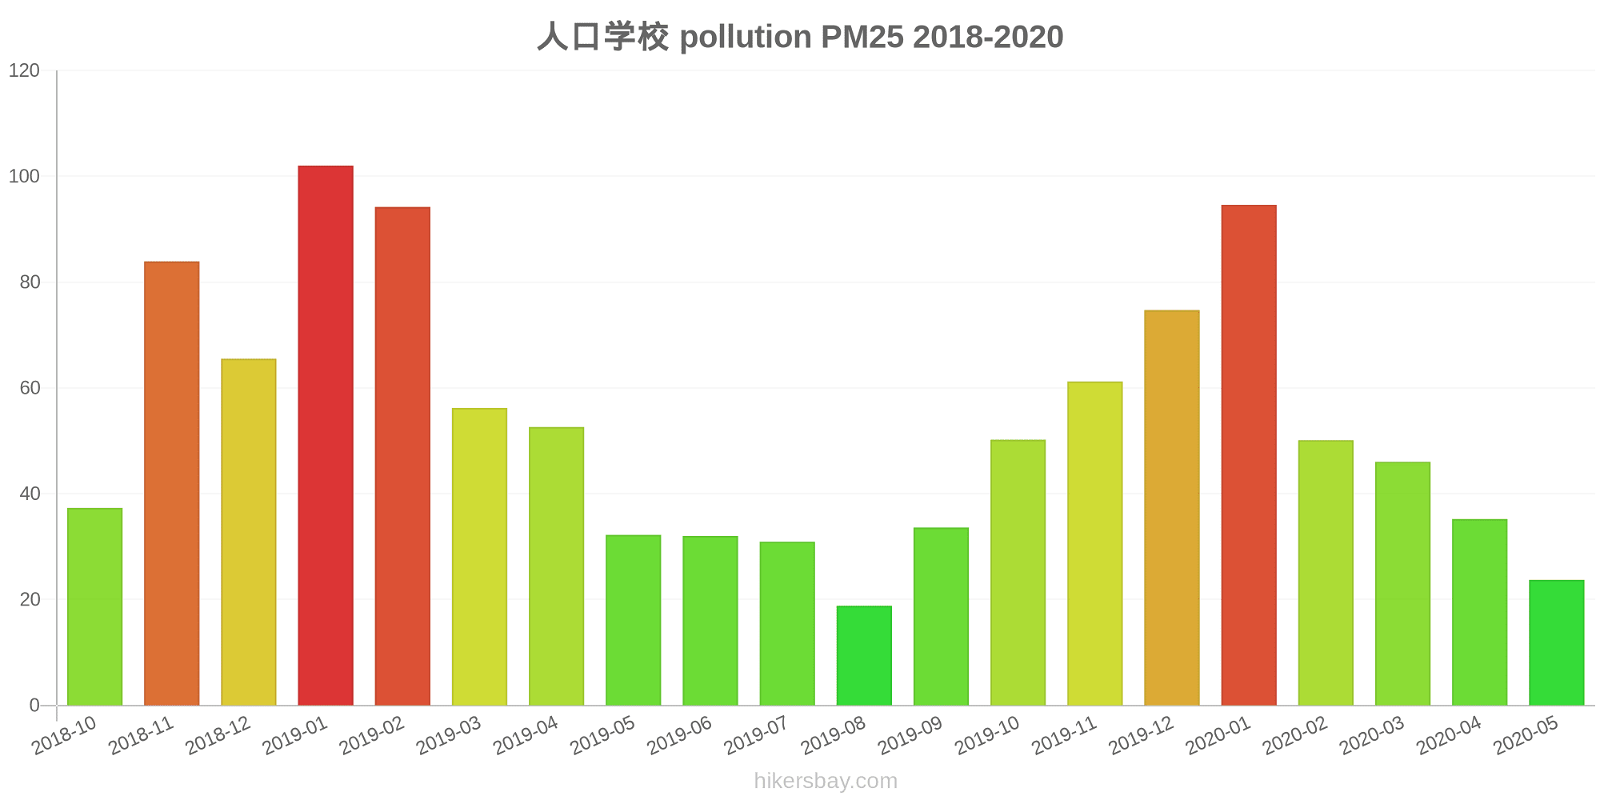
What is the current level of PM2.5 in Laowangfu? (particulate matter (PM2.5) dust)
Today's PM2.5 level is:
7 (Good)
For comparison, the highest level of PM2.5 in Laowangfu in the last 7 days was: 21 (Friday, May 27, 2022) and the lowest: 21 (Friday, May 27, 2022).
The highest PM2.5 values were recorded: 102 (January 2019).
The lowest level of particulate matter PM2.5 pollution occurs in month: August (19).
What is the level of SO2 pollution? (sulfur dioxide (SO2))
18 (Good)
How high is the level of NO2? (nitrogen dioxide (NO2))
3 (Good)
How high is the CO level? (carbon monoxide (CO))
1 (Good)
Current data Friday, May 27, 2022, 12:00 PM
PM10 53 (Unhealthy for Sensitive Groups)
O3 0 (Good)
PM2,5 7 (Good)
SO2 18 (Good)
NO2 3 (Good)
CO 1 (Good)
Data on air pollution from recent days in Laowangfu
index
2022-05-27
pm10
51
Unhealthy for Sensitive Groups
o3
0
Good
pm25
21
Moderate
so2
10
Good
no2
0
Good
co
1
Good
data source »
Air pollution in Laowangfu from October 2018 to May 2020

index
2020-05
2020-04
2020-03
2020-02
2020-01
2019-12
2019-11
2019-10
2019-09
2019-08
2019-07
2019-06
2019-05
2019-04
2019-03
2019-02
2019-01
2018-12
2018-11
2018-10
pm25
24 (Moderate)
35 (Unhealthy for Sensitive Groups)
46 (Unhealthy for Sensitive Groups)
50 (Unhealthy for Sensitive Groups)
95 (Very Unhealthy)
75 (Unhealthy)
61 (Unhealthy)
50 (Unhealthy for Sensitive Groups)
34 (Moderate)
19 (Moderate)
31 (Moderate)
32 (Moderate)
32 (Moderate)
53 (Unhealthy for Sensitive Groups)
56 (Unhealthy)
94 (Very Unhealthy)
102 (Very Unhealthy)
66 (Unhealthy)
84 (Very Unhealthy)
37 (Unhealthy for Sensitive Groups)
co
648 (Good)
564 (Good)
522 (Good)
854 (Good)
1 (Good)
931 (Good)
633 (Good)
619 (Good)
560 (Good)
478 (Good)
608 (Good)
348 (Good)
415 (Good)
662 (Good)
621 (Good)
1 (Good)
1 (Good)
1 (Good)
935 (Good)
852 (Good)
no2
22 (Good)
20 (Good)
21 (Good)
19 (Good)
45 (Moderate)
43 (Moderate)
38 (Good)
31 (Good)
25 (Good)
19 (Good)
24 (Good)
22 (Good)
21 (Good)
28 (Good)
32 (Good)
35 (Good)
51 (Moderate)
46 (Moderate)
44 (Moderate)
35 (Good)
o3
155 (Unhealthy)
143 (Unhealthy for Sensitive Groups)
114 (Moderate)
101 (Moderate)
77 (Moderate)
59 (Good)
85 (Moderate)
122 (Unhealthy for Sensitive Groups)
164 (Unhealthy)
136 (Unhealthy for Sensitive Groups)
189 (Very Unhealthy)
212 (Very Unhealthy)
168 (Unhealthy)
139 (Unhealthy for Sensitive Groups)
123 (Unhealthy for Sensitive Groups)
93 (Moderate)
59 (Good)
48 (Good)
76 (Moderate)
94 (Moderate)
pm10
67 (Unhealthy for Sensitive Groups)
80 (Unhealthy for Sensitive Groups)
88 (Unhealthy)
68 (Unhealthy for Sensitive Groups)
123 (Very Unhealthy)
108 (Unhealthy)
123 (Very Unhealthy)
100 (Unhealthy)
71 (Unhealthy for Sensitive Groups)
43 (Moderate)
63 (Unhealthy for Sensitive Groups)
80 (Unhealthy for Sensitive Groups)
84 (Unhealthy)
102 (Unhealthy)
106 (Unhealthy)
131 (Very Unhealthy)
163 (Very bad Hazardous)
129 (Very Unhealthy)
148 (Very Unhealthy)
91 (Unhealthy)
so2
10 (Good)
11 (Good)
11 (Good)
9.4 (Good)
15 (Good)
12 (Good)
12 (Good)
11 (Good)
9.5 (Good)
9.3 (Good)
13 (Good)
15 (Good)
14 (Good)
15 (Good)
15 (Good)
14 (Good)
19 (Good)
18 (Good)
13 (Good)
17 (Good)
data source »
人口学校
Friday, May 27, 2022, 12:00 PM
PM10 53 (Unhealthy for Sensitive Groups)
particulate matter (PM10) suspended dust
O3 0.02 (Good)
ozone (O3)
PM2,5 6.6 (Good)
particulate matter (PM2.5) dust
SO2 18 (Good)
sulfur dioxide (SO2)
NO2 3 (Good)
nitrogen dioxide (NO2)
CO 1.3 (Good)
carbon monoxide (CO)
人口学校
index
2022-05-27
pm10
51
o3
0.02
pm25
21
so2
9.6
no2
0.38
co
0.64
人口学校
2018-10 2020-05
index
2020-05
2020-04
2020-03
2020-02
2020-01
2019-12
2019-11
2019-10
2019-09
2019-08
2019-07
2019-06
2019-05
2019-04
2019-03
2019-02
2019-01
2018-12
2018-11
2018-10
pm25
24
35
46
50
95
75
61
50
34
19
31
32
32
53
56
94
102
66
84
37
co
648
564
522
854
1
931
633
619
560
478
608
348
415
662
621
1
1
1
935
852
no2
22
20
21
19
45
43
38
31
25
19
24
22
21
28
32
35
51
46
44
35
o3
155
143
114
101
77
59
85
122
164
136
189
212
168
139
123
93
59
48
76
94
pm10
67
80
88
68
123
108
123
100
71
43
63
80
84
102
106
131
163
129
148
91
so2
10
11
11
9.4
15
12
12
11
9.5
9.3
13
15
14
15
15
14
19
18
13
17
* Pollution data source:
https://openaq.org
(ChinaAQIData)
The data is licensed under CC-By 4.0
PM10 53 (Unhealthy for Sensitive Groups)
O3 0 (Good)
PM2,5 7 (Good)
SO2 18 (Good)
NO2 3 (Good)
CO 1 (Good)
Data on air pollution from recent days in Laowangfu
| index | 2022-05-27 |
|---|---|
| pm10 | 51 Unhealthy for Sensitive Groups |
| o3 | 0 Good |
| pm25 | 21 Moderate |
| so2 | 10 Good |
| no2 | 0 Good |
| co | 1 Good |

| index | 2020-05 | 2020-04 | 2020-03 | 2020-02 | 2020-01 | 2019-12 | 2019-11 | 2019-10 | 2019-09 | 2019-08 | 2019-07 | 2019-06 | 2019-05 | 2019-04 | 2019-03 | 2019-02 | 2019-01 | 2018-12 | 2018-11 | 2018-10 |
|---|---|---|---|---|---|---|---|---|---|---|---|---|---|---|---|---|---|---|---|---|
| pm25 | 24 (Moderate) | 35 (Unhealthy for Sensitive Groups) | 46 (Unhealthy for Sensitive Groups) | 50 (Unhealthy for Sensitive Groups) | 95 (Very Unhealthy) | 75 (Unhealthy) | 61 (Unhealthy) | 50 (Unhealthy for Sensitive Groups) | 34 (Moderate) | 19 (Moderate) | 31 (Moderate) | 32 (Moderate) | 32 (Moderate) | 53 (Unhealthy for Sensitive Groups) | 56 (Unhealthy) | 94 (Very Unhealthy) | 102 (Very Unhealthy) | 66 (Unhealthy) | 84 (Very Unhealthy) | 37 (Unhealthy for Sensitive Groups) |
| co | 648 (Good) | 564 (Good) | 522 (Good) | 854 (Good) | 1 (Good) | 931 (Good) | 633 (Good) | 619 (Good) | 560 (Good) | 478 (Good) | 608 (Good) | 348 (Good) | 415 (Good) | 662 (Good) | 621 (Good) | 1 (Good) | 1 (Good) | 1 (Good) | 935 (Good) | 852 (Good) |
| no2 | 22 (Good) | 20 (Good) | 21 (Good) | 19 (Good) | 45 (Moderate) | 43 (Moderate) | 38 (Good) | 31 (Good) | 25 (Good) | 19 (Good) | 24 (Good) | 22 (Good) | 21 (Good) | 28 (Good) | 32 (Good) | 35 (Good) | 51 (Moderate) | 46 (Moderate) | 44 (Moderate) | 35 (Good) |
| o3 | 155 (Unhealthy) | 143 (Unhealthy for Sensitive Groups) | 114 (Moderate) | 101 (Moderate) | 77 (Moderate) | 59 (Good) | 85 (Moderate) | 122 (Unhealthy for Sensitive Groups) | 164 (Unhealthy) | 136 (Unhealthy for Sensitive Groups) | 189 (Very Unhealthy) | 212 (Very Unhealthy) | 168 (Unhealthy) | 139 (Unhealthy for Sensitive Groups) | 123 (Unhealthy for Sensitive Groups) | 93 (Moderate) | 59 (Good) | 48 (Good) | 76 (Moderate) | 94 (Moderate) |
| pm10 | 67 (Unhealthy for Sensitive Groups) | 80 (Unhealthy for Sensitive Groups) | 88 (Unhealthy) | 68 (Unhealthy for Sensitive Groups) | 123 (Very Unhealthy) | 108 (Unhealthy) | 123 (Very Unhealthy) | 100 (Unhealthy) | 71 (Unhealthy for Sensitive Groups) | 43 (Moderate) | 63 (Unhealthy for Sensitive Groups) | 80 (Unhealthy for Sensitive Groups) | 84 (Unhealthy) | 102 (Unhealthy) | 106 (Unhealthy) | 131 (Very Unhealthy) | 163 (Very bad Hazardous) | 129 (Very Unhealthy) | 148 (Very Unhealthy) | 91 (Unhealthy) |
| so2 | 10 (Good) | 11 (Good) | 11 (Good) | 9.4 (Good) | 15 (Good) | 12 (Good) | 12 (Good) | 11 (Good) | 9.5 (Good) | 9.3 (Good) | 13 (Good) | 15 (Good) | 14 (Good) | 15 (Good) | 15 (Good) | 14 (Good) | 19 (Good) | 18 (Good) | 13 (Good) | 17 (Good) |
PM10 53 (Unhealthy for Sensitive Groups)
particulate matter (PM10) suspended dustO3 0.02 (Good)
ozone (O3)PM2,5 6.6 (Good)
particulate matter (PM2.5) dustSO2 18 (Good)
sulfur dioxide (SO2)NO2 3 (Good)
nitrogen dioxide (NO2)CO 1.3 (Good)
carbon monoxide (CO)人口学校
| index | 2022-05-27 |
|---|---|
| pm10 | 51 |
| o3 | 0.02 |
| pm25 | 21 |
| so2 | 9.6 |
| no2 | 0.38 |
| co | 0.64 |
人口学校

| index | 2020-05 | 2020-04 | 2020-03 | 2020-02 | 2020-01 | 2019-12 | 2019-11 | 2019-10 | 2019-09 | 2019-08 | 2019-07 | 2019-06 | 2019-05 | 2019-04 | 2019-03 | 2019-02 | 2019-01 | 2018-12 | 2018-11 | 2018-10 |
|---|---|---|---|---|---|---|---|---|---|---|---|---|---|---|---|---|---|---|---|---|
| pm25 | 24 | 35 | 46 | 50 | 95 | 75 | 61 | 50 | 34 | 19 | 31 | 32 | 32 | 53 | 56 | 94 | 102 | 66 | 84 | 37 |
| co | 648 | 564 | 522 | 854 | 1 | 931 | 633 | 619 | 560 | 478 | 608 | 348 | 415 | 662 | 621 | 1 | 1 | 1 | 935 | 852 |
| no2 | 22 | 20 | 21 | 19 | 45 | 43 | 38 | 31 | 25 | 19 | 24 | 22 | 21 | 28 | 32 | 35 | 51 | 46 | 44 | 35 |
| o3 | 155 | 143 | 114 | 101 | 77 | 59 | 85 | 122 | 164 | 136 | 189 | 212 | 168 | 139 | 123 | 93 | 59 | 48 | 76 | 94 |
| pm10 | 67 | 80 | 88 | 68 | 123 | 108 | 123 | 100 | 71 | 43 | 63 | 80 | 84 | 102 | 106 | 131 | 163 | 129 | 148 | 91 |
| so2 | 10 | 11 | 11 | 9.4 | 15 | 12 | 12 | 11 | 9.5 | 9.3 | 13 | 15 | 14 | 15 | 15 | 14 | 19 | 18 | 13 | 17 |