Air Pollution in Shuanglong: Real-time Air Quality Index and smog alert.
Pollution and air quality forecast for Shuanglong. Today is Tuesday, June 16, 2026. The following air pollution values have been recorded for Shuanglong:- particulate matter (PM10) suspended dust - 53 (Unhealthy for Sensitive Groups)
- ozone (O3) - 0 (Good)
- particulate matter (PM2.5) dust - 7 (Good)
- sulfur dioxide (SO2) - 18 (Good)
- nitrogen dioxide (NO2) - 3 (Good)
- carbon monoxide (CO) - 1 (Good)

What is the air quality in Shuanglong today? Is the air polluted in Shuanglong?. Is there smog?
What is the level of PM10 today in Shuanglong? (particulate matter (PM10) suspended dust)
The current level of particulate matter PM10 in Shuanglong is:
53 (Unhealthy for Sensitive Groups)
The highest PM10 values usually occur in month: 147 (January 2019).
The lowest value of particulate matter PM10 pollution in Shuanglong is usually recorded in: August (47).
How is the O3 level today in Shuanglong? (ozone (O3))
0 (Good)
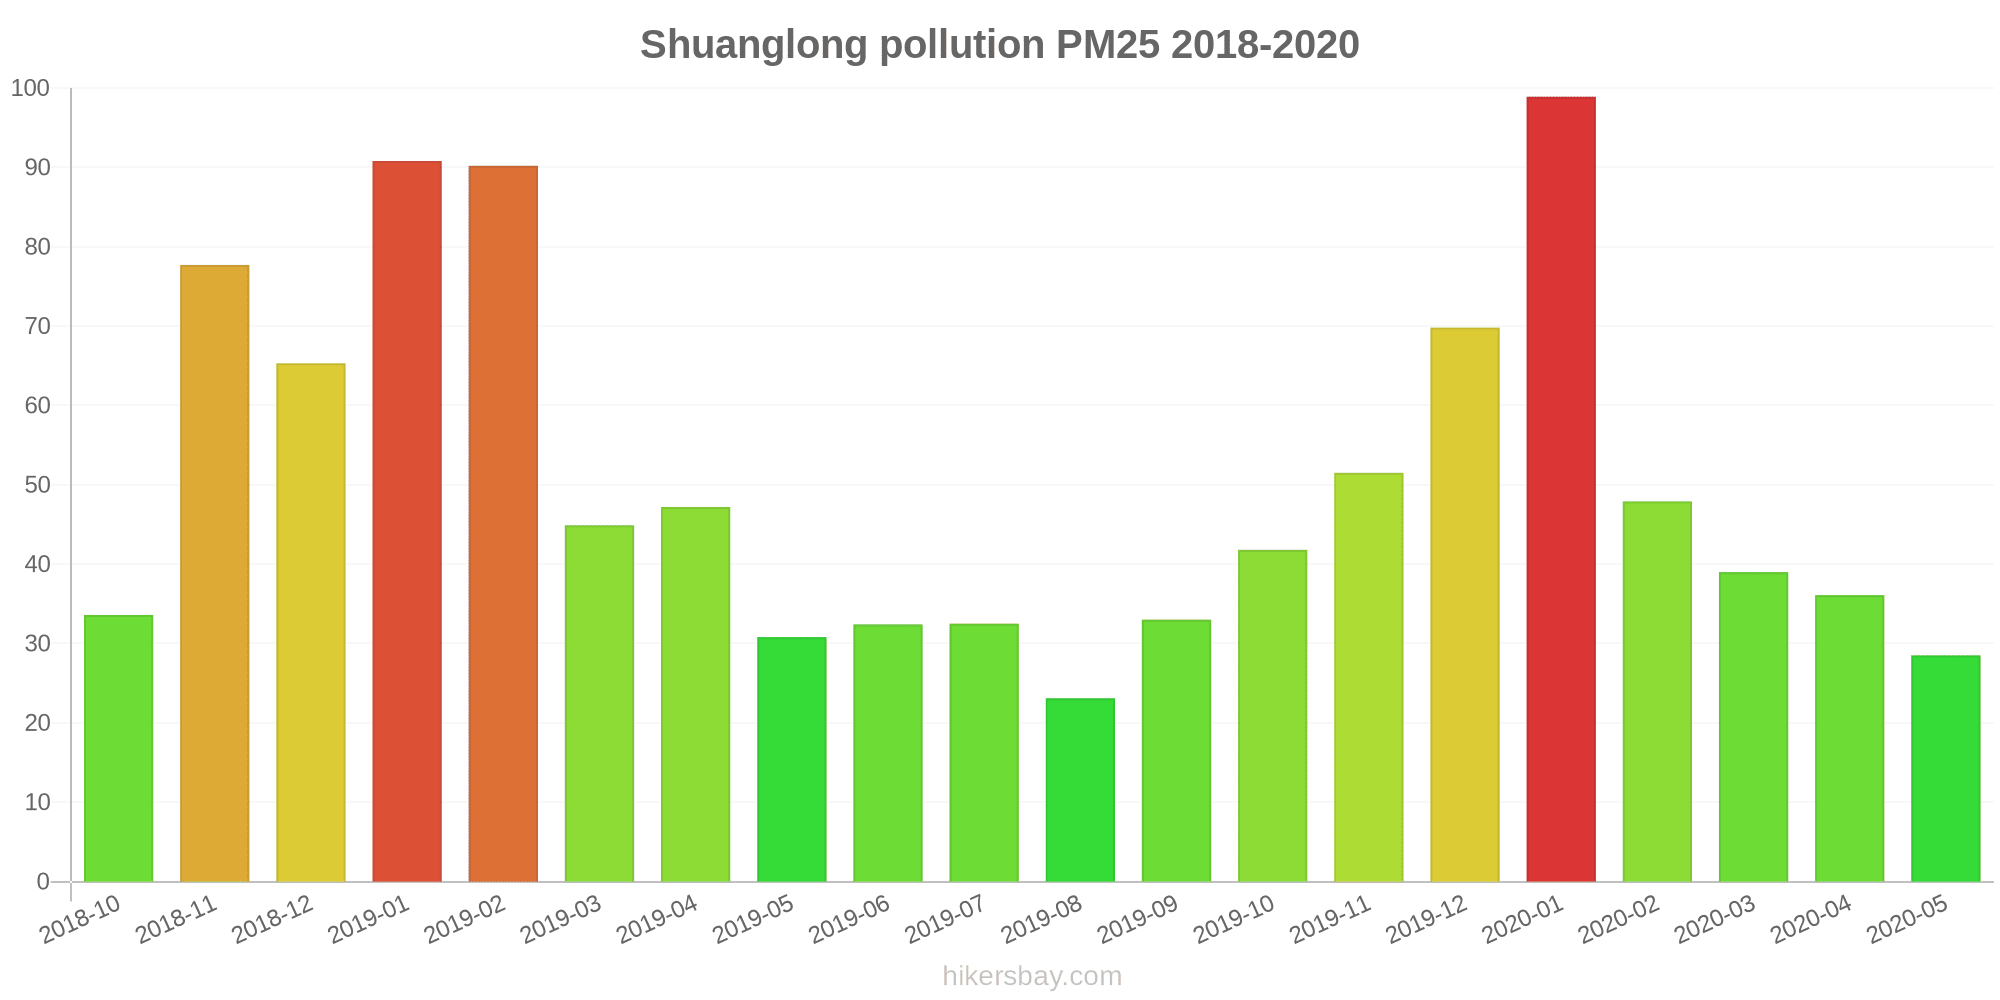
What is the current level of PM2.5 in Shuanglong? (particulate matter (PM2.5) dust)
Today's PM2.5 level is:
7 (Good)
For comparison, the highest level of PM2.5 in Shuanglong in the last 7 days was: 21 (Friday, May 27, 2022) and the lowest: 21 (Friday, May 27, 2022).
The highest PM2.5 values were recorded: 99 (January 2020).
The lowest level of particulate matter PM2.5 pollution occurs in month: August (23).
What is the level of SO2 pollution? (sulfur dioxide (SO2))
18 (Good)
How high is the level of NO2? (nitrogen dioxide (NO2))
3 (Good)
How high is the CO level? (carbon monoxide (CO))
1 (Good)
Current data Friday, May 27, 2022, 12:00 PM
PM10 53 (Unhealthy for Sensitive Groups)
O3 0 (Good)
PM2,5 7 (Good)
SO2 18 (Good)
NO2 3 (Good)
CO 1 (Good)
Data on air pollution from recent days in Shuanglong
index
2022-05-27
pm10
51
Unhealthy for Sensitive Groups
o3
0
Good
pm25
21
Moderate
so2
10
Good
no2
0
Good
co
1
Good
data source »
Air pollution in Shuanglong from October 2018 to May 2020

index
2020-05
2020-04
2020-03
2020-02
2020-01
2019-12
2019-11
2019-10
2019-09
2019-08
2019-07
2019-06
2019-05
2019-04
2019-03
2019-02
2019-01
2018-12
2018-11
2018-10
pm25
29 (Moderate)
36 (Unhealthy for Sensitive Groups)
39 (Unhealthy for Sensitive Groups)
48 (Unhealthy for Sensitive Groups)
99 (Very Unhealthy)
70 (Unhealthy)
52 (Unhealthy for Sensitive Groups)
42 (Unhealthy for Sensitive Groups)
33 (Moderate)
23 (Moderate)
33 (Moderate)
32 (Moderate)
31 (Moderate)
47 (Unhealthy for Sensitive Groups)
45 (Unhealthy for Sensitive Groups)
90 (Very Unhealthy)
91 (Very Unhealthy)
65 (Unhealthy)
78 (Very Unhealthy)
34 (Moderate)
co
861 (Good)
825 (Good)
745 (Good)
760 (Good)
1 (Good)
1 (Good)
922 (Good)
796 (Good)
795 (Good)
703 (Good)
618 (Good)
595 (Good)
493 (Good)
717 (Good)
554 (Good)
1 (Good)
1 (Good)
1 (Good)
1 (Good)
579 (Good)
no2
21 (Good)
31 (Good)
25 (Good)
21 (Good)
49 (Moderate)
48 (Moderate)
49 (Moderate)
38 (Good)
34 (Good)
28 (Good)
20 (Good)
26 (Good)
34 (Good)
47 (Moderate)
46 (Moderate)
45 (Moderate)
47 (Moderate)
49 (Moderate)
43 (Moderate)
36 (Good)
o3
172 (Unhealthy)
143 (Unhealthy for Sensitive Groups)
121 (Unhealthy for Sensitive Groups)
99 (Moderate)
76 (Moderate)
63 (Good)
83 (Moderate)
125 (Unhealthy for Sensitive Groups)
171 (Unhealthy)
152 (Unhealthy)
213 (Very Unhealthy)
227 (Very Unhealthy)
179 (Unhealthy)
137 (Unhealthy for Sensitive Groups)
122 (Unhealthy for Sensitive Groups)
94 (Moderate)
63 (Good)
51 (Good)
86 (Moderate)
109 (Moderate)
pm10
68 (Unhealthy for Sensitive Groups)
78 (Unhealthy for Sensitive Groups)
84 (Unhealthy)
67 (Unhealthy for Sensitive Groups)
129 (Very Unhealthy)
108 (Unhealthy)
119 (Very Unhealthy)
107 (Unhealthy)
72 (Unhealthy for Sensitive Groups)
47 (Moderate)
62 (Unhealthy for Sensitive Groups)
77 (Unhealthy for Sensitive Groups)
90 (Unhealthy)
112 (Very Unhealthy)
112 (Very Unhealthy)
137 (Very Unhealthy)
147 (Very Unhealthy)
124 (Very Unhealthy)
145 (Very Unhealthy)
91 (Unhealthy)
so2
9.4 (Good)
9.9 (Good)
10 (Good)
10 (Good)
22 (Good)
16 (Good)
11 (Good)
9.3 (Good)
9 (Good)
6.8 (Good)
7 (Good)
13 (Good)
12 (Good)
13 (Good)
12 (Good)
16 (Good)
22 (Good)
18 (Good)
11 (Good)
10 (Good)
data source »
科干所
Friday, May 27, 2022, 12:00 PM
PM10 53 (Unhealthy for Sensitive Groups)
particulate matter (PM10) suspended dust
O3 0.02 (Good)
ozone (O3)
PM2,5 6.6 (Good)
particulate matter (PM2.5) dust
SO2 18 (Good)
sulfur dioxide (SO2)
NO2 3 (Good)
nitrogen dioxide (NO2)
CO 1.3 (Good)
carbon monoxide (CO)
科干所
index
2022-05-27
pm10
51
o3
0.02
pm25
21
so2
9.6
no2
0.38
co
0.64
科干所
2018-10 2020-05

index
2020-05
2020-04
2020-03
2020-02
2020-01
2019-12
2019-11
2019-10
2019-09
2019-08
2019-07
2019-06
2019-05
2019-04
2019-03
2019-02
2019-01
2018-12
2018-11
2018-10
pm25
29
36
39
48
99
70
52
42
33
23
33
32
31
47
45
90
91
65
78
34
co
861
825
745
760
1
1
922
796
795
703
618
595
493
717
554
1
1
1
1
579
no2
21
31
25
21
49
48
49
38
34
28
20
26
34
47
46
45
47
49
43
36
o3
172
143
121
99
76
63
83
125
171
152
213
227
179
137
122
94
63
51
86
109
pm10
68
78
84
67
129
108
119
107
72
47
62
77
90
112
112
137
147
124
145
91
so2
9.4
9.9
10
10
22
16
11
9.3
9
6.8
7
13
12
13
12
16
22
18
11
10
* Pollution data source:
https://openaq.org
(ChinaAQIData)
The data is licensed under CC-By 4.0
PM10 53 (Unhealthy for Sensitive Groups)
O3 0 (Good)
PM2,5 7 (Good)
SO2 18 (Good)
NO2 3 (Good)
CO 1 (Good)
Data on air pollution from recent days in Shuanglong
| index | 2022-05-27 |
|---|---|
| pm10 | 51 Unhealthy for Sensitive Groups |
| o3 | 0 Good |
| pm25 | 21 Moderate |
| so2 | 10 Good |
| no2 | 0 Good |
| co | 1 Good |
| index | 2020-05 | 2020-04 | 2020-03 | 2020-02 | 2020-01 | 2019-12 | 2019-11 | 2019-10 | 2019-09 | 2019-08 | 2019-07 | 2019-06 | 2019-05 | 2019-04 | 2019-03 | 2019-02 | 2019-01 | 2018-12 | 2018-11 | 2018-10 |
|---|---|---|---|---|---|---|---|---|---|---|---|---|---|---|---|---|---|---|---|---|
| pm25 | 29 (Moderate) | 36 (Unhealthy for Sensitive Groups) | 39 (Unhealthy for Sensitive Groups) | 48 (Unhealthy for Sensitive Groups) | 99 (Very Unhealthy) | 70 (Unhealthy) | 52 (Unhealthy for Sensitive Groups) | 42 (Unhealthy for Sensitive Groups) | 33 (Moderate) | 23 (Moderate) | 33 (Moderate) | 32 (Moderate) | 31 (Moderate) | 47 (Unhealthy for Sensitive Groups) | 45 (Unhealthy for Sensitive Groups) | 90 (Very Unhealthy) | 91 (Very Unhealthy) | 65 (Unhealthy) | 78 (Very Unhealthy) | 34 (Moderate) |
| co | 861 (Good) | 825 (Good) | 745 (Good) | 760 (Good) | 1 (Good) | 1 (Good) | 922 (Good) | 796 (Good) | 795 (Good) | 703 (Good) | 618 (Good) | 595 (Good) | 493 (Good) | 717 (Good) | 554 (Good) | 1 (Good) | 1 (Good) | 1 (Good) | 1 (Good) | 579 (Good) |
| no2 | 21 (Good) | 31 (Good) | 25 (Good) | 21 (Good) | 49 (Moderate) | 48 (Moderate) | 49 (Moderate) | 38 (Good) | 34 (Good) | 28 (Good) | 20 (Good) | 26 (Good) | 34 (Good) | 47 (Moderate) | 46 (Moderate) | 45 (Moderate) | 47 (Moderate) | 49 (Moderate) | 43 (Moderate) | 36 (Good) |
| o3 | 172 (Unhealthy) | 143 (Unhealthy for Sensitive Groups) | 121 (Unhealthy for Sensitive Groups) | 99 (Moderate) | 76 (Moderate) | 63 (Good) | 83 (Moderate) | 125 (Unhealthy for Sensitive Groups) | 171 (Unhealthy) | 152 (Unhealthy) | 213 (Very Unhealthy) | 227 (Very Unhealthy) | 179 (Unhealthy) | 137 (Unhealthy for Sensitive Groups) | 122 (Unhealthy for Sensitive Groups) | 94 (Moderate) | 63 (Good) | 51 (Good) | 86 (Moderate) | 109 (Moderate) |
| pm10 | 68 (Unhealthy for Sensitive Groups) | 78 (Unhealthy for Sensitive Groups) | 84 (Unhealthy) | 67 (Unhealthy for Sensitive Groups) | 129 (Very Unhealthy) | 108 (Unhealthy) | 119 (Very Unhealthy) | 107 (Unhealthy) | 72 (Unhealthy for Sensitive Groups) | 47 (Moderate) | 62 (Unhealthy for Sensitive Groups) | 77 (Unhealthy for Sensitive Groups) | 90 (Unhealthy) | 112 (Very Unhealthy) | 112 (Very Unhealthy) | 137 (Very Unhealthy) | 147 (Very Unhealthy) | 124 (Very Unhealthy) | 145 (Very Unhealthy) | 91 (Unhealthy) |
| so2 | 9.4 (Good) | 9.9 (Good) | 10 (Good) | 10 (Good) | 22 (Good) | 16 (Good) | 11 (Good) | 9.3 (Good) | 9 (Good) | 6.8 (Good) | 7 (Good) | 13 (Good) | 12 (Good) | 13 (Good) | 12 (Good) | 16 (Good) | 22 (Good) | 18 (Good) | 11 (Good) | 10 (Good) |
PM10 53 (Unhealthy for Sensitive Groups)
particulate matter (PM10) suspended dustO3 0.02 (Good)
ozone (O3)PM2,5 6.6 (Good)
particulate matter (PM2.5) dustSO2 18 (Good)
sulfur dioxide (SO2)NO2 3 (Good)
nitrogen dioxide (NO2)CO 1.3 (Good)
carbon monoxide (CO)科干所
| index | 2022-05-27 |
|---|---|
| pm10 | 51 |
| o3 | 0.02 |
| pm25 | 21 |
| so2 | 9.6 |
| no2 | 0.38 |
| co | 0.64 |
科干所

| index | 2020-05 | 2020-04 | 2020-03 | 2020-02 | 2020-01 | 2019-12 | 2019-11 | 2019-10 | 2019-09 | 2019-08 | 2019-07 | 2019-06 | 2019-05 | 2019-04 | 2019-03 | 2019-02 | 2019-01 | 2018-12 | 2018-11 | 2018-10 |
|---|---|---|---|---|---|---|---|---|---|---|---|---|---|---|---|---|---|---|---|---|
| pm25 | 29 | 36 | 39 | 48 | 99 | 70 | 52 | 42 | 33 | 23 | 33 | 32 | 31 | 47 | 45 | 90 | 91 | 65 | 78 | 34 |
| co | 861 | 825 | 745 | 760 | 1 | 1 | 922 | 796 | 795 | 703 | 618 | 595 | 493 | 717 | 554 | 1 | 1 | 1 | 1 | 579 |
| no2 | 21 | 31 | 25 | 21 | 49 | 48 | 49 | 38 | 34 | 28 | 20 | 26 | 34 | 47 | 46 | 45 | 47 | 49 | 43 | 36 |
| o3 | 172 | 143 | 121 | 99 | 76 | 63 | 83 | 125 | 171 | 152 | 213 | 227 | 179 | 137 | 122 | 94 | 63 | 51 | 86 | 109 |
| pm10 | 68 | 78 | 84 | 67 | 129 | 108 | 119 | 107 | 72 | 47 | 62 | 77 | 90 | 112 | 112 | 137 | 147 | 124 | 145 | 91 |
| so2 | 9.4 | 9.9 | 10 | 10 | 22 | 16 | 11 | 9.3 | 9 | 6.8 | 7 | 13 | 12 | 13 | 12 | 16 | 22 | 18 | 11 | 10 |