Air Pollution in Tucheng: Real-time Air Quality Index and smog alert.
Pollution and air quality forecast for Tucheng. Today is Tuesday, June 16, 2026. The following air pollution values have been recorded for Tucheng:- particulate matter (PM10) suspended dust - 53 (Unhealthy for Sensitive Groups)
- ozone (O3) - 0 (Good)
- particulate matter (PM2.5) dust - 7 (Good)
- sulfur dioxide (SO2) - 18 (Good)
- nitrogen dioxide (NO2) - 3 (Good)
- carbon monoxide (CO) - 1 (Good)

What is the air quality in Tucheng today? Is the air polluted in Tucheng?. Is there smog?
What is the level of PM10 today in Tucheng? (particulate matter (PM10) suspended dust)
The current level of particulate matter PM10 in Tucheng is:
53 (Unhealthy for Sensitive Groups)
The highest PM10 values usually occur in month: 173 (January 2019).
The lowest value of particulate matter PM10 pollution in Tucheng is usually recorded in: August (48).
How is the O3 level today in Tucheng? (ozone (O3))
0 (Good)
What is the current level of PM2.5 in Tucheng? (particulate matter (PM2.5) dust)
Today's PM2.5 level is:
7 (Good)
For comparison, the highest level of PM2.5 in Tucheng in the last 7 days was: 21 (Friday, May 27, 2022) and the lowest: 21 (Friday, May 27, 2022).
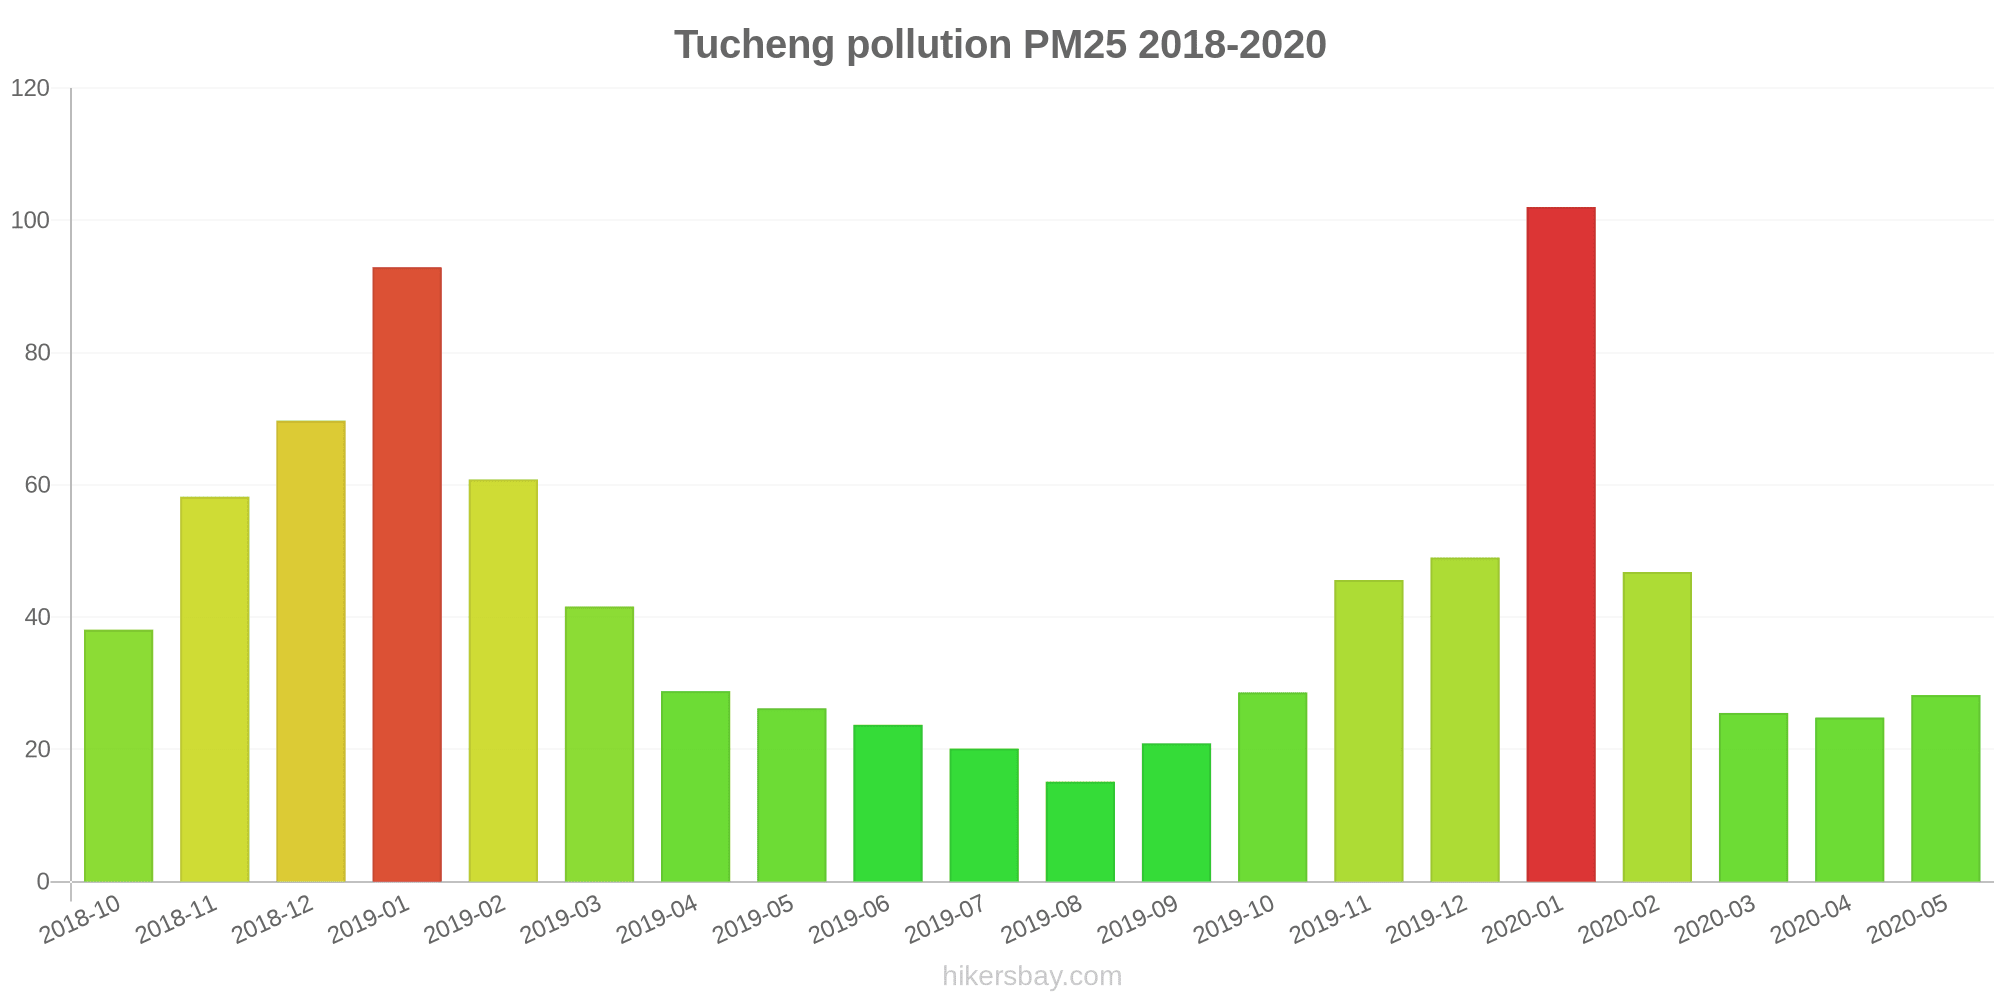
The highest PM2.5 values were recorded: 102 (January 2020).
The lowest level of particulate matter PM2.5 pollution occurs in month: August (15).
What is the level of SO2 pollution? (sulfur dioxide (SO2))
18 (Good)
How high is the level of NO2? (nitrogen dioxide (NO2))
3 (Good)
How high is the CO level? (carbon monoxide (CO))
1 (Good)
Current data Friday, May 27, 2022, 12:00 PM
PM10 53 (Unhealthy for Sensitive Groups)
O3 0 (Good)
PM2,5 7 (Good)
SO2 18 (Good)
NO2 3 (Good)
CO 1 (Good)
Data on air pollution from recent days in Tucheng
index
2022-05-27
pm10
51
Unhealthy for Sensitive Groups
o3
0
Good
pm25
21
Moderate
so2
10
Good
no2
0
Good
co
1
Good
data source »
Air pollution in Tucheng from October 2018 to May 2020

index
2020-05
2020-04
2020-03
2020-02
2020-01
2019-12
2019-11
2019-10
2019-09
2019-08
2019-07
2019-06
2019-05
2019-04
2019-03
2019-02
2019-01
2018-12
2018-11
2018-10
pm25
28 (Moderate)
25 (Moderate)
26 (Moderate)
47 (Unhealthy for Sensitive Groups)
102 (Very Unhealthy)
49 (Unhealthy for Sensitive Groups)
46 (Unhealthy for Sensitive Groups)
29 (Moderate)
21 (Moderate)
15 (Moderate)
20 (Moderate)
24 (Moderate)
26 (Moderate)
29 (Moderate)
42 (Unhealthy for Sensitive Groups)
61 (Unhealthy)
93 (Very Unhealthy)
70 (Unhealthy)
58 (Unhealthy)
38 (Unhealthy for Sensitive Groups)
co
627 (Good)
626 (Good)
623 (Good)
854 (Good)
1 (Good)
1 (Good)
972 (Good)
842 (Good)
841 (Good)
846 (Good)
936 (Good)
732 (Good)
556 (Good)
724 (Good)
871 (Good)
977 (Good)
1 (Good)
1 (Good)
1 (Good)
825 (Good)
no2
20 (Good)
27 (Good)
23 (Good)
26 (Good)
51 (Moderate)
39 (Good)
40 (Good)
32 (Good)
29 (Good)
25 (Good)
25 (Good)
23 (Good)
22 (Good)
28 (Good)
33 (Good)
34 (Good)
46 (Moderate)
36 (Good)
43 (Moderate)
36 (Good)
o3
141 (Unhealthy for Sensitive Groups)
124 (Unhealthy for Sensitive Groups)
100 (Moderate)
92 (Moderate)
65 (Good)
66 (Good)
73 (Moderate)
96 (Moderate)
136 (Unhealthy for Sensitive Groups)
137 (Unhealthy for Sensitive Groups)
159 (Unhealthy)
173 (Unhealthy)
146 (Unhealthy for Sensitive Groups)
125 (Unhealthy for Sensitive Groups)
109 (Moderate)
101 (Moderate)
59 (Good)
53 (Good)
83 (Moderate)
92 (Moderate)
pm10
131 (Very Unhealthy)
81 (Unhealthy)
75 (Unhealthy for Sensitive Groups)
94 (Unhealthy)
159 (Very bad Hazardous)
99 (Unhealthy)
116 (Very Unhealthy)
82 (Unhealthy)
62 (Unhealthy for Sensitive Groups)
48 (Moderate)
56 (Unhealthy for Sensitive Groups)
61 (Unhealthy for Sensitive Groups)
87 (Unhealthy)
93 (Unhealthy)
100 (Unhealthy)
121 (Very Unhealthy)
173 (Very bad Hazardous)
148 (Very Unhealthy)
133 (Very Unhealthy)
84 (Unhealthy)
so2
15 (Good)
19 (Good)
19 (Good)
36 (Good)
80 (Moderate)
43 (Good)
32 (Good)
20 (Good)
16 (Good)
13 (Good)
17 (Good)
13 (Good)
13 (Good)
19 (Good)
36 (Good)
51 (Moderate)
99 (Moderate)
68 (Moderate)
49 (Good)
26 (Good)
data source »
区政府
Friday, May 27, 2022, 12:00 PM
PM10 53 (Unhealthy for Sensitive Groups)
particulate matter (PM10) suspended dust
O3 0.02 (Good)
ozone (O3)
PM2,5 6.6 (Good)
particulate matter (PM2.5) dust
SO2 18 (Good)
sulfur dioxide (SO2)
NO2 3 (Good)
nitrogen dioxide (NO2)
CO 1.3 (Good)
carbon monoxide (CO)
区政府
index
2022-05-27
pm10
51
o3
0.02
pm25
21
so2
9.6
no2
0.38
co
0.64
区政府
2018-10 2020-05

index
2020-05
2020-04
2020-03
2020-02
2020-01
2019-12
2019-11
2019-10
2019-09
2019-08
2019-07
2019-06
2019-05
2019-04
2019-03
2019-02
2019-01
2018-12
2018-11
2018-10
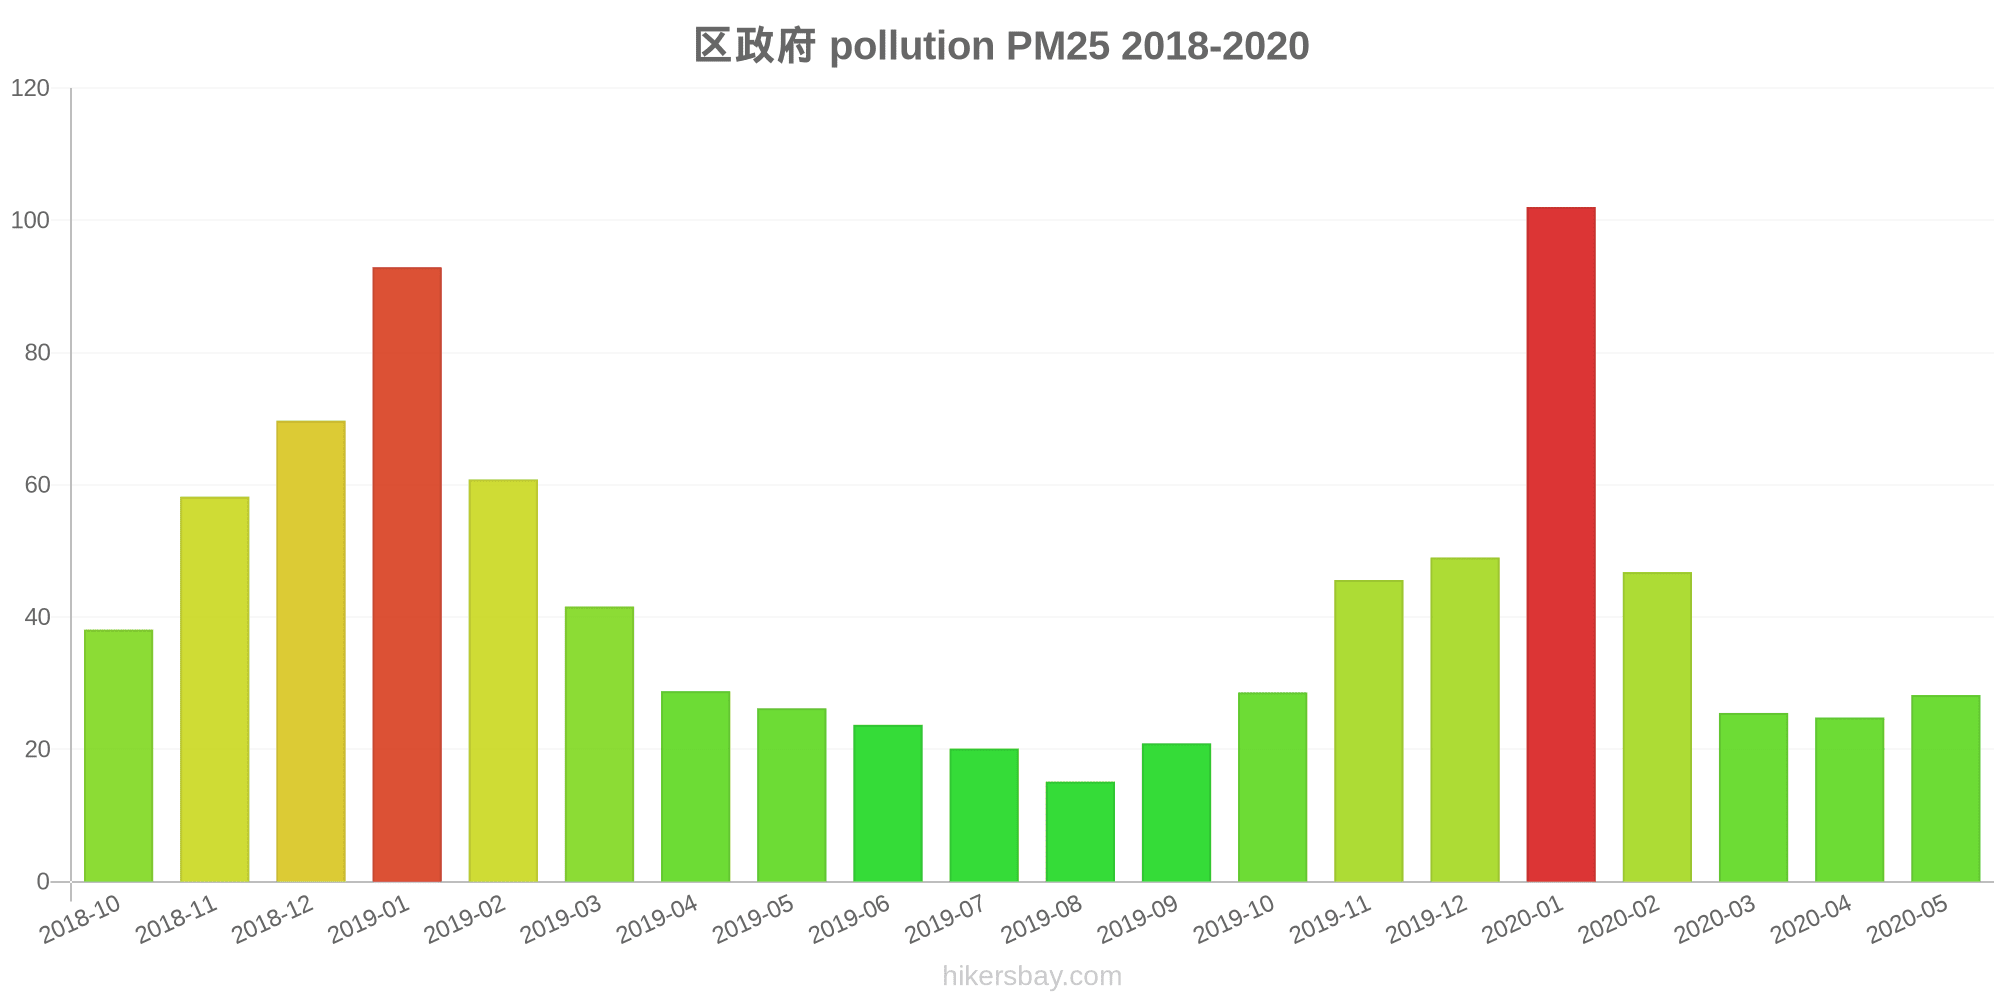
pm25
28
25
26
47
102
49
46
29
21
15
20
24
26
29
42
61
93
70
58
38
co
627
626
623
854
1
1
972
842
841
846
936
732
556
724
871
977
1
1
1
825
no2
20
27
23
26
51
39
40
32
29
25
25
23
22
28
33
34
46
36
43
36
o3
141
124
100
92
65
66
73
96
136
137
159
173
146
125
109
101
59
53
83
92
pm10
131
81
75
94
159
99
116
82
62
48
56
61
87
93
100
121
173
148
133
84
so2
15
19
19
36
80
43
32
20
16
13
17
13
13
19
36
51
99
68
49
26
* Pollution data source:
https://openaq.org
(ChinaAQIData)
The data is licensed under CC-By 4.0
PM10 53 (Unhealthy for Sensitive Groups)
O3 0 (Good)
PM2,5 7 (Good)
SO2 18 (Good)
NO2 3 (Good)
CO 1 (Good)
Data on air pollution from recent days in Tucheng
| index | 2022-05-27 |
|---|---|
| pm10 | 51 Unhealthy for Sensitive Groups |
| o3 | 0 Good |
| pm25 | 21 Moderate |
| so2 | 10 Good |
| no2 | 0 Good |
| co | 1 Good |
| index | 2020-05 | 2020-04 | 2020-03 | 2020-02 | 2020-01 | 2019-12 | 2019-11 | 2019-10 | 2019-09 | 2019-08 | 2019-07 | 2019-06 | 2019-05 | 2019-04 | 2019-03 | 2019-02 | 2019-01 | 2018-12 | 2018-11 | 2018-10 |
|---|---|---|---|---|---|---|---|---|---|---|---|---|---|---|---|---|---|---|---|---|
| pm25 | 28 (Moderate) | 25 (Moderate) | 26 (Moderate) | 47 (Unhealthy for Sensitive Groups) | 102 (Very Unhealthy) | 49 (Unhealthy for Sensitive Groups) | 46 (Unhealthy for Sensitive Groups) | 29 (Moderate) | 21 (Moderate) | 15 (Moderate) | 20 (Moderate) | 24 (Moderate) | 26 (Moderate) | 29 (Moderate) | 42 (Unhealthy for Sensitive Groups) | 61 (Unhealthy) | 93 (Very Unhealthy) | 70 (Unhealthy) | 58 (Unhealthy) | 38 (Unhealthy for Sensitive Groups) |
| co | 627 (Good) | 626 (Good) | 623 (Good) | 854 (Good) | 1 (Good) | 1 (Good) | 972 (Good) | 842 (Good) | 841 (Good) | 846 (Good) | 936 (Good) | 732 (Good) | 556 (Good) | 724 (Good) | 871 (Good) | 977 (Good) | 1 (Good) | 1 (Good) | 1 (Good) | 825 (Good) |
| no2 | 20 (Good) | 27 (Good) | 23 (Good) | 26 (Good) | 51 (Moderate) | 39 (Good) | 40 (Good) | 32 (Good) | 29 (Good) | 25 (Good) | 25 (Good) | 23 (Good) | 22 (Good) | 28 (Good) | 33 (Good) | 34 (Good) | 46 (Moderate) | 36 (Good) | 43 (Moderate) | 36 (Good) |
| o3 | 141 (Unhealthy for Sensitive Groups) | 124 (Unhealthy for Sensitive Groups) | 100 (Moderate) | 92 (Moderate) | 65 (Good) | 66 (Good) | 73 (Moderate) | 96 (Moderate) | 136 (Unhealthy for Sensitive Groups) | 137 (Unhealthy for Sensitive Groups) | 159 (Unhealthy) | 173 (Unhealthy) | 146 (Unhealthy for Sensitive Groups) | 125 (Unhealthy for Sensitive Groups) | 109 (Moderate) | 101 (Moderate) | 59 (Good) | 53 (Good) | 83 (Moderate) | 92 (Moderate) |
| pm10 | 131 (Very Unhealthy) | 81 (Unhealthy) | 75 (Unhealthy for Sensitive Groups) | 94 (Unhealthy) | 159 (Very bad Hazardous) | 99 (Unhealthy) | 116 (Very Unhealthy) | 82 (Unhealthy) | 62 (Unhealthy for Sensitive Groups) | 48 (Moderate) | 56 (Unhealthy for Sensitive Groups) | 61 (Unhealthy for Sensitive Groups) | 87 (Unhealthy) | 93 (Unhealthy) | 100 (Unhealthy) | 121 (Very Unhealthy) | 173 (Very bad Hazardous) | 148 (Very Unhealthy) | 133 (Very Unhealthy) | 84 (Unhealthy) |
| so2 | 15 (Good) | 19 (Good) | 19 (Good) | 36 (Good) | 80 (Moderate) | 43 (Good) | 32 (Good) | 20 (Good) | 16 (Good) | 13 (Good) | 17 (Good) | 13 (Good) | 13 (Good) | 19 (Good) | 36 (Good) | 51 (Moderate) | 99 (Moderate) | 68 (Moderate) | 49 (Good) | 26 (Good) |
PM10 53 (Unhealthy for Sensitive Groups)
particulate matter (PM10) suspended dustO3 0.02 (Good)
ozone (O3)PM2,5 6.6 (Good)
particulate matter (PM2.5) dustSO2 18 (Good)
sulfur dioxide (SO2)NO2 3 (Good)
nitrogen dioxide (NO2)CO 1.3 (Good)
carbon monoxide (CO)区政府
| index | 2022-05-27 |
|---|---|
| pm10 | 51 |
| o3 | 0.02 |
| pm25 | 21 |
| so2 | 9.6 |
| no2 | 0.38 |
| co | 0.64 |
区政府
| index | 2020-05 | 2020-04 | 2020-03 | 2020-02 | 2020-01 | 2019-12 | 2019-11 | 2019-10 | 2019-09 | 2019-08 | 2019-07 | 2019-06 | 2019-05 | 2019-04 | 2019-03 | 2019-02 | 2019-01 | 2018-12 | 2018-11 | 2018-10 |
|---|---|---|---|---|---|---|---|---|---|---|---|---|---|---|---|---|---|---|---|---|
| pm25 | 28 | 25 | 26 | 47 | 102 | 49 | 46 | 29 | 21 | 15 | 20 | 24 | 26 | 29 | 42 | 61 | 93 | 70 | 58 | 38 |
| co | 627 | 626 | 623 | 854 | 1 | 1 | 972 | 842 | 841 | 846 | 936 | 732 | 556 | 724 | 871 | 977 | 1 | 1 | 1 | 825 |
| no2 | 20 | 27 | 23 | 26 | 51 | 39 | 40 | 32 | 29 | 25 | 25 | 23 | 22 | 28 | 33 | 34 | 46 | 36 | 43 | 36 |
| o3 | 141 | 124 | 100 | 92 | 65 | 66 | 73 | 96 | 136 | 137 | 159 | 173 | 146 | 125 | 109 | 101 | 59 | 53 | 83 | 92 |
| pm10 | 131 | 81 | 75 | 94 | 159 | 99 | 116 | 82 | 62 | 48 | 56 | 61 | 87 | 93 | 100 | 121 | 173 | 148 | 133 | 84 |
| so2 | 15 | 19 | 19 | 36 | 80 | 43 | 32 | 20 | 16 | 13 | 17 | 13 | 13 | 19 | 36 | 51 | 99 | 68 | 49 | 26 |