Air Pollution in Kuangshan: Real-time Air Quality Index and smog alert.
Pollution and air quality forecast for Kuangshan. Today is Tuesday, June 16, 2026. The following air pollution values have been recorded for Kuangshan:- particulate matter (PM10) suspended dust - 53 (Unhealthy for Sensitive Groups)
- ozone (O3) - 0 (Good)
- particulate matter (PM2.5) dust - 7 (Good)
- sulfur dioxide (SO2) - 18 (Good)
- nitrogen dioxide (NO2) - 3 (Good)
- carbon monoxide (CO) - 1 (Good)

What is the air quality in Kuangshan today? Is the air polluted in Kuangshan?. Is there smog?
What is the level of PM10 today in Kuangshan? (particulate matter (PM10) suspended dust)
The current level of particulate matter PM10 in Kuangshan is:
53 (Unhealthy for Sensitive Groups)
The highest PM10 values usually occur in month: 221 (January 2019).
The lowest value of particulate matter PM10 pollution in Kuangshan is usually recorded in: July (52).
How is the O3 level today in Kuangshan? (ozone (O3))
0 (Good)
What is the current level of PM2.5 in Kuangshan? (particulate matter (PM2.5) dust)
Today's PM2.5 level is:
7 (Good)
For comparison, the highest level of PM2.5 in Kuangshan in the last 7 days was: 21 (Friday, May 27, 2022) and the lowest: 21 (Friday, May 27, 2022).
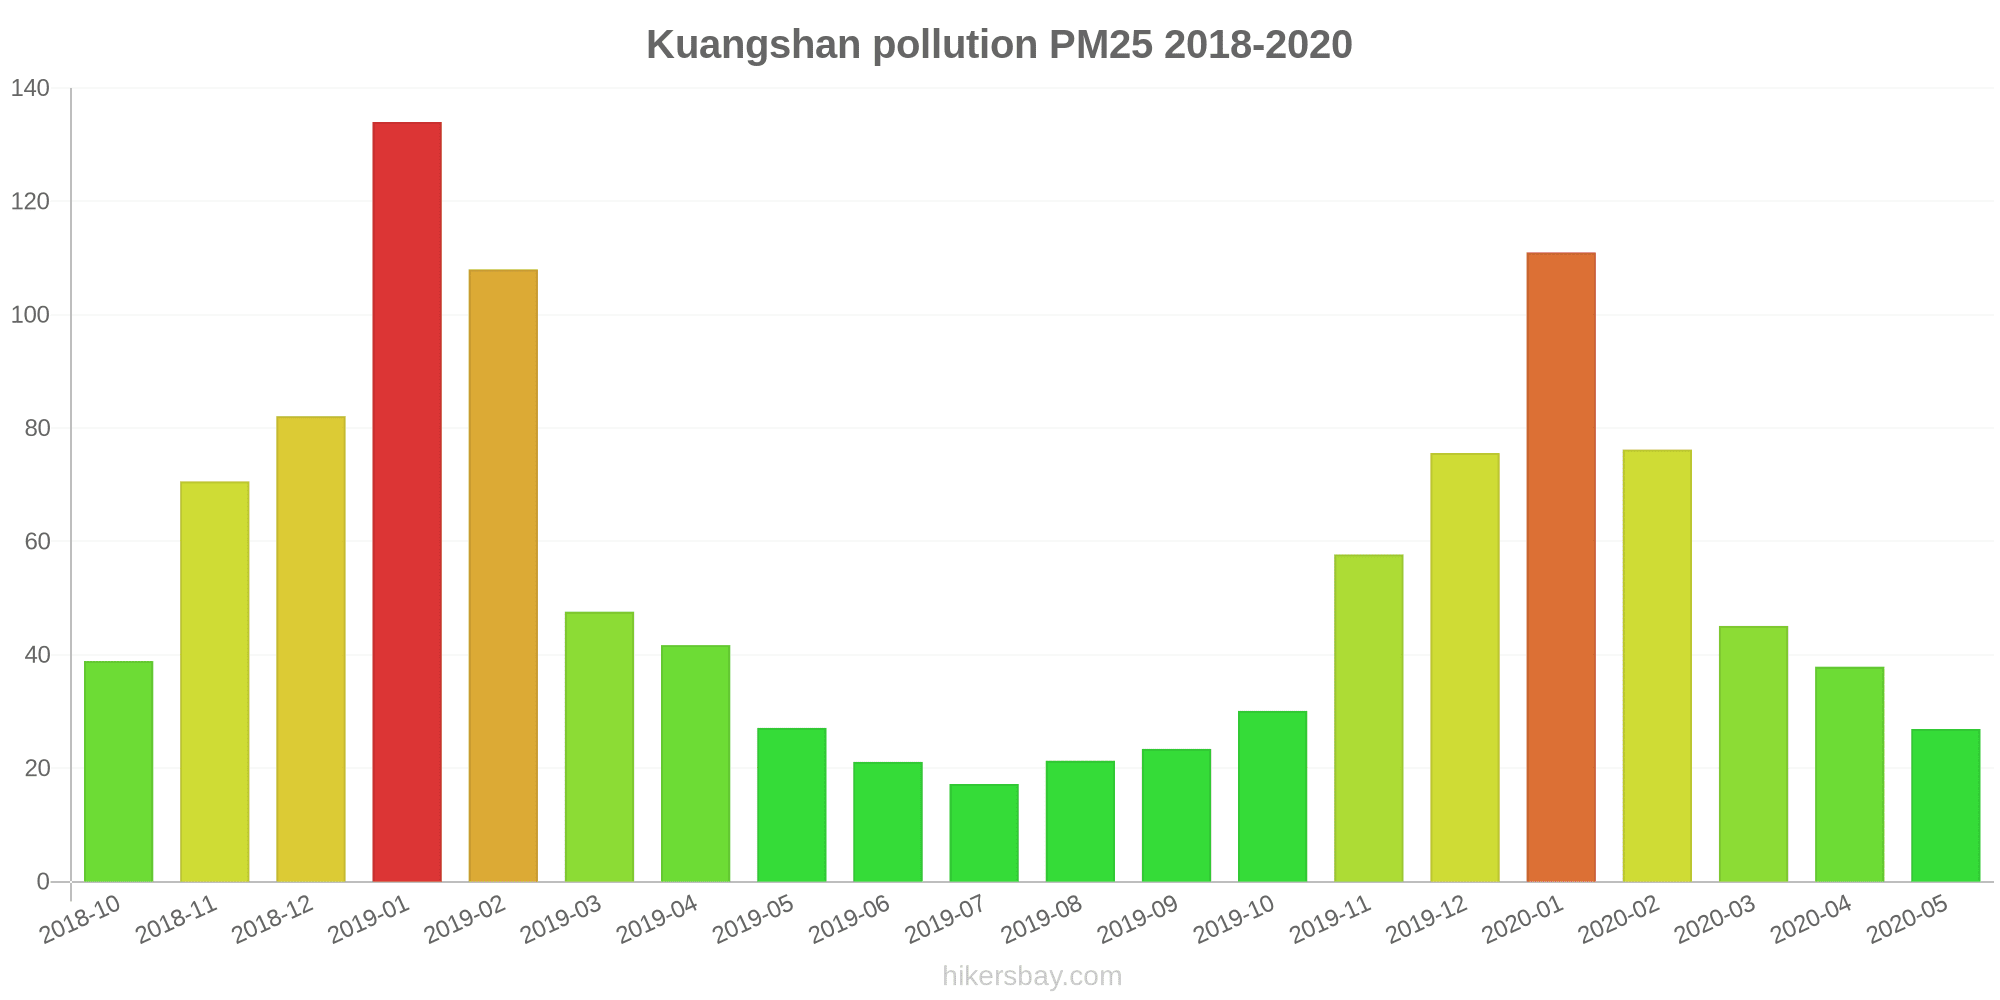
The highest PM2.5 values were recorded: 134 (January 2019).
The lowest level of particulate matter PM2.5 pollution occurs in month: July (17).
What is the level of SO2 pollution? (sulfur dioxide (SO2))
18 (Good)
How high is the level of NO2? (nitrogen dioxide (NO2))
3 (Good)
How high is the CO level? (carbon monoxide (CO))
1 (Good)
Current data Friday, May 27, 2022, 12:00 PM
PM10 53 (Unhealthy for Sensitive Groups)
O3 0 (Good)
PM2,5 7 (Good)
SO2 18 (Good)
NO2 3 (Good)
CO 1 (Good)
Data on air pollution from recent days in Kuangshan
index
2022-05-27
pm10
51
Unhealthy for Sensitive Groups
o3
0
Good
pm25
21
Moderate
so2
10
Good
no2
0
Good
co
1
Good
data source »
Air pollution in Kuangshan from October 2018 to May 2020

index
2020-05
2020-04
2020-03
2020-02
2020-01
2019-12
2019-11
2019-10
2019-09
2019-08
2019-07
2019-06
2019-05
2019-04
2019-03
2019-02
2019-01
2018-12
2018-11
2018-10
pm25
27 (Moderate)
38 (Unhealthy for Sensitive Groups)
45 (Unhealthy for Sensitive Groups)
76 (Very Unhealthy)
111 (Very bad Hazardous)
76 (Very Unhealthy)
58 (Unhealthy)
30 (Moderate)
23 (Moderate)
21 (Moderate)
17 (Moderate)
21 (Moderate)
27 (Moderate)
42 (Unhealthy for Sensitive Groups)
48 (Unhealthy for Sensitive Groups)
108 (Very Unhealthy)
134 (Very bad Hazardous)
82 (Very Unhealthy)
71 (Unhealthy)
39 (Unhealthy for Sensitive Groups)
co
340 (Good)
495 (Good)
581 (Good)
1 (Good)
1 (Good)
1 (Good)
920 (Good)
886 (Good)
684 (Good)
633 (Good)
425 (Good)
382 (Good)
344 (Good)
326 (Good)
422 (Good)
1 (Good)
1 (Good)
1 (Good)
1 (Good)
694 (Good)
no2
27 (Good)
33 (Good)
32 (Good)
20 (Good)
39 (Good)
55 (Moderate)
48 (Moderate)
35 (Good)
27 (Good)
21 (Good)
21 (Good)
24 (Good)
25 (Good)
24 (Good)
40 (Good)
35 (Good)
48 (Moderate)
50 (Moderate)
52 (Moderate)
42 (Moderate)
o3
141 (Unhealthy for Sensitive Groups)
125 (Unhealthy for Sensitive Groups)
100 (Moderate)
98 (Moderate)
62 (Good)
54 (Good)
60 (Good)
81 (Moderate)
135 (Unhealthy for Sensitive Groups)
154 (Unhealthy)
161 (Unhealthy)
161 (Unhealthy)
143 (Unhealthy for Sensitive Groups)
128 (Unhealthy for Sensitive Groups)
113 (Moderate)
89 (Moderate)
53 (Good)
49 (Good)
70 (Good)
100 (Moderate)
pm10
78 (Unhealthy for Sensitive Groups)
88 (Unhealthy)
109 (Unhealthy)
116 (Very Unhealthy)
162 (Very bad Hazardous)
154 (Very bad Hazardous)
134 (Very Unhealthy)
85 (Unhealthy)
54 (Unhealthy for Sensitive Groups)
57 (Unhealthy for Sensitive Groups)
52 (Unhealthy for Sensitive Groups)
66 (Unhealthy for Sensitive Groups)
119 (Very Unhealthy)
129 (Very Unhealthy)
134 (Very Unhealthy)
183 (Very bad Hazardous)
221 (Very bad Hazardous)
195 (Very bad Hazardous)
176 (Very bad Hazardous)
111 (Very Unhealthy)
so2
7.3 (Good)
12 (Good)
11 (Good)
13 (Good)
14 (Good)
15 (Good)
7.9 (Good)
5.3 (Good)
6.6 (Good)
6.9 (Good)
5.2 (Good)
7.6 (Good)
9.3 (Good)
7.7 (Good)
13 (Good)
14 (Good)
20 (Good)
23 (Good)
12 (Good)
9.4 (Good)
data source »
农科所
Friday, May 27, 2022, 12:00 PM
PM10 53 (Unhealthy for Sensitive Groups)
particulate matter (PM10) suspended dust
O3 0.02 (Good)
ozone (O3)
PM2,5 6.6 (Good)
particulate matter (PM2.5) dust
SO2 18 (Good)
sulfur dioxide (SO2)
NO2 3 (Good)
nitrogen dioxide (NO2)
CO 1.3 (Good)
carbon monoxide (CO)
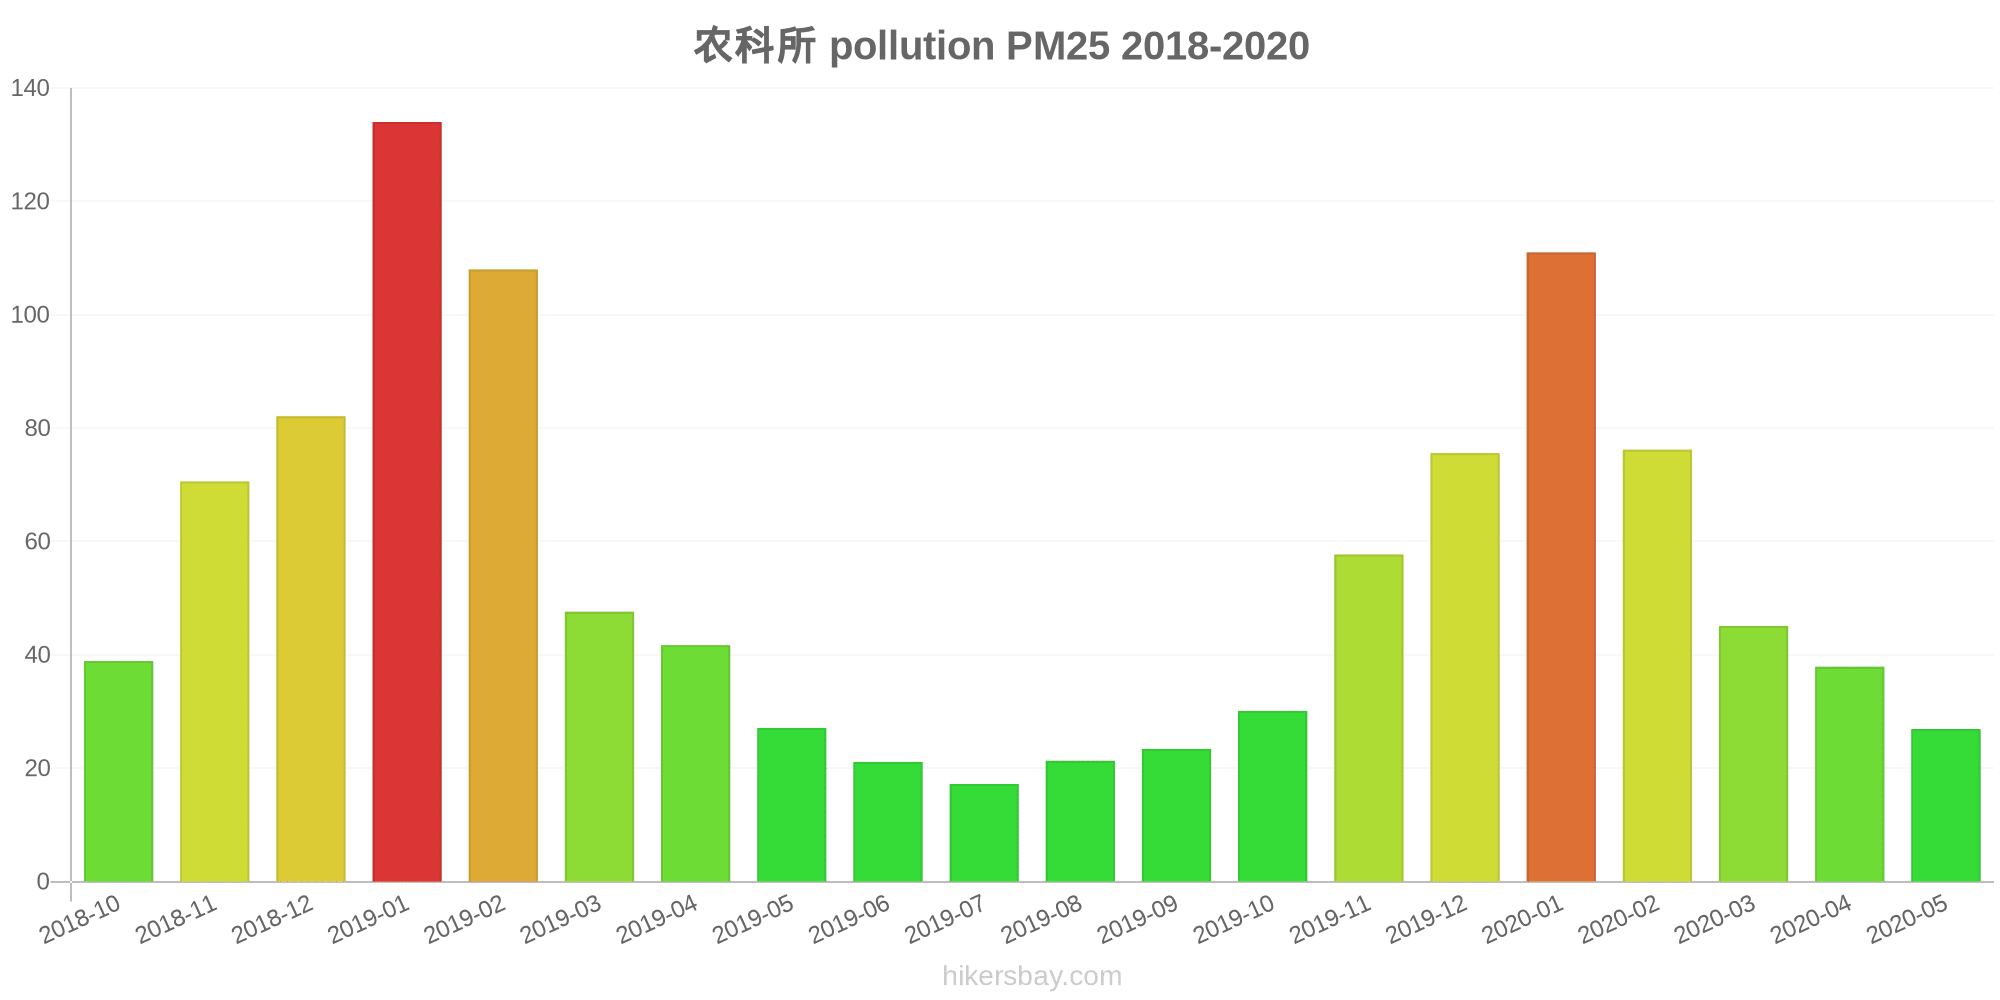
农科所
index
2022-05-27
pm10
51
o3
0.02
pm25
21
so2
9.6
no2
0.38
co
0.64
农科所
2018-10 2020-05

index
2020-05
2020-04
2020-03
2020-02
2020-01
2019-12
2019-11
2019-10
2019-09
2019-08
2019-07
2019-06
2019-05
2019-04
2019-03
2019-02
2019-01
2018-12
2018-11
2018-10
pm25
27
38
45
76
111
76
58
30
23
21
17
21
27
42
48
108
134
82
71
39
co
340
495
581
1
1
1
920
886
684
633
425
382
344
326
422
1
1
1
1
694
no2
27
33
32
20
39
55
48
35
27
21
21
24
25
24
40
35
48
50
52
42
o3
141
125
100
98
62
54
60
81
135
154
161
161
143
128
113
89
53
49
70
100
pm10
78
88
109
116
162
154
134
85
54
57
52
66
119
129
134
183
221
195
176
111
so2
7.3
12
11
13
14
15
7.9
5.3
6.6
6.9
5.2
7.6
9.3
7.7
13
14
20
23
12
9.4
* Pollution data source:
https://openaq.org
(ChinaAQIData)
The data is licensed under CC-By 4.0
PM10 53 (Unhealthy for Sensitive Groups)
O3 0 (Good)
PM2,5 7 (Good)
SO2 18 (Good)
NO2 3 (Good)
CO 1 (Good)
Data on air pollution from recent days in Kuangshan
| index | 2022-05-27 |
|---|---|
| pm10 | 51 Unhealthy for Sensitive Groups |
| o3 | 0 Good |
| pm25 | 21 Moderate |
| so2 | 10 Good |
| no2 | 0 Good |
| co | 1 Good |
| index | 2020-05 | 2020-04 | 2020-03 | 2020-02 | 2020-01 | 2019-12 | 2019-11 | 2019-10 | 2019-09 | 2019-08 | 2019-07 | 2019-06 | 2019-05 | 2019-04 | 2019-03 | 2019-02 | 2019-01 | 2018-12 | 2018-11 | 2018-10 |
|---|---|---|---|---|---|---|---|---|---|---|---|---|---|---|---|---|---|---|---|---|
| pm25 | 27 (Moderate) | 38 (Unhealthy for Sensitive Groups) | 45 (Unhealthy for Sensitive Groups) | 76 (Very Unhealthy) | 111 (Very bad Hazardous) | 76 (Very Unhealthy) | 58 (Unhealthy) | 30 (Moderate) | 23 (Moderate) | 21 (Moderate) | 17 (Moderate) | 21 (Moderate) | 27 (Moderate) | 42 (Unhealthy for Sensitive Groups) | 48 (Unhealthy for Sensitive Groups) | 108 (Very Unhealthy) | 134 (Very bad Hazardous) | 82 (Very Unhealthy) | 71 (Unhealthy) | 39 (Unhealthy for Sensitive Groups) |
| co | 340 (Good) | 495 (Good) | 581 (Good) | 1 (Good) | 1 (Good) | 1 (Good) | 920 (Good) | 886 (Good) | 684 (Good) | 633 (Good) | 425 (Good) | 382 (Good) | 344 (Good) | 326 (Good) | 422 (Good) | 1 (Good) | 1 (Good) | 1 (Good) | 1 (Good) | 694 (Good) |
| no2 | 27 (Good) | 33 (Good) | 32 (Good) | 20 (Good) | 39 (Good) | 55 (Moderate) | 48 (Moderate) | 35 (Good) | 27 (Good) | 21 (Good) | 21 (Good) | 24 (Good) | 25 (Good) | 24 (Good) | 40 (Good) | 35 (Good) | 48 (Moderate) | 50 (Moderate) | 52 (Moderate) | 42 (Moderate) |
| o3 | 141 (Unhealthy for Sensitive Groups) | 125 (Unhealthy for Sensitive Groups) | 100 (Moderate) | 98 (Moderate) | 62 (Good) | 54 (Good) | 60 (Good) | 81 (Moderate) | 135 (Unhealthy for Sensitive Groups) | 154 (Unhealthy) | 161 (Unhealthy) | 161 (Unhealthy) | 143 (Unhealthy for Sensitive Groups) | 128 (Unhealthy for Sensitive Groups) | 113 (Moderate) | 89 (Moderate) | 53 (Good) | 49 (Good) | 70 (Good) | 100 (Moderate) |
| pm10 | 78 (Unhealthy for Sensitive Groups) | 88 (Unhealthy) | 109 (Unhealthy) | 116 (Very Unhealthy) | 162 (Very bad Hazardous) | 154 (Very bad Hazardous) | 134 (Very Unhealthy) | 85 (Unhealthy) | 54 (Unhealthy for Sensitive Groups) | 57 (Unhealthy for Sensitive Groups) | 52 (Unhealthy for Sensitive Groups) | 66 (Unhealthy for Sensitive Groups) | 119 (Very Unhealthy) | 129 (Very Unhealthy) | 134 (Very Unhealthy) | 183 (Very bad Hazardous) | 221 (Very bad Hazardous) | 195 (Very bad Hazardous) | 176 (Very bad Hazardous) | 111 (Very Unhealthy) |
| so2 | 7.3 (Good) | 12 (Good) | 11 (Good) | 13 (Good) | 14 (Good) | 15 (Good) | 7.9 (Good) | 5.3 (Good) | 6.6 (Good) | 6.9 (Good) | 5.2 (Good) | 7.6 (Good) | 9.3 (Good) | 7.7 (Good) | 13 (Good) | 14 (Good) | 20 (Good) | 23 (Good) | 12 (Good) | 9.4 (Good) |
PM10 53 (Unhealthy for Sensitive Groups)
particulate matter (PM10) suspended dustO3 0.02 (Good)
ozone (O3)PM2,5 6.6 (Good)
particulate matter (PM2.5) dustSO2 18 (Good)
sulfur dioxide (SO2)NO2 3 (Good)
nitrogen dioxide (NO2)CO 1.3 (Good)
carbon monoxide (CO)农科所
| index | 2022-05-27 |
|---|---|
| pm10 | 51 |
| o3 | 0.02 |
| pm25 | 21 |
| so2 | 9.6 |
| no2 | 0.38 |
| co | 0.64 |
农科所
| index | 2020-05 | 2020-04 | 2020-03 | 2020-02 | 2020-01 | 2019-12 | 2019-11 | 2019-10 | 2019-09 | 2019-08 | 2019-07 | 2019-06 | 2019-05 | 2019-04 | 2019-03 | 2019-02 | 2019-01 | 2018-12 | 2018-11 | 2018-10 |
|---|---|---|---|---|---|---|---|---|---|---|---|---|---|---|---|---|---|---|---|---|
| pm25 | 27 | 38 | 45 | 76 | 111 | 76 | 58 | 30 | 23 | 21 | 17 | 21 | 27 | 42 | 48 | 108 | 134 | 82 | 71 | 39 |
| co | 340 | 495 | 581 | 1 | 1 | 1 | 920 | 886 | 684 | 633 | 425 | 382 | 344 | 326 | 422 | 1 | 1 | 1 | 1 | 694 |
| no2 | 27 | 33 | 32 | 20 | 39 | 55 | 48 | 35 | 27 | 21 | 21 | 24 | 25 | 24 | 40 | 35 | 48 | 50 | 52 | 42 |
| o3 | 141 | 125 | 100 | 98 | 62 | 54 | 60 | 81 | 135 | 154 | 161 | 161 | 143 | 128 | 113 | 89 | 53 | 49 | 70 | 100 |
| pm10 | 78 | 88 | 109 | 116 | 162 | 154 | 134 | 85 | 54 | 57 | 52 | 66 | 119 | 129 | 134 | 183 | 221 | 195 | 176 | 111 |
| so2 | 7.3 | 12 | 11 | 13 | 14 | 15 | 7.9 | 5.3 | 6.6 | 6.9 | 5.2 | 7.6 | 9.3 | 7.7 | 13 | 14 | 20 | 23 | 12 | 9.4 |