Air Pollution in Wangtun: Real-time Air Quality Index and smog alert.
Pollution and air quality forecast for Wangtun. Today is Tuesday, June 16, 2026. The following air pollution values have been recorded for Wangtun:- particulate matter (PM10) suspended dust - 53 (Unhealthy for Sensitive Groups)
- ozone (O3) - 0 (Good)
- particulate matter (PM2.5) dust - 7 (Good)
- sulfur dioxide (SO2) - 18 (Good)
- nitrogen dioxide (NO2) - 3 (Good)
- carbon monoxide (CO) - 1 (Good)

What is the air quality in Wangtun today? Is the air polluted in Wangtun?. Is there smog?
What is the level of PM10 today in Wangtun? (particulate matter (PM10) suspended dust)
The current level of particulate matter PM10 in Wangtun is:
53 (Unhealthy for Sensitive Groups)
The highest PM10 values usually occur in month: 208 (February 2019).
The lowest value of particulate matter PM10 pollution in Wangtun is usually recorded in: August (51).
How is the O3 level today in Wangtun? (ozone (O3))
0 (Good)
What is the current level of PM2.5 in Wangtun? (particulate matter (PM2.5) dust)
Today's PM2.5 level is:
7 (Good)
For comparison, the highest level of PM2.5 in Wangtun in the last 7 days was: 21 (Friday, May 27, 2022) and the lowest: 21 (Friday, May 27, 2022).
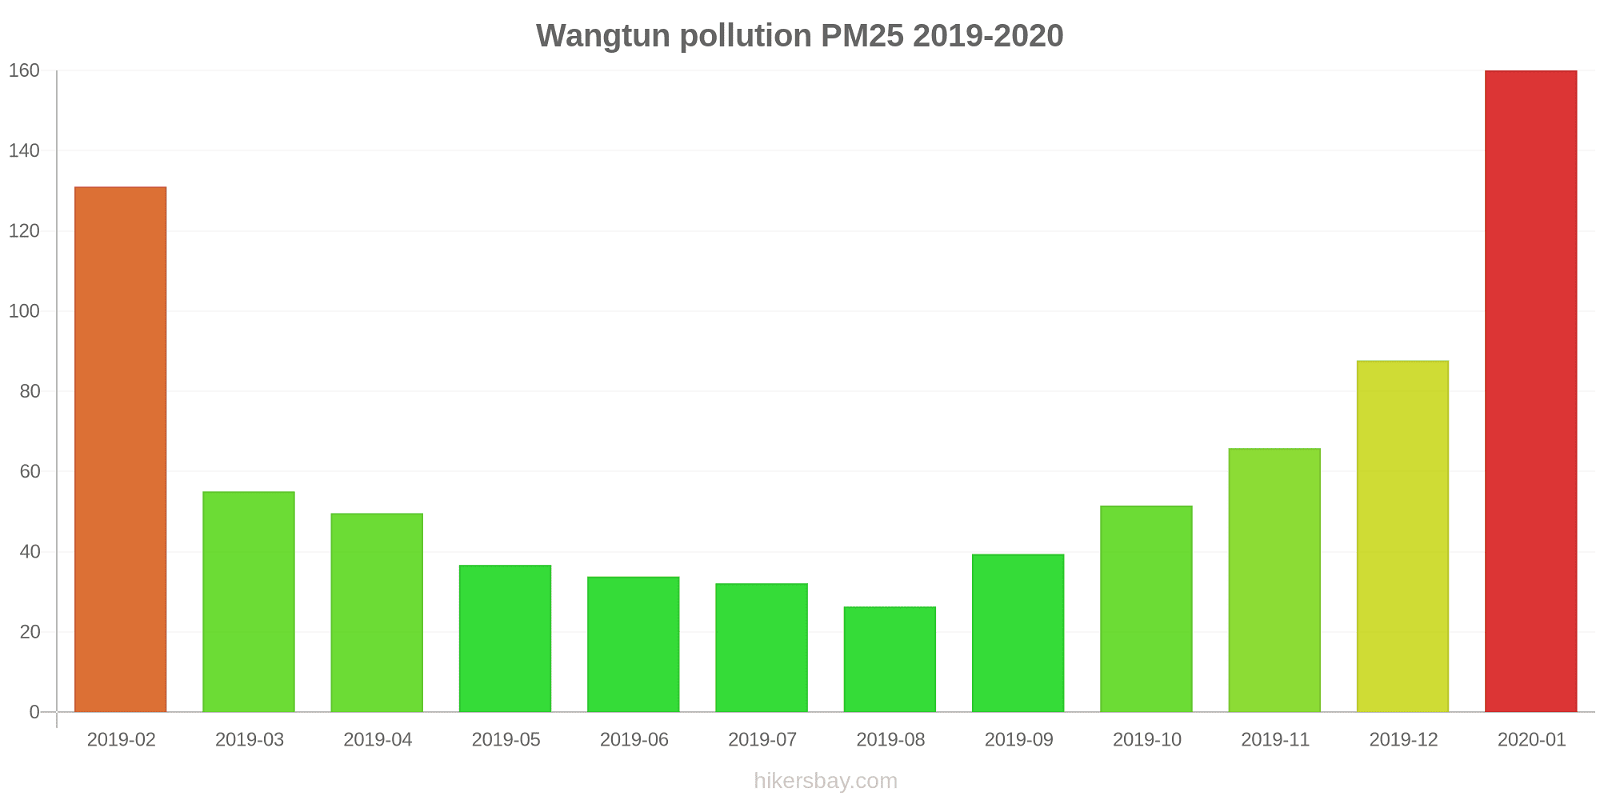
The highest PM2.5 values were recorded: 160 (January 2020).
The lowest level of particulate matter PM2.5 pollution occurs in month: August (26).
What is the level of SO2 pollution? (sulfur dioxide (SO2))
18 (Good)
How high is the level of NO2? (nitrogen dioxide (NO2))
3 (Good)
How high is the CO level? (carbon monoxide (CO))
1 (Good)
Current data Friday, May 27, 2022, 12:00 PM
PM10 53 (Unhealthy for Sensitive Groups)
O3 0 (Good)
PM2,5 7 (Good)
SO2 18 (Good)
NO2 3 (Good)
CO 1 (Good)
Data on air pollution from recent days in Wangtun
index
2022-05-27
pm10
51
Unhealthy for Sensitive Groups
o3
0
Good
pm25
21
Moderate
so2
10
Good
no2
0
Good
co
1
Good
data source »
Air pollution in Wangtun from February 2019 to January 2020
index
2020-01
2019-12
2019-11
2019-10
2019-09
2019-08
2019-07
2019-06
2019-05
2019-04
2019-03
2019-02
pm25
160 (Very bad Hazardous)
88 (Very Unhealthy)
66 (Unhealthy)
52 (Unhealthy for Sensitive Groups)
39 (Unhealthy for Sensitive Groups)
26 (Moderate)
32 (Moderate)
34 (Moderate)
37 (Unhealthy for Sensitive Groups)
50 (Unhealthy for Sensitive Groups)
55 (Unhealthy)
131 (Very bad Hazardous)
co
2 (Good)
1 (Good)
899 (Good)
788 (Good)
719 (Good)
680 (Good)
750 (Good)
617 (Good)
545 (Good)
739 (Good)
831 (Good)
1 (Good)
no2
73 (Moderate)
52 (Moderate)
51 (Moderate)
48 (Moderate)
39 (Good)
29 (Good)
26 (Good)
29 (Good)
29 (Good)
35 (Good)
43 (Moderate)
73 (Moderate)
o3
54 (Good)
49 (Good)
82 (Moderate)
122 (Unhealthy for Sensitive Groups)
178 (Unhealthy)
146 (Unhealthy for Sensitive Groups)
199 (Very Unhealthy)
231 (Very Unhealthy)
180 (Very Unhealthy)
141 (Unhealthy for Sensitive Groups)
131 (Unhealthy for Sensitive Groups)
127 (Unhealthy for Sensitive Groups)
pm10
200 (Very bad Hazardous)
127 (Very Unhealthy)
136 (Very Unhealthy)
118 (Very Unhealthy)
85 (Unhealthy)
51 (Unhealthy for Sensitive Groups)
63 (Unhealthy for Sensitive Groups)
87 (Unhealthy)
98 (Unhealthy)
113 (Very Unhealthy)
132 (Very Unhealthy)
208 (Very bad Hazardous)
so2
14 (Good)
12 (Good)
14 (Good)
11 (Good)
11 (Good)
9 (Good)
9.4 (Good)
15 (Good)
16 (Good)
14 (Good)
17 (Good)
25 (Good)
data source »
监控中心(20190222启用)
Friday, May 27, 2022, 12:00 PM
PM10 53 (Unhealthy for Sensitive Groups)
particulate matter (PM10) suspended dust
O3 0.02 (Good)
ozone (O3)
PM2,5 6.6 (Good)
particulate matter (PM2.5) dust
SO2 18 (Good)
sulfur dioxide (SO2)
NO2 3 (Good)
nitrogen dioxide (NO2)
CO 1.3 (Good)
carbon monoxide (CO)
监控中心(20190222启用)
index
2022-05-27
pm10
51
o3
0.02
pm25
21
so2
9.6
no2
0.38
co
0.64
监控中心(20190222启用)
2019-02 2020-01
index
2020-01
2019-12
2019-11
2019-10
2019-09
2019-08
2019-07
2019-06
2019-05
2019-04
2019-03
2019-02
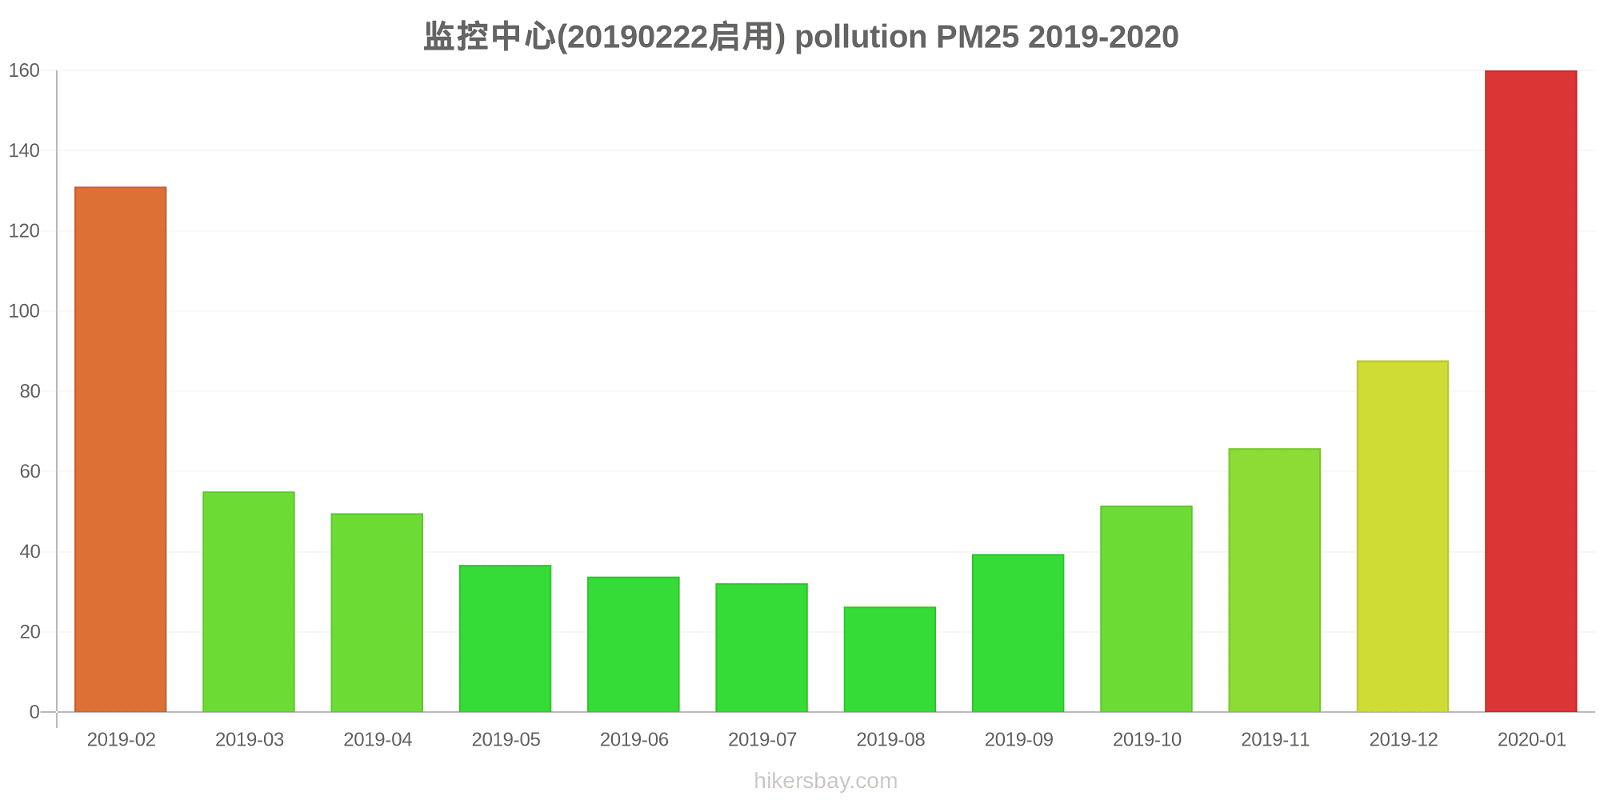
pm25
160
88
66
52
39
26
32
34
37
50
55
131
co
2
1
899
788
719
680
750
617
545
739
831
1
no2
73
52
51
48
39
29
26
29
29
35
43
73
o3
54
49
82
122
178
146
199
231
180
141
131
127
pm10
200
127
136
118
85
51
63
87
98
113
132
208
so2
14
12
14
11
11
9
9.4
15
16
14
17
25
* Pollution data source:
https://openaq.org
()
The data is licensed under CC-By 4.0
PM10 53 (Unhealthy for Sensitive Groups)
O3 0 (Good)
PM2,5 7 (Good)
SO2 18 (Good)
NO2 3 (Good)
CO 1 (Good)
Data on air pollution from recent days in Wangtun
| index | 2022-05-27 |
|---|---|
| pm10 | 51 Unhealthy for Sensitive Groups |
| o3 | 0 Good |
| pm25 | 21 Moderate |
| so2 | 10 Good |
| no2 | 0 Good |
| co | 1 Good |

| index | 2020-01 | 2019-12 | 2019-11 | 2019-10 | 2019-09 | 2019-08 | 2019-07 | 2019-06 | 2019-05 | 2019-04 | 2019-03 | 2019-02 |
|---|---|---|---|---|---|---|---|---|---|---|---|---|
| pm25 | 160 (Very bad Hazardous) | 88 (Very Unhealthy) | 66 (Unhealthy) | 52 (Unhealthy for Sensitive Groups) | 39 (Unhealthy for Sensitive Groups) | 26 (Moderate) | 32 (Moderate) | 34 (Moderate) | 37 (Unhealthy for Sensitive Groups) | 50 (Unhealthy for Sensitive Groups) | 55 (Unhealthy) | 131 (Very bad Hazardous) |
| co | 2 (Good) | 1 (Good) | 899 (Good) | 788 (Good) | 719 (Good) | 680 (Good) | 750 (Good) | 617 (Good) | 545 (Good) | 739 (Good) | 831 (Good) | 1 (Good) |
| no2 | 73 (Moderate) | 52 (Moderate) | 51 (Moderate) | 48 (Moderate) | 39 (Good) | 29 (Good) | 26 (Good) | 29 (Good) | 29 (Good) | 35 (Good) | 43 (Moderate) | 73 (Moderate) |
| o3 | 54 (Good) | 49 (Good) | 82 (Moderate) | 122 (Unhealthy for Sensitive Groups) | 178 (Unhealthy) | 146 (Unhealthy for Sensitive Groups) | 199 (Very Unhealthy) | 231 (Very Unhealthy) | 180 (Very Unhealthy) | 141 (Unhealthy for Sensitive Groups) | 131 (Unhealthy for Sensitive Groups) | 127 (Unhealthy for Sensitive Groups) |
| pm10 | 200 (Very bad Hazardous) | 127 (Very Unhealthy) | 136 (Very Unhealthy) | 118 (Very Unhealthy) | 85 (Unhealthy) | 51 (Unhealthy for Sensitive Groups) | 63 (Unhealthy for Sensitive Groups) | 87 (Unhealthy) | 98 (Unhealthy) | 113 (Very Unhealthy) | 132 (Very Unhealthy) | 208 (Very bad Hazardous) |
| so2 | 14 (Good) | 12 (Good) | 14 (Good) | 11 (Good) | 11 (Good) | 9 (Good) | 9.4 (Good) | 15 (Good) | 16 (Good) | 14 (Good) | 17 (Good) | 25 (Good) |
PM10 53 (Unhealthy for Sensitive Groups)
particulate matter (PM10) suspended dustO3 0.02 (Good)
ozone (O3)PM2,5 6.6 (Good)
particulate matter (PM2.5) dustSO2 18 (Good)
sulfur dioxide (SO2)NO2 3 (Good)
nitrogen dioxide (NO2)CO 1.3 (Good)
carbon monoxide (CO)监控中心(20190222启用)
| index | 2022-05-27 |
|---|---|
| pm10 | 51 |
| o3 | 0.02 |
| pm25 | 21 |
| so2 | 9.6 |
| no2 | 0.38 |
| co | 0.64 |
监控中心(20190222启用)

| index | 2020-01 | 2019-12 | 2019-11 | 2019-10 | 2019-09 | 2019-08 | 2019-07 | 2019-06 | 2019-05 | 2019-04 | 2019-03 | 2019-02 |
|---|---|---|---|---|---|---|---|---|---|---|---|---|
| pm25 | 160 | 88 | 66 | 52 | 39 | 26 | 32 | 34 | 37 | 50 | 55 | 131 |
| co | 2 | 1 | 899 | 788 | 719 | 680 | 750 | 617 | 545 | 739 | 831 | 1 |
| no2 | 73 | 52 | 51 | 48 | 39 | 29 | 26 | 29 | 29 | 35 | 43 | 73 |
| o3 | 54 | 49 | 82 | 122 | 178 | 146 | 199 | 231 | 180 | 141 | 131 | 127 |
| pm10 | 200 | 127 | 136 | 118 | 85 | 51 | 63 | 87 | 98 | 113 | 132 | 208 |
| so2 | 14 | 12 | 14 | 11 | 11 | 9 | 9.4 | 15 | 16 | 14 | 17 | 25 |