Air Pollution in Qianweihuazhuang: Real-time Air Quality Index and smog alert.
Pollution and air quality forecast for Qianweihuazhuang. Today is Tuesday, June 16, 2026. The following air pollution values have been recorded for Qianweihuazhuang:- particulate matter (PM10) suspended dust - 53 (Unhealthy for Sensitive Groups)
- ozone (O3) - 0 (Good)
- particulate matter (PM2.5) dust - 7 (Good)
- sulfur dioxide (SO2) - 18 (Good)
- nitrogen dioxide (NO2) - 3 (Good)
- carbon monoxide (CO) - 1 (Good)

What is the air quality in Qianweihuazhuang today? Is the air polluted in Qianweihuazhuang?. Is there smog?
What is the level of PM10 today in Qianweihuazhuang? (particulate matter (PM10) suspended dust)
The current level of particulate matter PM10 in Qianweihuazhuang is:
53 (Unhealthy for Sensitive Groups)
The highest PM10 values usually occur in month: 175 (January 2019).
The lowest value of particulate matter PM10 pollution in Qianweihuazhuang is usually recorded in: August (60).
How is the O3 level today in Qianweihuazhuang? (ozone (O3))
0 (Good)
What is the current level of PM2.5 in Qianweihuazhuang? (particulate matter (PM2.5) dust)
Today's PM2.5 level is:
7 (Good)
For comparison, the highest level of PM2.5 in Qianweihuazhuang in the last 7 days was: 21 (Friday, May 27, 2022) and the lowest: 21 (Friday, May 27, 2022).
The highest PM2.5 values were recorded: 110 (January 2020).
The lowest level of particulate matter PM2.5 pollution occurs in month: May (27).
What is the level of SO2 pollution? (sulfur dioxide (SO2))
18 (Good)
How high is the level of NO2? (nitrogen dioxide (NO2))
3 (Good)
How high is the CO level? (carbon monoxide (CO))
1 (Good)
Current data Friday, May 27, 2022, 12:00 PM
PM10 53 (Unhealthy for Sensitive Groups)
O3 0 (Good)
PM2,5 7 (Good)
SO2 18 (Good)
NO2 3 (Good)
CO 1 (Good)
Data on air pollution from recent days in Qianweihuazhuang
index
2022-05-27
pm10
51
Unhealthy for Sensitive Groups
o3
0
Good
pm25
21
Moderate
so2
10
Good
no2
0
Good
co
1
Good
data source »
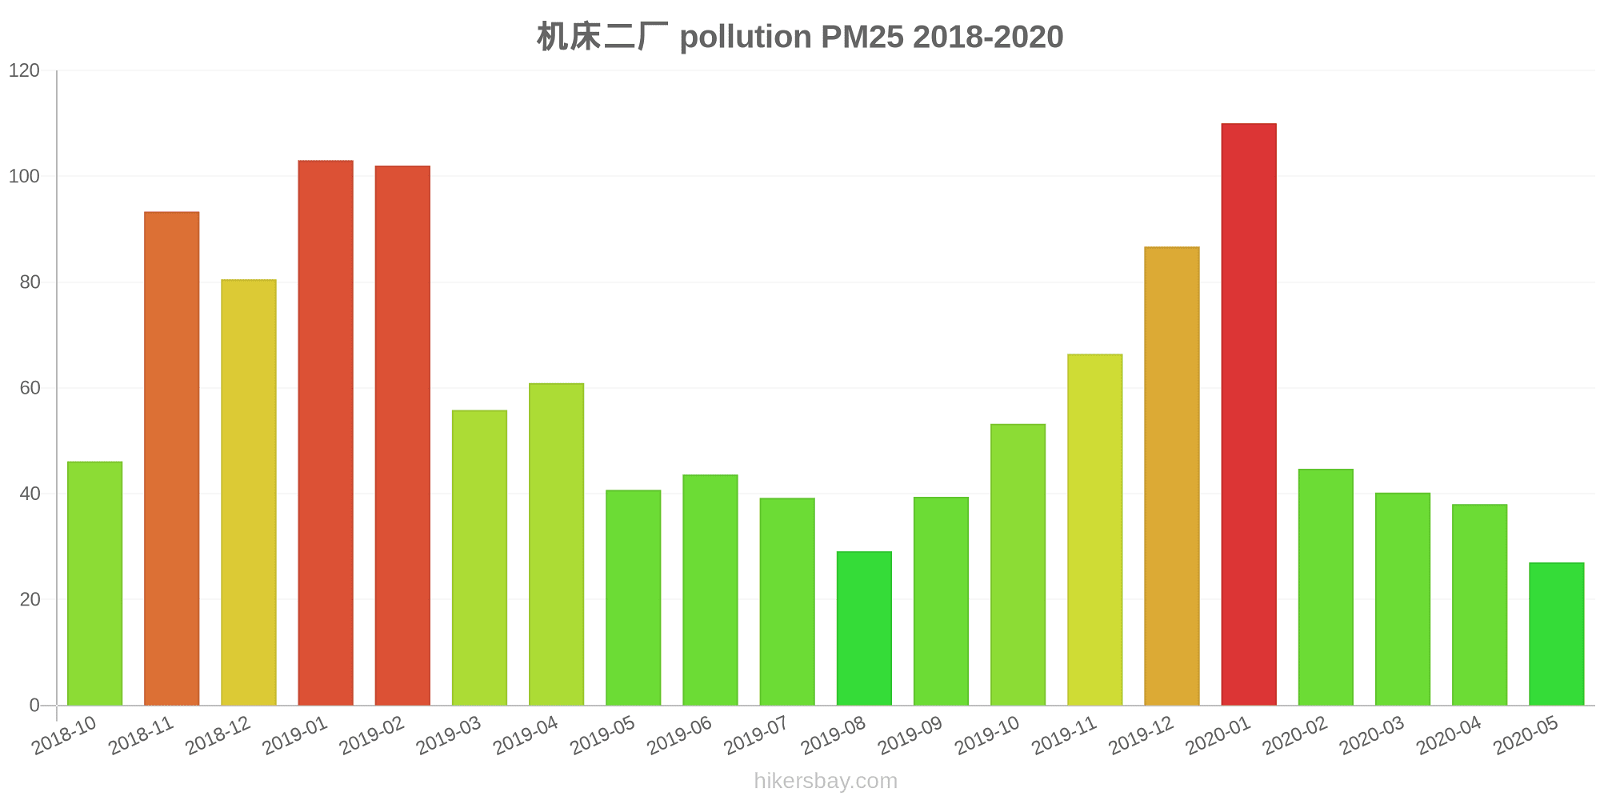
Air pollution in Qianweihuazhuang from October 2018 to May 2020

index
2020-05
2020-04
2020-03
2020-02
2020-01
2019-12
2019-11
2019-10
2019-09
2019-08
2019-07
2019-06
2019-05
2019-04
2019-03
2019-02
2019-01
2018-12
2018-11
2018-10
pm25
27 (Moderate)
38 (Unhealthy for Sensitive Groups)
40 (Unhealthy for Sensitive Groups)
45 (Unhealthy for Sensitive Groups)
110 (Very bad Hazardous)
87 (Very Unhealthy)
66 (Unhealthy)
53 (Unhealthy for Sensitive Groups)
39 (Unhealthy for Sensitive Groups)
29 (Moderate)
39 (Unhealthy for Sensitive Groups)
44 (Unhealthy for Sensitive Groups)
41 (Unhealthy for Sensitive Groups)
61 (Unhealthy)
56 (Unhealthy)
102 (Very Unhealthy)
103 (Very Unhealthy)
81 (Very Unhealthy)
93 (Very Unhealthy)
46 (Unhealthy for Sensitive Groups)
co
575 (Good)
661 (Good)
569 (Good)
660 (Good)
1 (Good)
1 (Good)
933 (Good)
706 (Good)
647 (Good)
528 (Good)
473 (Good)
545 (Good)
553 (Good)
785 (Good)
668 (Good)
1 (Good)
1 (Good)
1 (Good)
1 (Good)
638 (Good)
no2
27 (Good)
35 (Good)
32 (Good)
26 (Good)
61 (Moderate)
58 (Moderate)
59 (Moderate)
50 (Moderate)
47 (Moderate)
34 (Good)
28 (Good)
28 (Good)
32 (Good)
46 (Moderate)
46 (Moderate)
53 (Moderate)
66 (Moderate)
62 (Moderate)
61 (Moderate)
55 (Moderate)
o3
164 (Unhealthy)
142 (Unhealthy for Sensitive Groups)
118 (Moderate)
96 (Moderate)
71 (Moderate)
54 (Good)
79 (Moderate)
124 (Unhealthy for Sensitive Groups)
183 (Very Unhealthy)
158 (Unhealthy)
223 (Very Unhealthy)
241 (Very bad Hazardous)
179 (Unhealthy)
138 (Unhealthy for Sensitive Groups)
124 (Unhealthy for Sensitive Groups)
97 (Moderate)
60 (Good)
47 (Good)
90 (Moderate)
114 (Moderate)
pm10
77 (Unhealthy for Sensitive Groups)
104 (Unhealthy)
98 (Unhealthy)
73 (Unhealthy for Sensitive Groups)
150 (Very bad Hazardous)
134 (Very Unhealthy)
143 (Very Unhealthy)
121 (Very Unhealthy)
93 (Unhealthy)
60 (Unhealthy for Sensitive Groups)
74 (Unhealthy for Sensitive Groups)
97 (Unhealthy)
113 (Very Unhealthy)
132 (Very Unhealthy)
133 (Very Unhealthy)
155 (Very bad Hazardous)
175 (Very bad Hazardous)
166 (Very bad Hazardous)
168 (Very bad Hazardous)
122 (Very Unhealthy)
so2
8.5 (Good)
10 (Good)
13 (Good)
17 (Good)
38 (Good)
28 (Good)
16 (Good)
11 (Good)
9.3 (Good)
6.7 (Good)
6.7 (Good)
11 (Good)
9.9 (Good)
13 (Good)
14 (Good)
29 (Good)
41 (Good)
30 (Good)
16 (Good)
12 (Good)
data source »
机床二厂
Friday, May 27, 2022, 12:00 PM
PM10 53 (Unhealthy for Sensitive Groups)
particulate matter (PM10) suspended dust
O3 0.02 (Good)
ozone (O3)
PM2,5 6.6 (Good)
particulate matter (PM2.5) dust
SO2 18 (Good)
sulfur dioxide (SO2)
NO2 3 (Good)
nitrogen dioxide (NO2)
CO 1.3 (Good)
carbon monoxide (CO)
机床二厂
index
2022-05-27
pm10
51
o3
0.02
pm25
21
so2
9.6
no2
0.38
co
0.64
机床二厂
2018-10 2020-05
index
2020-05
2020-04
2020-03
2020-02
2020-01
2019-12
2019-11
2019-10
2019-09
2019-08
2019-07
2019-06
2019-05
2019-04
2019-03
2019-02
2019-01
2018-12
2018-11
2018-10
pm25
27
38
40
45
110
87
66
53
39
29
39
44
41
61
56
102
103
81
93
46
co
575
661
569
660
1
1
933
706
647
528
473
545
553
785
668
1
1
1
1
638
no2
27
35
32
26
61
58
59
50
47
34
28
28
32
46
46
53
66
62
61
55
o3
164
142
118
96
71
54
79
124
183
158
223
241
179
138
124
97
60
47
90
114
pm10
77
104
98
73
150
134
143
121
93
60
74
97
113
132
133
155
175
166
168
122
so2
8.5
10
13
17
38
28
16
11
9.3
6.7
6.7
11
9.9
13
14
29
41
30
16
12
* Pollution data source:
https://openaq.org
(ChinaAQIData)
The data is licensed under CC-By 4.0
PM10 53 (Unhealthy for Sensitive Groups)
O3 0 (Good)
PM2,5 7 (Good)
SO2 18 (Good)
NO2 3 (Good)
CO 1 (Good)
Data on air pollution from recent days in Qianweihuazhuang
| index | 2022-05-27 |
|---|---|
| pm10 | 51 Unhealthy for Sensitive Groups |
| o3 | 0 Good |
| pm25 | 21 Moderate |
| so2 | 10 Good |
| no2 | 0 Good |
| co | 1 Good |

| index | 2020-05 | 2020-04 | 2020-03 | 2020-02 | 2020-01 | 2019-12 | 2019-11 | 2019-10 | 2019-09 | 2019-08 | 2019-07 | 2019-06 | 2019-05 | 2019-04 | 2019-03 | 2019-02 | 2019-01 | 2018-12 | 2018-11 | 2018-10 |
|---|---|---|---|---|---|---|---|---|---|---|---|---|---|---|---|---|---|---|---|---|
| pm25 | 27 (Moderate) | 38 (Unhealthy for Sensitive Groups) | 40 (Unhealthy for Sensitive Groups) | 45 (Unhealthy for Sensitive Groups) | 110 (Very bad Hazardous) | 87 (Very Unhealthy) | 66 (Unhealthy) | 53 (Unhealthy for Sensitive Groups) | 39 (Unhealthy for Sensitive Groups) | 29 (Moderate) | 39 (Unhealthy for Sensitive Groups) | 44 (Unhealthy for Sensitive Groups) | 41 (Unhealthy for Sensitive Groups) | 61 (Unhealthy) | 56 (Unhealthy) | 102 (Very Unhealthy) | 103 (Very Unhealthy) | 81 (Very Unhealthy) | 93 (Very Unhealthy) | 46 (Unhealthy for Sensitive Groups) |
| co | 575 (Good) | 661 (Good) | 569 (Good) | 660 (Good) | 1 (Good) | 1 (Good) | 933 (Good) | 706 (Good) | 647 (Good) | 528 (Good) | 473 (Good) | 545 (Good) | 553 (Good) | 785 (Good) | 668 (Good) | 1 (Good) | 1 (Good) | 1 (Good) | 1 (Good) | 638 (Good) |
| no2 | 27 (Good) | 35 (Good) | 32 (Good) | 26 (Good) | 61 (Moderate) | 58 (Moderate) | 59 (Moderate) | 50 (Moderate) | 47 (Moderate) | 34 (Good) | 28 (Good) | 28 (Good) | 32 (Good) | 46 (Moderate) | 46 (Moderate) | 53 (Moderate) | 66 (Moderate) | 62 (Moderate) | 61 (Moderate) | 55 (Moderate) |
| o3 | 164 (Unhealthy) | 142 (Unhealthy for Sensitive Groups) | 118 (Moderate) | 96 (Moderate) | 71 (Moderate) | 54 (Good) | 79 (Moderate) | 124 (Unhealthy for Sensitive Groups) | 183 (Very Unhealthy) | 158 (Unhealthy) | 223 (Very Unhealthy) | 241 (Very bad Hazardous) | 179 (Unhealthy) | 138 (Unhealthy for Sensitive Groups) | 124 (Unhealthy for Sensitive Groups) | 97 (Moderate) | 60 (Good) | 47 (Good) | 90 (Moderate) | 114 (Moderate) |
| pm10 | 77 (Unhealthy for Sensitive Groups) | 104 (Unhealthy) | 98 (Unhealthy) | 73 (Unhealthy for Sensitive Groups) | 150 (Very bad Hazardous) | 134 (Very Unhealthy) | 143 (Very Unhealthy) | 121 (Very Unhealthy) | 93 (Unhealthy) | 60 (Unhealthy for Sensitive Groups) | 74 (Unhealthy for Sensitive Groups) | 97 (Unhealthy) | 113 (Very Unhealthy) | 132 (Very Unhealthy) | 133 (Very Unhealthy) | 155 (Very bad Hazardous) | 175 (Very bad Hazardous) | 166 (Very bad Hazardous) | 168 (Very bad Hazardous) | 122 (Very Unhealthy) |
| so2 | 8.5 (Good) | 10 (Good) | 13 (Good) | 17 (Good) | 38 (Good) | 28 (Good) | 16 (Good) | 11 (Good) | 9.3 (Good) | 6.7 (Good) | 6.7 (Good) | 11 (Good) | 9.9 (Good) | 13 (Good) | 14 (Good) | 29 (Good) | 41 (Good) | 30 (Good) | 16 (Good) | 12 (Good) |
PM10 53 (Unhealthy for Sensitive Groups)
particulate matter (PM10) suspended dustO3 0.02 (Good)
ozone (O3)PM2,5 6.6 (Good)
particulate matter (PM2.5) dustSO2 18 (Good)
sulfur dioxide (SO2)NO2 3 (Good)
nitrogen dioxide (NO2)CO 1.3 (Good)
carbon monoxide (CO)机床二厂
| index | 2022-05-27 |
|---|---|
| pm10 | 51 |
| o3 | 0.02 |
| pm25 | 21 |
| so2 | 9.6 |
| no2 | 0.38 |
| co | 0.64 |
机床二厂

| index | 2020-05 | 2020-04 | 2020-03 | 2020-02 | 2020-01 | 2019-12 | 2019-11 | 2019-10 | 2019-09 | 2019-08 | 2019-07 | 2019-06 | 2019-05 | 2019-04 | 2019-03 | 2019-02 | 2019-01 | 2018-12 | 2018-11 | 2018-10 |
|---|---|---|---|---|---|---|---|---|---|---|---|---|---|---|---|---|---|---|---|---|
| pm25 | 27 | 38 | 40 | 45 | 110 | 87 | 66 | 53 | 39 | 29 | 39 | 44 | 41 | 61 | 56 | 102 | 103 | 81 | 93 | 46 |
| co | 575 | 661 | 569 | 660 | 1 | 1 | 933 | 706 | 647 | 528 | 473 | 545 | 553 | 785 | 668 | 1 | 1 | 1 | 1 | 638 |
| no2 | 27 | 35 | 32 | 26 | 61 | 58 | 59 | 50 | 47 | 34 | 28 | 28 | 32 | 46 | 46 | 53 | 66 | 62 | 61 | 55 |
| o3 | 164 | 142 | 118 | 96 | 71 | 54 | 79 | 124 | 183 | 158 | 223 | 241 | 179 | 138 | 124 | 97 | 60 | 47 | 90 | 114 |
| pm10 | 77 | 104 | 98 | 73 | 150 | 134 | 143 | 121 | 93 | 60 | 74 | 97 | 113 | 132 | 133 | 155 | 175 | 166 | 168 | 122 |
| so2 | 8.5 | 10 | 13 | 17 | 38 | 28 | 16 | 11 | 9.3 | 6.7 | 6.7 | 11 | 9.9 | 13 | 14 | 29 | 41 | 30 | 16 | 12 |