Air Pollution in Xibali: Real-time Air Quality Index and smog alert.
Pollution and air quality forecast for Xibali. Today is Tuesday, June 16, 2026. The following air pollution values have been recorded for Xibali:- particulate matter (PM10) suspended dust - 53 (Unhealthy for Sensitive Groups)
- ozone (O3) - 0 (Good)
- particulate matter (PM2.5) dust - 7 (Good)
- sulfur dioxide (SO2) - 18 (Good)
- nitrogen dioxide (NO2) - 3 (Good)
- carbon monoxide (CO) - 1 (Good)

What is the air quality in Xibali today? Is the air polluted in Xibali?. Is there smog?
What is the level of PM10 today in Xibali? (particulate matter (PM10) suspended dust)
The current level of particulate matter PM10 in Xibali is:
53 (Unhealthy for Sensitive Groups)
The highest PM10 values usually occur in month: 161 (January 2019).
The lowest value of particulate matter PM10 pollution in Xibali is usually recorded in: August (53).
How is the O3 level today in Xibali? (ozone (O3))
0 (Good)
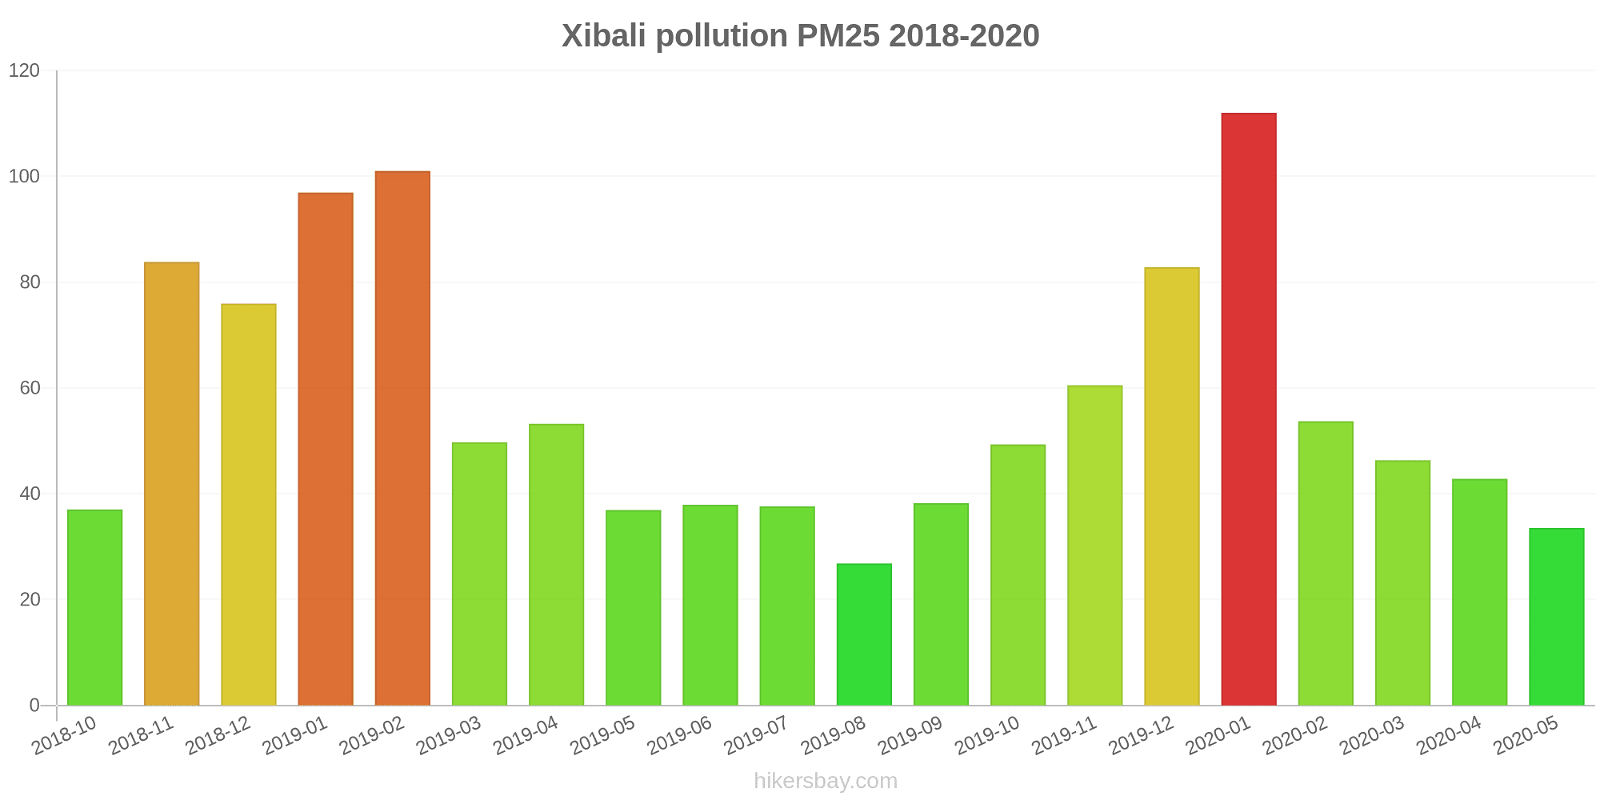
What is the current level of PM2.5 in Xibali? (particulate matter (PM2.5) dust)
Today's PM2.5 level is:
7 (Good)
For comparison, the highest level of PM2.5 in Xibali in the last 7 days was: 21 (Friday, May 27, 2022) and the lowest: 21 (Friday, May 27, 2022).
The highest PM2.5 values were recorded: 112 (January 2020).
The lowest level of particulate matter PM2.5 pollution occurs in month: August (27).
What is the level of SO2 pollution? (sulfur dioxide (SO2))
18 (Good)
How high is the level of NO2? (nitrogen dioxide (NO2))
3 (Good)
How high is the CO level? (carbon monoxide (CO))
1 (Good)
Current data Friday, May 27, 2022, 12:00 PM
PM10 53 (Unhealthy for Sensitive Groups)
O3 0 (Good)
PM2,5 7 (Good)
SO2 18 (Good)
NO2 3 (Good)
CO 1 (Good)
Data on air pollution from recent days in Xibali
index
2022-05-27
pm10
51
Unhealthy for Sensitive Groups
o3
0
Good
pm25
21
Moderate
so2
10
Good
no2
0
Good
co
1
Good
data source »
Air pollution in Xibali from October 2018 to May 2020
index
2020-05
2020-04
2020-03
2020-02
2020-01
2019-12
2019-11
2019-10
2019-09
2019-08
2019-07
2019-06
2019-05
2019-04
2019-03
2019-02
2019-01
2018-12
2018-11
2018-10
pm25
34 (Moderate)
43 (Unhealthy for Sensitive Groups)
46 (Unhealthy for Sensitive Groups)
54 (Unhealthy for Sensitive Groups)
112 (Very bad Hazardous)
83 (Very Unhealthy)
61 (Unhealthy)
49 (Unhealthy for Sensitive Groups)
38 (Unhealthy for Sensitive Groups)
27 (Moderate)
38 (Unhealthy for Sensitive Groups)
38 (Unhealthy for Sensitive Groups)
37 (Unhealthy for Sensitive Groups)
53 (Unhealthy for Sensitive Groups)
50 (Unhealthy for Sensitive Groups)
101 (Very Unhealthy)
97 (Very Unhealthy)
76 (Very Unhealthy)
84 (Very Unhealthy)
37 (Unhealthy for Sensitive Groups)
co
430 (Good)
808 (Good)
600 (Good)
908 (Good)
1 (Good)
1 (Good)
797 (Good)
675 (Good)
554 (Good)
593 (Good)
691 (Good)
615 (Good)
554 (Good)
719 (Good)
618 (Good)
989 (Good)
1 (Good)
976 (Good)
803 (Good)
433 (Good)
no2
19 (Good)
31 (Good)
29 (Good)
21 (Good)
52 (Moderate)
54 (Moderate)
49 (Moderate)
45 (Moderate)
41 (Moderate)
30 (Good)
24 (Good)
23 (Good)
26 (Good)
49 (Moderate)
52 (Moderate)
57 (Moderate)
65 (Moderate)
64 (Moderate)
52 (Moderate)
51 (Moderate)
o3
168 (Unhealthy)
137 (Unhealthy for Sensitive Groups)
110 (Moderate)
93 (Moderate)
78 (Moderate)
60 (Good)
76 (Moderate)
115 (Moderate)
171 (Unhealthy)
139 (Unhealthy for Sensitive Groups)
198 (Very Unhealthy)
219 (Very Unhealthy)
170 (Unhealthy)
136 (Unhealthy for Sensitive Groups)
132 (Unhealthy for Sensitive Groups)
100 (Moderate)
72 (Moderate)
53 (Good)
90 (Moderate)
109 (Moderate)
pm10
63 (Unhealthy for Sensitive Groups)
89 (Unhealthy)
99 (Unhealthy)
76 (Unhealthy for Sensitive Groups)
148 (Very Unhealthy)
125 (Very Unhealthy)
133 (Very Unhealthy)
108 (Unhealthy)
78 (Unhealthy for Sensitive Groups)
53 (Unhealthy for Sensitive Groups)
66 (Unhealthy for Sensitive Groups)
89 (Unhealthy)
98 (Unhealthy)
122 (Very Unhealthy)
118 (Very Unhealthy)
147 (Very Unhealthy)
161 (Very bad Hazardous)
148 (Very Unhealthy)
159 (Very bad Hazardous)
102 (Unhealthy)
so2
8.3 (Good)
12 (Good)
13 (Good)
11 (Good)
22 (Good)
16 (Good)
12 (Good)
9.8 (Good)
11 (Good)
8.3 (Good)
9 (Good)
13 (Good)
13 (Good)
14 (Good)
14 (Good)
21 (Good)
28 (Good)
23 (Good)
12 (Good)
11 (Good)
data source »
长清党校
Friday, May 27, 2022, 12:00 PM
PM10 53 (Unhealthy for Sensitive Groups)
particulate matter (PM10) suspended dust
O3 0.02 (Good)
ozone (O3)
PM2,5 6.6 (Good)
particulate matter (PM2.5) dust
SO2 18 (Good)
sulfur dioxide (SO2)
NO2 3 (Good)
nitrogen dioxide (NO2)
CO 1.3 (Good)
carbon monoxide (CO)
长清党校
index
2022-05-27
pm10
51
o3
0.02
pm25
21
so2
9.6
no2
0.38
co
0.64
长清党校
2018-10 2020-05

index
2020-05
2020-04
2020-03
2020-02
2020-01
2019-12
2019-11
2019-10
2019-09
2019-08
2019-07
2019-06
2019-05
2019-04
2019-03
2019-02
2019-01
2018-12
2018-11
2018-10
pm25
34
43
46
54
112
83
61
49
38
27
38
38
37
53
50
101
97
76
84
37
co
430
808
600
908
1
1
797
675
554
593
691
615
554
719
618
989
1
976
803
433
no2
19
31
29
21
52
54
49
45
41
30
24
23
26
49
52
57
65
64
52
51
o3
168
137
110
93
78
60
76
115
171
139
198
219
170
136
132
100
72
53
90
109
pm10
63
89
99
76
148
125
133
108
78
53
66
89
98
122
118
147
161
148
159
102
so2
8.3
12
13
11
22
16
12
9.8
11
8.3
9
13
13
14
14
21
28
23
12
11
* Pollution data source:
https://openaq.org
(ChinaAQIData)
The data is licensed under CC-By 4.0
PM10 53 (Unhealthy for Sensitive Groups)
O3 0 (Good)
PM2,5 7 (Good)
SO2 18 (Good)
NO2 3 (Good)
CO 1 (Good)
Data on air pollution from recent days in Xibali
| index | 2022-05-27 |
|---|---|
| pm10 | 51 Unhealthy for Sensitive Groups |
| o3 | 0 Good |
| pm25 | 21 Moderate |
| so2 | 10 Good |
| no2 | 0 Good |
| co | 1 Good |

| index | 2020-05 | 2020-04 | 2020-03 | 2020-02 | 2020-01 | 2019-12 | 2019-11 | 2019-10 | 2019-09 | 2019-08 | 2019-07 | 2019-06 | 2019-05 | 2019-04 | 2019-03 | 2019-02 | 2019-01 | 2018-12 | 2018-11 | 2018-10 |
|---|---|---|---|---|---|---|---|---|---|---|---|---|---|---|---|---|---|---|---|---|
| pm25 | 34 (Moderate) | 43 (Unhealthy for Sensitive Groups) | 46 (Unhealthy for Sensitive Groups) | 54 (Unhealthy for Sensitive Groups) | 112 (Very bad Hazardous) | 83 (Very Unhealthy) | 61 (Unhealthy) | 49 (Unhealthy for Sensitive Groups) | 38 (Unhealthy for Sensitive Groups) | 27 (Moderate) | 38 (Unhealthy for Sensitive Groups) | 38 (Unhealthy for Sensitive Groups) | 37 (Unhealthy for Sensitive Groups) | 53 (Unhealthy for Sensitive Groups) | 50 (Unhealthy for Sensitive Groups) | 101 (Very Unhealthy) | 97 (Very Unhealthy) | 76 (Very Unhealthy) | 84 (Very Unhealthy) | 37 (Unhealthy for Sensitive Groups) |
| co | 430 (Good) | 808 (Good) | 600 (Good) | 908 (Good) | 1 (Good) | 1 (Good) | 797 (Good) | 675 (Good) | 554 (Good) | 593 (Good) | 691 (Good) | 615 (Good) | 554 (Good) | 719 (Good) | 618 (Good) | 989 (Good) | 1 (Good) | 976 (Good) | 803 (Good) | 433 (Good) |
| no2 | 19 (Good) | 31 (Good) | 29 (Good) | 21 (Good) | 52 (Moderate) | 54 (Moderate) | 49 (Moderate) | 45 (Moderate) | 41 (Moderate) | 30 (Good) | 24 (Good) | 23 (Good) | 26 (Good) | 49 (Moderate) | 52 (Moderate) | 57 (Moderate) | 65 (Moderate) | 64 (Moderate) | 52 (Moderate) | 51 (Moderate) |
| o3 | 168 (Unhealthy) | 137 (Unhealthy for Sensitive Groups) | 110 (Moderate) | 93 (Moderate) | 78 (Moderate) | 60 (Good) | 76 (Moderate) | 115 (Moderate) | 171 (Unhealthy) | 139 (Unhealthy for Sensitive Groups) | 198 (Very Unhealthy) | 219 (Very Unhealthy) | 170 (Unhealthy) | 136 (Unhealthy for Sensitive Groups) | 132 (Unhealthy for Sensitive Groups) | 100 (Moderate) | 72 (Moderate) | 53 (Good) | 90 (Moderate) | 109 (Moderate) |
| pm10 | 63 (Unhealthy for Sensitive Groups) | 89 (Unhealthy) | 99 (Unhealthy) | 76 (Unhealthy for Sensitive Groups) | 148 (Very Unhealthy) | 125 (Very Unhealthy) | 133 (Very Unhealthy) | 108 (Unhealthy) | 78 (Unhealthy for Sensitive Groups) | 53 (Unhealthy for Sensitive Groups) | 66 (Unhealthy for Sensitive Groups) | 89 (Unhealthy) | 98 (Unhealthy) | 122 (Very Unhealthy) | 118 (Very Unhealthy) | 147 (Very Unhealthy) | 161 (Very bad Hazardous) | 148 (Very Unhealthy) | 159 (Very bad Hazardous) | 102 (Unhealthy) |
| so2 | 8.3 (Good) | 12 (Good) | 13 (Good) | 11 (Good) | 22 (Good) | 16 (Good) | 12 (Good) | 9.8 (Good) | 11 (Good) | 8.3 (Good) | 9 (Good) | 13 (Good) | 13 (Good) | 14 (Good) | 14 (Good) | 21 (Good) | 28 (Good) | 23 (Good) | 12 (Good) | 11 (Good) |
PM10 53 (Unhealthy for Sensitive Groups)
particulate matter (PM10) suspended dustO3 0.02 (Good)
ozone (O3)PM2,5 6.6 (Good)
particulate matter (PM2.5) dustSO2 18 (Good)
sulfur dioxide (SO2)NO2 3 (Good)
nitrogen dioxide (NO2)CO 1.3 (Good)
carbon monoxide (CO)长清党校
| index | 2022-05-27 |
|---|---|
| pm10 | 51 |
| o3 | 0.02 |
| pm25 | 21 |
| so2 | 9.6 |
| no2 | 0.38 |
| co | 0.64 |
长清党校

| index | 2020-05 | 2020-04 | 2020-03 | 2020-02 | 2020-01 | 2019-12 | 2019-11 | 2019-10 | 2019-09 | 2019-08 | 2019-07 | 2019-06 | 2019-05 | 2019-04 | 2019-03 | 2019-02 | 2019-01 | 2018-12 | 2018-11 | 2018-10 |
|---|---|---|---|---|---|---|---|---|---|---|---|---|---|---|---|---|---|---|---|---|
| pm25 | 34 | 43 | 46 | 54 | 112 | 83 | 61 | 49 | 38 | 27 | 38 | 38 | 37 | 53 | 50 | 101 | 97 | 76 | 84 | 37 |
| co | 430 | 808 | 600 | 908 | 1 | 1 | 797 | 675 | 554 | 593 | 691 | 615 | 554 | 719 | 618 | 989 | 1 | 976 | 803 | 433 |
| no2 | 19 | 31 | 29 | 21 | 52 | 54 | 49 | 45 | 41 | 30 | 24 | 23 | 26 | 49 | 52 | 57 | 65 | 64 | 52 | 51 |
| o3 | 168 | 137 | 110 | 93 | 78 | 60 | 76 | 115 | 171 | 139 | 198 | 219 | 170 | 136 | 132 | 100 | 72 | 53 | 90 | 109 |
| pm10 | 63 | 89 | 99 | 76 | 148 | 125 | 133 | 108 | 78 | 53 | 66 | 89 | 98 | 122 | 118 | 147 | 161 | 148 | 159 | 102 |
| so2 | 8.3 | 12 | 13 | 11 | 22 | 16 | 12 | 9.8 | 11 | 8.3 | 9 | 13 | 13 | 14 | 14 | 21 | 28 | 23 | 12 | 11 |