Air Pollution in Hetaozhuang: Real-time Air Quality Index and smog alert.
Pollution and air quality forecast for Hetaozhuang. Today is Tuesday, June 16, 2026. The following air pollution values have been recorded for Hetaozhuang:- particulate matter (PM10) suspended dust - 53 (Unhealthy for Sensitive Groups)
- ozone (O3) - 0 (Good)
- particulate matter (PM2.5) dust - 7 (Good)
- sulfur dioxide (SO2) - 18 (Good)
- nitrogen dioxide (NO2) - 3 (Good)
- carbon monoxide (CO) - 1 (Good)

What is the air quality in Hetaozhuang today? Is the air polluted in Hetaozhuang?. Is there smog?
What is the level of PM10 today in Hetaozhuang? (particulate matter (PM10) suspended dust)
The current level of particulate matter PM10 in Hetaozhuang is:
53 (Unhealthy for Sensitive Groups)
The highest PM10 values usually occur in month: 172 (January 2019).
The lowest value of particulate matter PM10 pollution in Hetaozhuang is usually recorded in: August (64).
How is the O3 level today in Hetaozhuang? (ozone (O3))
0 (Good)
What is the current level of PM2.5 in Hetaozhuang? (particulate matter (PM2.5) dust)
Today's PM2.5 level is:
7 (Good)
For comparison, the highest level of PM2.5 in Hetaozhuang in the last 7 days was: 21 (Friday, May 27, 2022) and the lowest: 21 (Friday, May 27, 2022).
The highest PM2.5 values were recorded: 98 (January 2020).
The lowest level of particulate matter PM2.5 pollution occurs in month: August (28).
What is the level of SO2 pollution? (sulfur dioxide (SO2))
18 (Good)
How high is the level of NO2? (nitrogen dioxide (NO2))
3 (Good)
How high is the CO level? (carbon monoxide (CO))
1 (Good)
Current data Friday, May 27, 2022, 12:00 PM
PM10 53 (Unhealthy for Sensitive Groups)
O3 0 (Good)
PM2,5 7 (Good)
SO2 18 (Good)
NO2 3 (Good)
CO 1 (Good)
Data on air pollution from recent days in Hetaozhuang
index
2022-05-27
pm10
51
Unhealthy for Sensitive Groups
o3
0
Good
pm25
21
Moderate
so2
10
Good
no2
0
Good
co
1
Good
data source »
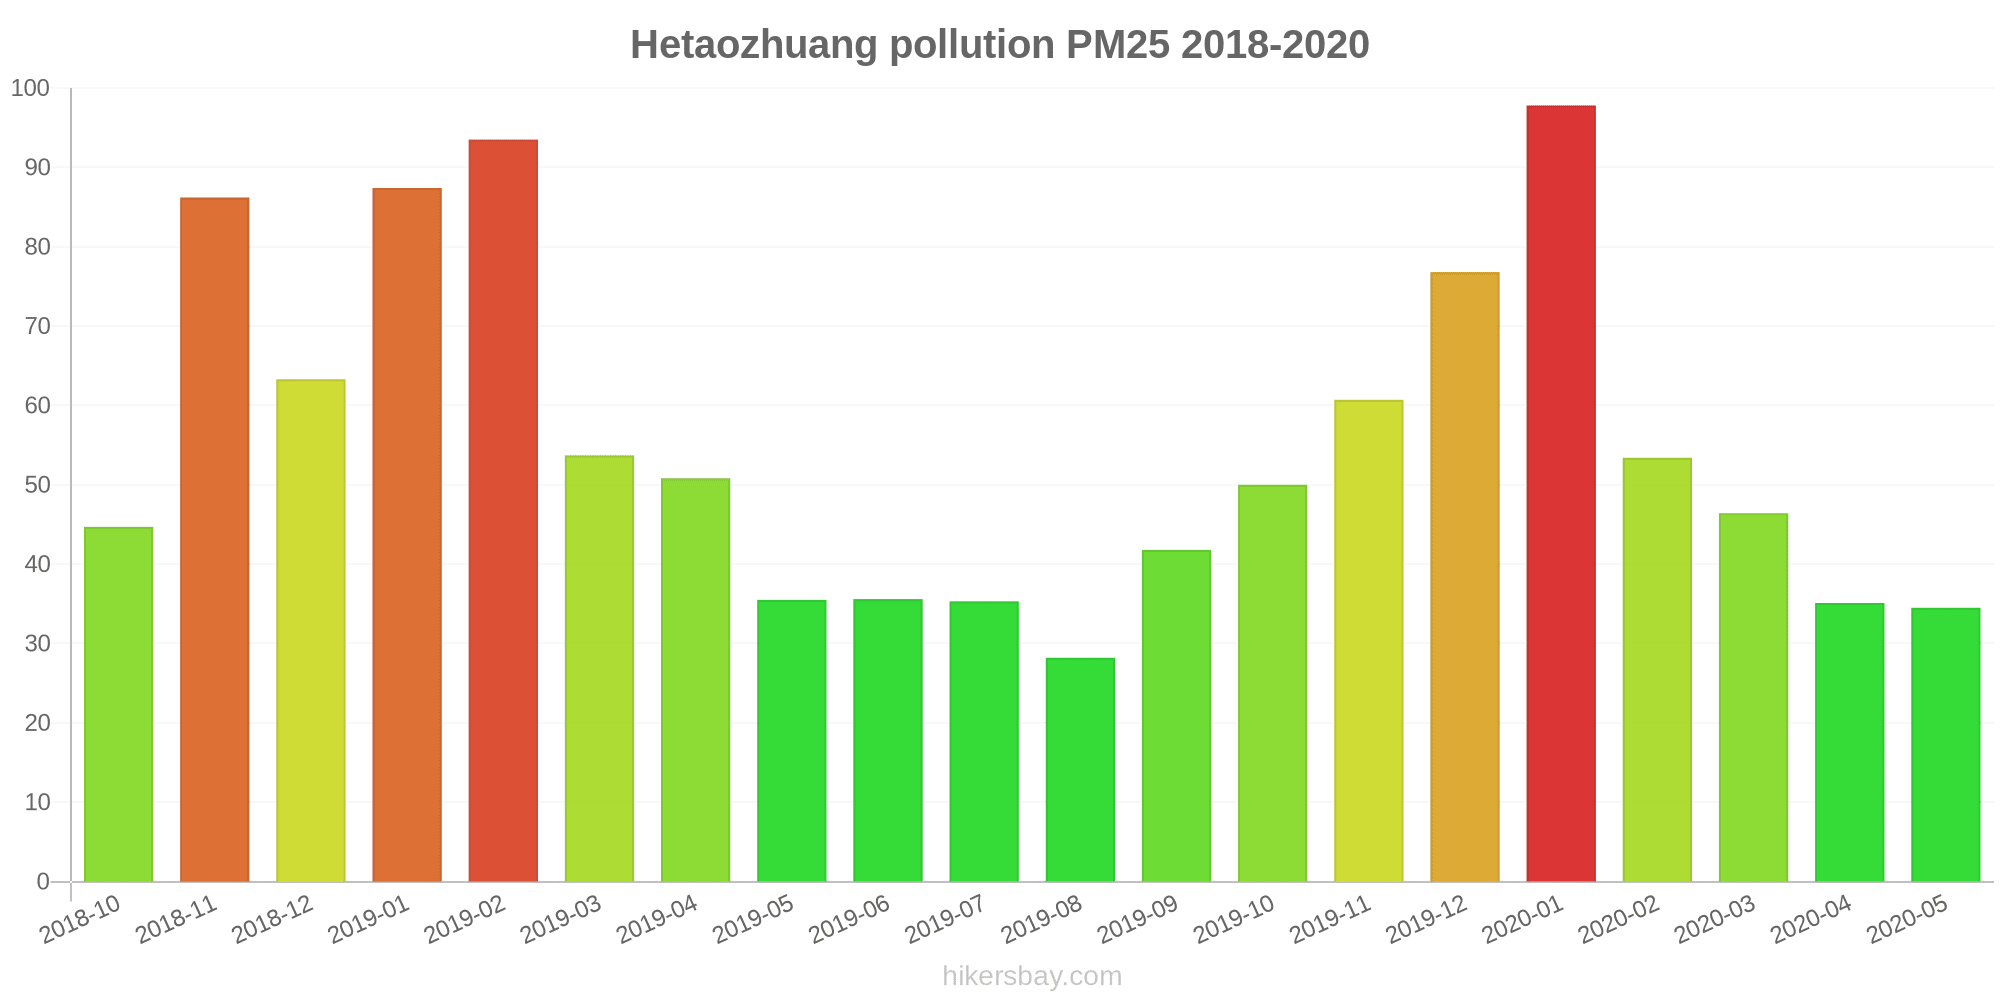
Air pollution in Hetaozhuang from October 2018 to May 2020

index
2020-05
2020-04
2020-03
2020-02
2020-01
2019-12
2019-11
2019-10
2019-09
2019-08
2019-07
2019-06
2019-05
2019-04
2019-03
2019-02
2019-01
2018-12
2018-11
2018-10
pm25
35 (Moderate)
35 (Unhealthy for Sensitive Groups)
46 (Unhealthy for Sensitive Groups)
53 (Unhealthy for Sensitive Groups)
98 (Very Unhealthy)
77 (Very Unhealthy)
61 (Unhealthy)
50 (Unhealthy for Sensitive Groups)
42 (Unhealthy for Sensitive Groups)
28 (Moderate)
35 (Unhealthy for Sensitive Groups)
36 (Unhealthy for Sensitive Groups)
36 (Unhealthy for Sensitive Groups)
51 (Unhealthy for Sensitive Groups)
54 (Unhealthy for Sensitive Groups)
94 (Very Unhealthy)
87 (Very Unhealthy)
63 (Unhealthy)
86 (Very Unhealthy)
45 (Unhealthy for Sensitive Groups)
co
611 (Good)
585 (Good)
740 (Good)
780 (Good)
1 (Good)
1 (Good)
1 (Good)
904 (Good)
997 (Good)
990 (Good)
823 (Good)
738 (Good)
559 (Good)
879 (Good)
767 (Good)
1 (Good)
1 (Good)
1 (Good)
1 (Good)
787 (Good)
no2
29 (Good)
38 (Good)
34 (Good)
23 (Good)
46 (Moderate)
45 (Moderate)
44 (Moderate)
38 (Good)
40 (Moderate)
29 (Good)
25 (Good)
25 (Good)
29 (Good)
35 (Good)
39 (Good)
42 (Moderate)
55 (Moderate)
51 (Moderate)
44 (Moderate)
50 (Moderate)
o3
152 (Unhealthy)
133 (Unhealthy for Sensitive Groups)
119 (Moderate)
96 (Moderate)
78 (Moderate)
52 (Good)
70 (Moderate)
118 (Moderate)
173 (Unhealthy)
145 (Unhealthy for Sensitive Groups)
188 (Very Unhealthy)
210 (Very Unhealthy)
169 (Unhealthy)
133 (Unhealthy for Sensitive Groups)
119 (Moderate)
91 (Moderate)
68 (Good)
59 (Good)
88 (Moderate)
96 (Moderate)
pm10
78 (Unhealthy for Sensitive Groups)
99 (Unhealthy)
107 (Unhealthy)
80 (Unhealthy)
142 (Very Unhealthy)
134 (Very Unhealthy)
146 (Very Unhealthy)
117 (Very Unhealthy)
93 (Unhealthy)
64 (Unhealthy for Sensitive Groups)
68 (Unhealthy for Sensitive Groups)
84 (Unhealthy)
101 (Unhealthy)
120 (Very Unhealthy)
131 (Very Unhealthy)
158 (Very bad Hazardous)
172 (Very bad Hazardous)
148 (Very Unhealthy)
155 (Very bad Hazardous)
103 (Unhealthy)
so2
15 (Good)
19 (Good)
21 (Good)
20 (Good)
29 (Good)
21 (Good)
20 (Good)
15 (Good)
16 (Good)
16 (Good)
15 (Good)
24 (Good)
20 (Good)
22 (Good)
22 (Good)
29 (Good)
32 (Good)
32 (Good)
28 (Good)
29 (Good)
data source »
Friday, May 27, 2022, 12:00 PM
PM10 53 (Unhealthy for Sensitive Groups)
particulate matter (PM10) suspended dust
O3 0.02 (Good)
ozone (O3)
PM2,5 6.6 (Good)
particulate matter (PM2.5) dust
SO2 18 (Good)
sulfur dioxide (SO2)
NO2 3 (Good)
nitrogen dioxide (NO2)
CO 1.3 (Good)
carbon monoxide (CO)
index
2022-05-27
pm10
51
o3
0.02
pm25
21
so2
9.6
no2
0.38
co
0.64
明水开发区
2018-10 2020-05

index
2020-05
2020-04
2020-03
2020-02
2020-01
2019-12
2019-11
2019-10
2019-09
2019-08
2019-07
2019-06
2019-05
2019-04
2019-03
2019-02
2019-01
2018-12
2018-11
2018-10
pm25
35
35
46
53
98
77
61
50
42
28
35
36
36
51
54
94
87
63
86
45
co
611
585
740
780
1
1
1
904
997
990
823
738
559
879
767
1
1
1
1
787
no2
29
38
34
23
46
45
44
38
40
29
25
25
29
35
39
42
55
51
44
50
o3
152
133
119
96
78
52
70
118
173
145
188
210
169
133
119
91
68
59
88
96
pm10
78
99
107
80
142
134
146
117
93
64
68
84
101
120
131
158
172
148
155
103
so2
15
19
21
20
29
21
20
15
16
16
15
24
20
22
22
29
32
32
28
29
* Pollution data source:
https://openaq.org
(ChinaAQIData)
The data is licensed under CC-By 4.0
PM10 53 (Unhealthy for Sensitive Groups)
O3 0 (Good)
PM2,5 7 (Good)
SO2 18 (Good)
NO2 3 (Good)
CO 1 (Good)
Data on air pollution from recent days in Hetaozhuang
| index | 2022-05-27 |
|---|---|
| pm10 | 51 Unhealthy for Sensitive Groups |
| o3 | 0 Good |
| pm25 | 21 Moderate |
| so2 | 10 Good |
| no2 | 0 Good |
| co | 1 Good |
| index | 2020-05 | 2020-04 | 2020-03 | 2020-02 | 2020-01 | 2019-12 | 2019-11 | 2019-10 | 2019-09 | 2019-08 | 2019-07 | 2019-06 | 2019-05 | 2019-04 | 2019-03 | 2019-02 | 2019-01 | 2018-12 | 2018-11 | 2018-10 |
|---|---|---|---|---|---|---|---|---|---|---|---|---|---|---|---|---|---|---|---|---|
| pm25 | 35 (Moderate) | 35 (Unhealthy for Sensitive Groups) | 46 (Unhealthy for Sensitive Groups) | 53 (Unhealthy for Sensitive Groups) | 98 (Very Unhealthy) | 77 (Very Unhealthy) | 61 (Unhealthy) | 50 (Unhealthy for Sensitive Groups) | 42 (Unhealthy for Sensitive Groups) | 28 (Moderate) | 35 (Unhealthy for Sensitive Groups) | 36 (Unhealthy for Sensitive Groups) | 36 (Unhealthy for Sensitive Groups) | 51 (Unhealthy for Sensitive Groups) | 54 (Unhealthy for Sensitive Groups) | 94 (Very Unhealthy) | 87 (Very Unhealthy) | 63 (Unhealthy) | 86 (Very Unhealthy) | 45 (Unhealthy for Sensitive Groups) |
| co | 611 (Good) | 585 (Good) | 740 (Good) | 780 (Good) | 1 (Good) | 1 (Good) | 1 (Good) | 904 (Good) | 997 (Good) | 990 (Good) | 823 (Good) | 738 (Good) | 559 (Good) | 879 (Good) | 767 (Good) | 1 (Good) | 1 (Good) | 1 (Good) | 1 (Good) | 787 (Good) |
| no2 | 29 (Good) | 38 (Good) | 34 (Good) | 23 (Good) | 46 (Moderate) | 45 (Moderate) | 44 (Moderate) | 38 (Good) | 40 (Moderate) | 29 (Good) | 25 (Good) | 25 (Good) | 29 (Good) | 35 (Good) | 39 (Good) | 42 (Moderate) | 55 (Moderate) | 51 (Moderate) | 44 (Moderate) | 50 (Moderate) |
| o3 | 152 (Unhealthy) | 133 (Unhealthy for Sensitive Groups) | 119 (Moderate) | 96 (Moderate) | 78 (Moderate) | 52 (Good) | 70 (Moderate) | 118 (Moderate) | 173 (Unhealthy) | 145 (Unhealthy for Sensitive Groups) | 188 (Very Unhealthy) | 210 (Very Unhealthy) | 169 (Unhealthy) | 133 (Unhealthy for Sensitive Groups) | 119 (Moderate) | 91 (Moderate) | 68 (Good) | 59 (Good) | 88 (Moderate) | 96 (Moderate) |
| pm10 | 78 (Unhealthy for Sensitive Groups) | 99 (Unhealthy) | 107 (Unhealthy) | 80 (Unhealthy) | 142 (Very Unhealthy) | 134 (Very Unhealthy) | 146 (Very Unhealthy) | 117 (Very Unhealthy) | 93 (Unhealthy) | 64 (Unhealthy for Sensitive Groups) | 68 (Unhealthy for Sensitive Groups) | 84 (Unhealthy) | 101 (Unhealthy) | 120 (Very Unhealthy) | 131 (Very Unhealthy) | 158 (Very bad Hazardous) | 172 (Very bad Hazardous) | 148 (Very Unhealthy) | 155 (Very bad Hazardous) | 103 (Unhealthy) |
| so2 | 15 (Good) | 19 (Good) | 21 (Good) | 20 (Good) | 29 (Good) | 21 (Good) | 20 (Good) | 15 (Good) | 16 (Good) | 16 (Good) | 15 (Good) | 24 (Good) | 20 (Good) | 22 (Good) | 22 (Good) | 29 (Good) | 32 (Good) | 32 (Good) | 28 (Good) | 29 (Good) |
PM10 53 (Unhealthy for Sensitive Groups)
particulate matter (PM10) suspended dustO3 0.02 (Good)
ozone (O3)PM2,5 6.6 (Good)
particulate matter (PM2.5) dustSO2 18 (Good)
sulfur dioxide (SO2)NO2 3 (Good)
nitrogen dioxide (NO2)CO 1.3 (Good)
carbon monoxide (CO)
| index | 2022-05-27 |
|---|---|
| pm10 | 51 |
| o3 | 0.02 |
| pm25 | 21 |
| so2 | 9.6 |
| no2 | 0.38 |
| co | 0.64 |
明水开发区

| index | 2020-05 | 2020-04 | 2020-03 | 2020-02 | 2020-01 | 2019-12 | 2019-11 | 2019-10 | 2019-09 | 2019-08 | 2019-07 | 2019-06 | 2019-05 | 2019-04 | 2019-03 | 2019-02 | 2019-01 | 2018-12 | 2018-11 | 2018-10 |
|---|---|---|---|---|---|---|---|---|---|---|---|---|---|---|---|---|---|---|---|---|
| pm25 | 35 | 35 | 46 | 53 | 98 | 77 | 61 | 50 | 42 | 28 | 35 | 36 | 36 | 51 | 54 | 94 | 87 | 63 | 86 | 45 |
| co | 611 | 585 | 740 | 780 | 1 | 1 | 1 | 904 | 997 | 990 | 823 | 738 | 559 | 879 | 767 | 1 | 1 | 1 | 1 | 787 |
| no2 | 29 | 38 | 34 | 23 | 46 | 45 | 44 | 38 | 40 | 29 | 25 | 25 | 29 | 35 | 39 | 42 | 55 | 51 | 44 | 50 |
| o3 | 152 | 133 | 119 | 96 | 78 | 52 | 70 | 118 | 173 | 145 | 188 | 210 | 169 | 133 | 119 | 91 | 68 | 59 | 88 | 96 |
| pm10 | 78 | 99 | 107 | 80 | 142 | 134 | 146 | 117 | 93 | 64 | 68 | 84 | 101 | 120 | 131 | 158 | 172 | 148 | 155 | 103 |
| so2 | 15 | 19 | 21 | 20 | 29 | 21 | 20 | 15 | 16 | 16 | 15 | 24 | 20 | 22 | 22 | 29 | 32 | 32 | 28 | 29 |