Air Pollution in Shihuayuan: Real-time Air Quality Index and smog alert.
Pollution and air quality forecast for Shihuayuan. Today is Tuesday, June 16, 2026. The following air pollution values have been recorded for Shihuayuan:- particulate matter (PM10) suspended dust - 53 (Unhealthy for Sensitive Groups)
- ozone (O3) - 0 (Good)
- particulate matter (PM2.5) dust - 7 (Good)
- sulfur dioxide (SO2) - 18 (Good)
- nitrogen dioxide (NO2) - 3 (Good)
- carbon monoxide (CO) - 1 (Good)

What is the air quality in Shihuayuan today? Is the air polluted in Shihuayuan?. Is there smog?
What is the level of PM10 today in Shihuayuan? (particulate matter (PM10) suspended dust)
The current level of particulate matter PM10 in Shihuayuan is:
53 (Unhealthy for Sensitive Groups)
The highest PM10 values usually occur in month: 161 (January 2020).
The lowest value of particulate matter PM10 pollution in Shihuayuan is usually recorded in: August (63).
How is the O3 level today in Shihuayuan? (ozone (O3))
0 (Good)
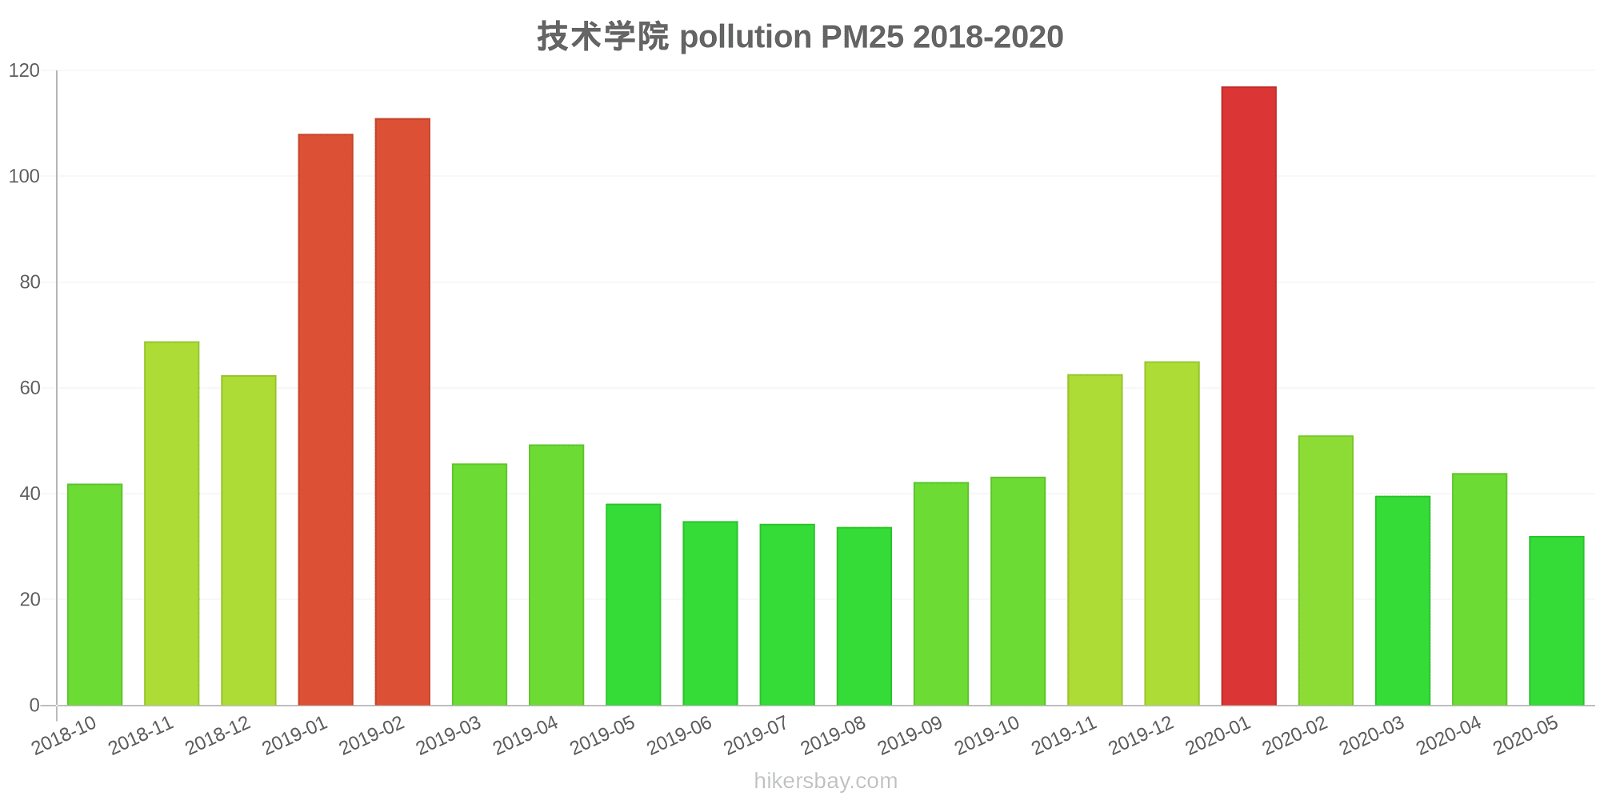
What is the current level of PM2.5 in Shihuayuan? (particulate matter (PM2.5) dust)
Today's PM2.5 level is:
7 (Good)
For comparison, the highest level of PM2.5 in Shihuayuan in the last 7 days was: 21 (Friday, May 27, 2022) and the lowest: 21 (Friday, May 27, 2022).
The highest PM2.5 values were recorded: 117 (January 2020).
The lowest level of particulate matter PM2.5 pollution occurs in month: May (32).
What is the level of SO2 pollution? (sulfur dioxide (SO2))
18 (Good)
How high is the level of NO2? (nitrogen dioxide (NO2))
3 (Good)
How high is the CO level? (carbon monoxide (CO))
1 (Good)
Current data Friday, May 27, 2022, 12:00 PM
PM10 53 (Unhealthy for Sensitive Groups)
O3 0 (Good)
PM2,5 7 (Good)
SO2 18 (Good)
NO2 3 (Good)
CO 1 (Good)
Data on air pollution from recent days in Shihuayuan
index
2022-05-27
pm10
51
Unhealthy for Sensitive Groups
o3
0
Good
pm25
21
Moderate
so2
10
Good
no2
0
Good
co
1
Good
data source »
Air pollution in Shihuayuan from October 2018 to May 2020

index
2020-05
2020-04
2020-03
2020-02
2020-01
2019-12
2019-11
2019-10
2019-09
2019-08
2019-07
2019-06
2019-05
2019-04
2019-03
2019-02
2019-01
2018-12
2018-11
2018-10
pm25
32 (Moderate)
44 (Unhealthy for Sensitive Groups)
40 (Unhealthy for Sensitive Groups)
51 (Unhealthy for Sensitive Groups)
117 (Very bad Hazardous)
65 (Unhealthy)
63 (Unhealthy)
43 (Unhealthy for Sensitive Groups)
42 (Unhealthy for Sensitive Groups)
34 (Moderate)
34 (Moderate)
35 (Moderate)
38 (Unhealthy for Sensitive Groups)
49 (Unhealthy for Sensitive Groups)
46 (Unhealthy for Sensitive Groups)
111 (Very bad Hazardous)
108 (Very Unhealthy)
62 (Unhealthy)
69 (Unhealthy)
42 (Unhealthy for Sensitive Groups)
co
1 (Good)
1 (Good)
942 (Good)
1 (Good)
2 (Good)
1 (Good)
1 (Good)
1 (Good)
1 (Good)
987 (Good)
967 (Good)
763 (Good)
863 (Good)
1 (Good)
1 (Good)
1 (Good)
1 (Good)
1 (Good)
1 (Good)
1 (Good)
no2
35 (Good)
42 (Moderate)
33 (Good)
23 (Good)
42 (Moderate)
42 (Moderate)
45 (Moderate)
43 (Moderate)
45 (Moderate)
27 (Good)
30 (Good)
38 (Good)
40 (Moderate)
39 (Good)
44 (Moderate)
40 (Good)
55 (Moderate)
47 (Moderate)
48 (Moderate)
53 (Moderate)
o3
155 (Unhealthy)
143 (Unhealthy for Sensitive Groups)
115 (Moderate)
104 (Moderate)
88 (Moderate)
75 (Moderate)
89 (Moderate)
113 (Moderate)
168 (Unhealthy)
179 (Unhealthy)
203 (Very Unhealthy)
208 (Very Unhealthy)
172 (Unhealthy)
149 (Unhealthy for Sensitive Groups)
127 (Unhealthy for Sensitive Groups)
109 (Moderate)
78 (Moderate)
64 (Good)
94 (Moderate)
117 (Moderate)
pm10
90 (Unhealthy)
121 (Very Unhealthy)
107 (Unhealthy)
90 (Unhealthy)
161 (Very bad Hazardous)
113 (Very Unhealthy)
127 (Very Unhealthy)
93 (Unhealthy)
78 (Unhealthy for Sensitive Groups)
63 (Unhealthy for Sensitive Groups)
70 (Unhealthy for Sensitive Groups)
79 (Unhealthy for Sensitive Groups)
110 (Very Unhealthy)
116 (Very Unhealthy)
109 (Unhealthy)
158 (Very bad Hazardous)
160 (Very bad Hazardous)
129 (Very Unhealthy)
156 (Very bad Hazardous)
96 (Unhealthy)
so2
11 (Good)
14 (Good)
14 (Good)
17 (Good)
24 (Good)
23 (Good)
19 (Good)
12 (Good)
13 (Good)
9.6 (Good)
9.2 (Good)
13 (Good)
15 (Good)
14 (Good)
21 (Good)
21 (Good)
36 (Good)
32 (Good)
23 (Good)
19 (Good)
data source »
技术学院
Friday, May 27, 2022, 12:00 PM
PM10 53 (Unhealthy for Sensitive Groups)
particulate matter (PM10) suspended dust
O3 0.02 (Good)
ozone (O3)
PM2,5 6.6 (Good)
particulate matter (PM2.5) dust
SO2 18 (Good)
sulfur dioxide (SO2)
NO2 3 (Good)
nitrogen dioxide (NO2)
CO 1.3 (Good)
carbon monoxide (CO)
技术学院
index
2022-05-27
pm10
51
o3
0.02
pm25
21
so2
9.6
no2
0.38
co
0.64
技术学院
2018-10 2020-05
index
2020-05
2020-04
2020-03
2020-02
2020-01
2019-12
2019-11
2019-10
2019-09
2019-08
2019-07
2019-06
2019-05
2019-04
2019-03
2019-02
2019-01
2018-12
2018-11
2018-10
pm25
32
44
40
51
117
65
63
43
42
34
34
35
38
49
46
111
108
62
69
42
co
1
1
942
1
2
1
1
1
1
987
967
763
863
1
1
1
1
1
1
1
no2
35
42
33
23
42
42
45
43
45
27
30
38
40
39
44
40
55
47
48
53
o3
155
143
115
104
88
75
89
113
168
179
203
208
172
149
127
109
78
64
94
117
pm10
90
121
107
90
161
113
127
93
78
63
70
79
110
116
109
158
160
129
156
96
so2
11
14
14
17
24
23
19
12
13
9.6
9.2
13
15
14
21
21
36
32
23
19
* Pollution data source:
https://openaq.org
(ChinaAQIData)
The data is licensed under CC-By 4.0
PM10 53 (Unhealthy for Sensitive Groups)
O3 0 (Good)
PM2,5 7 (Good)
SO2 18 (Good)
NO2 3 (Good)
CO 1 (Good)
Data on air pollution from recent days in Shihuayuan
| index | 2022-05-27 |
|---|---|
| pm10 | 51 Unhealthy for Sensitive Groups |
| o3 | 0 Good |
| pm25 | 21 Moderate |
| so2 | 10 Good |
| no2 | 0 Good |
| co | 1 Good |

| index | 2020-05 | 2020-04 | 2020-03 | 2020-02 | 2020-01 | 2019-12 | 2019-11 | 2019-10 | 2019-09 | 2019-08 | 2019-07 | 2019-06 | 2019-05 | 2019-04 | 2019-03 | 2019-02 | 2019-01 | 2018-12 | 2018-11 | 2018-10 |
|---|---|---|---|---|---|---|---|---|---|---|---|---|---|---|---|---|---|---|---|---|
| pm25 | 32 (Moderate) | 44 (Unhealthy for Sensitive Groups) | 40 (Unhealthy for Sensitive Groups) | 51 (Unhealthy for Sensitive Groups) | 117 (Very bad Hazardous) | 65 (Unhealthy) | 63 (Unhealthy) | 43 (Unhealthy for Sensitive Groups) | 42 (Unhealthy for Sensitive Groups) | 34 (Moderate) | 34 (Moderate) | 35 (Moderate) | 38 (Unhealthy for Sensitive Groups) | 49 (Unhealthy for Sensitive Groups) | 46 (Unhealthy for Sensitive Groups) | 111 (Very bad Hazardous) | 108 (Very Unhealthy) | 62 (Unhealthy) | 69 (Unhealthy) | 42 (Unhealthy for Sensitive Groups) |
| co | 1 (Good) | 1 (Good) | 942 (Good) | 1 (Good) | 2 (Good) | 1 (Good) | 1 (Good) | 1 (Good) | 1 (Good) | 987 (Good) | 967 (Good) | 763 (Good) | 863 (Good) | 1 (Good) | 1 (Good) | 1 (Good) | 1 (Good) | 1 (Good) | 1 (Good) | 1 (Good) |
| no2 | 35 (Good) | 42 (Moderate) | 33 (Good) | 23 (Good) | 42 (Moderate) | 42 (Moderate) | 45 (Moderate) | 43 (Moderate) | 45 (Moderate) | 27 (Good) | 30 (Good) | 38 (Good) | 40 (Moderate) | 39 (Good) | 44 (Moderate) | 40 (Good) | 55 (Moderate) | 47 (Moderate) | 48 (Moderate) | 53 (Moderate) |
| o3 | 155 (Unhealthy) | 143 (Unhealthy for Sensitive Groups) | 115 (Moderate) | 104 (Moderate) | 88 (Moderate) | 75 (Moderate) | 89 (Moderate) | 113 (Moderate) | 168 (Unhealthy) | 179 (Unhealthy) | 203 (Very Unhealthy) | 208 (Very Unhealthy) | 172 (Unhealthy) | 149 (Unhealthy for Sensitive Groups) | 127 (Unhealthy for Sensitive Groups) | 109 (Moderate) | 78 (Moderate) | 64 (Good) | 94 (Moderate) | 117 (Moderate) |
| pm10 | 90 (Unhealthy) | 121 (Very Unhealthy) | 107 (Unhealthy) | 90 (Unhealthy) | 161 (Very bad Hazardous) | 113 (Very Unhealthy) | 127 (Very Unhealthy) | 93 (Unhealthy) | 78 (Unhealthy for Sensitive Groups) | 63 (Unhealthy for Sensitive Groups) | 70 (Unhealthy for Sensitive Groups) | 79 (Unhealthy for Sensitive Groups) | 110 (Very Unhealthy) | 116 (Very Unhealthy) | 109 (Unhealthy) | 158 (Very bad Hazardous) | 160 (Very bad Hazardous) | 129 (Very Unhealthy) | 156 (Very bad Hazardous) | 96 (Unhealthy) |
| so2 | 11 (Good) | 14 (Good) | 14 (Good) | 17 (Good) | 24 (Good) | 23 (Good) | 19 (Good) | 12 (Good) | 13 (Good) | 9.6 (Good) | 9.2 (Good) | 13 (Good) | 15 (Good) | 14 (Good) | 21 (Good) | 21 (Good) | 36 (Good) | 32 (Good) | 23 (Good) | 19 (Good) |
PM10 53 (Unhealthy for Sensitive Groups)
particulate matter (PM10) suspended dustO3 0.02 (Good)
ozone (O3)PM2,5 6.6 (Good)
particulate matter (PM2.5) dustSO2 18 (Good)
sulfur dioxide (SO2)NO2 3 (Good)
nitrogen dioxide (NO2)CO 1.3 (Good)
carbon monoxide (CO)技术学院
| index | 2022-05-27 |
|---|---|
| pm10 | 51 |
| o3 | 0.02 |
| pm25 | 21 |
| so2 | 9.6 |
| no2 | 0.38 |
| co | 0.64 |
技术学院

| index | 2020-05 | 2020-04 | 2020-03 | 2020-02 | 2020-01 | 2019-12 | 2019-11 | 2019-10 | 2019-09 | 2019-08 | 2019-07 | 2019-06 | 2019-05 | 2019-04 | 2019-03 | 2019-02 | 2019-01 | 2018-12 | 2018-11 | 2018-10 |
|---|---|---|---|---|---|---|---|---|---|---|---|---|---|---|---|---|---|---|---|---|
| pm25 | 32 | 44 | 40 | 51 | 117 | 65 | 63 | 43 | 42 | 34 | 34 | 35 | 38 | 49 | 46 | 111 | 108 | 62 | 69 | 42 |
| co | 1 | 1 | 942 | 1 | 2 | 1 | 1 | 1 | 1 | 987 | 967 | 763 | 863 | 1 | 1 | 1 | 1 | 1 | 1 | 1 |
| no2 | 35 | 42 | 33 | 23 | 42 | 42 | 45 | 43 | 45 | 27 | 30 | 38 | 40 | 39 | 44 | 40 | 55 | 47 | 48 | 53 |
| o3 | 155 | 143 | 115 | 104 | 88 | 75 | 89 | 113 | 168 | 179 | 203 | 208 | 172 | 149 | 127 | 109 | 78 | 64 | 94 | 117 |
| pm10 | 90 | 121 | 107 | 90 | 161 | 113 | 127 | 93 | 78 | 63 | 70 | 79 | 110 | 116 | 109 | 158 | 160 | 129 | 156 | 96 |
| so2 | 11 | 14 | 14 | 17 | 24 | 23 | 19 | 12 | 13 | 9.6 | 9.2 | 13 | 15 | 14 | 21 | 21 | 36 | 32 | 23 | 19 |