Air Pollution in Weijia: Real-time Air Quality Index and smog alert.
Pollution and air quality forecast for Weijia. Today is Tuesday, June 16, 2026. The following air pollution values have been recorded for Weijia:- particulate matter (PM10) suspended dust - 53 (Unhealthy for Sensitive Groups)
- ozone (O3) - 0 (Good)
- particulate matter (PM2.5) dust - 7 (Good)
- sulfur dioxide (SO2) - 18 (Good)
- nitrogen dioxide (NO2) - 3 (Good)
- carbon monoxide (CO) - 1 (Good)

What is the air quality in Weijia today? Is the air polluted in Weijia?. Is there smog?
What is the level of PM10 today in Weijia? (particulate matter (PM10) suspended dust)
The current level of particulate matter PM10 in Weijia is:
53 (Unhealthy for Sensitive Groups)
The highest PM10 values usually occur in month: 169 (November 2018).
The lowest value of particulate matter PM10 pollution in Weijia is usually recorded in: August (56).
How is the O3 level today in Weijia? (ozone (O3))
0 (Good)
What is the current level of PM2.5 in Weijia? (particulate matter (PM2.5) dust)
Today's PM2.5 level is:
7 (Good)
For comparison, the highest level of PM2.5 in Weijia in the last 7 days was: 21 (Friday, May 27, 2022) and the lowest: 21 (Friday, May 27, 2022).
The highest PM2.5 values were recorded: 114 (January 2020).
The lowest level of particulate matter PM2.5 pollution occurs in month: August (26).
What is the level of SO2 pollution? (sulfur dioxide (SO2))
18 (Good)
How high is the level of NO2? (nitrogen dioxide (NO2))
3 (Good)
How high is the CO level? (carbon monoxide (CO))
1 (Good)
Current data Friday, May 27, 2022, 12:00 PM
PM10 53 (Unhealthy for Sensitive Groups)
O3 0 (Good)
PM2,5 7 (Good)
SO2 18 (Good)
NO2 3 (Good)
CO 1 (Good)
Data on air pollution from recent days in Weijia
index
2022-05-27
pm10
51
Unhealthy for Sensitive Groups
o3
0
Good
pm25
21
Moderate
so2
10
Good
no2
0
Good
co
1
Good
data source »
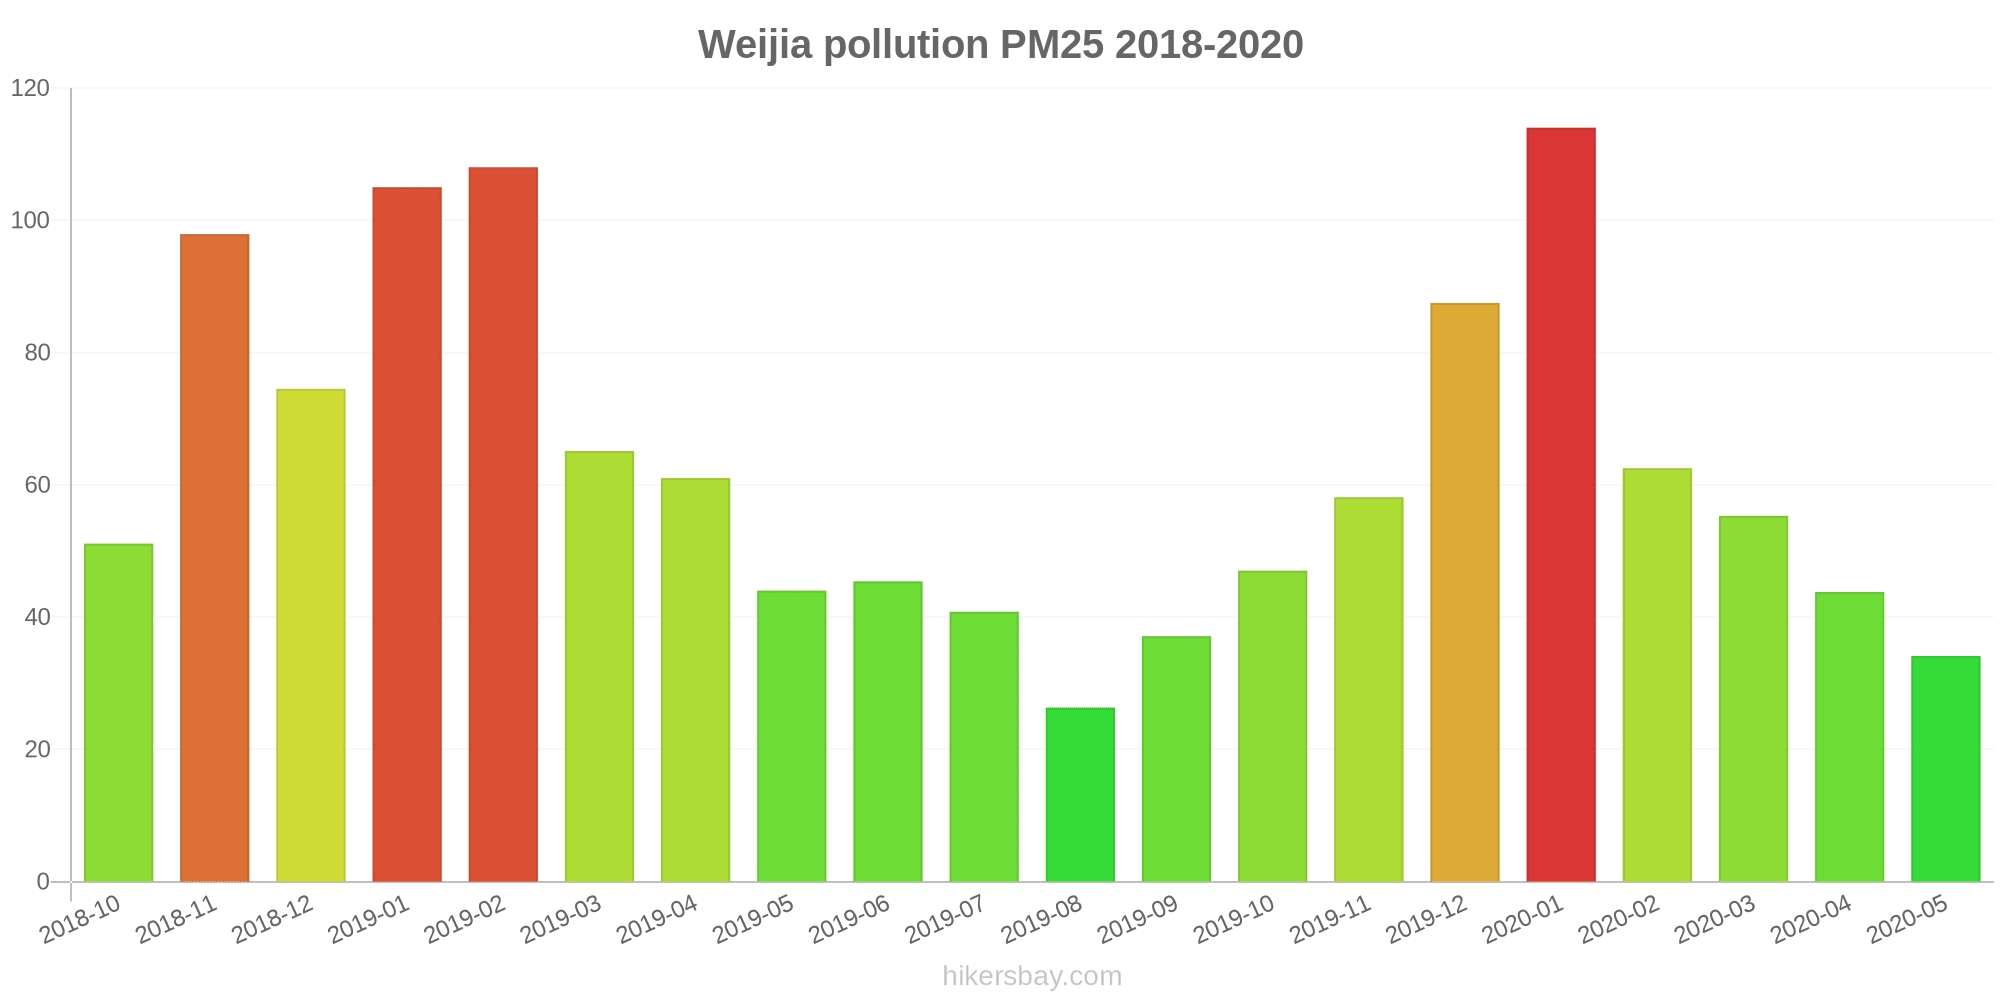
Air pollution in Weijia from October 2018 to May 2020
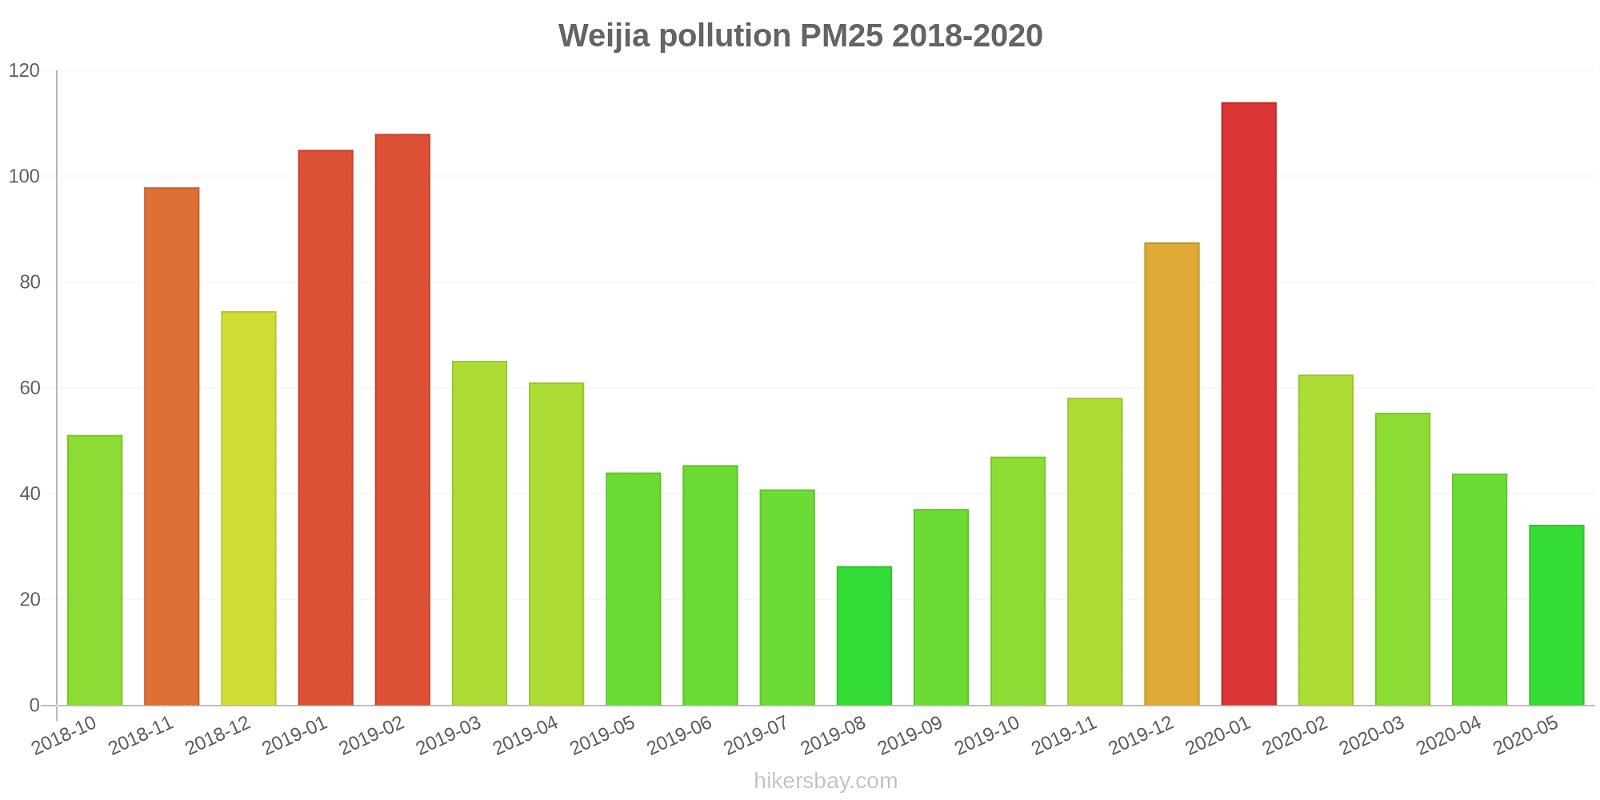
index
2020-05
2020-04
2020-03
2020-02
2020-01
2019-12
2019-11
2019-10
2019-09
2019-08
2019-07
2019-06
2019-05
2019-04
2019-03
2019-02
2019-01
2018-12
2018-11
2018-10
pm25
34 (Moderate)
44 (Unhealthy for Sensitive Groups)
55 (Unhealthy)
63 (Unhealthy)
114 (Very bad Hazardous)
88 (Very Unhealthy)
58 (Unhealthy)
47 (Unhealthy for Sensitive Groups)
37 (Unhealthy for Sensitive Groups)
26 (Moderate)
41 (Unhealthy for Sensitive Groups)
45 (Unhealthy for Sensitive Groups)
44 (Unhealthy for Sensitive Groups)
61 (Unhealthy)
65 (Unhealthy)
108 (Very Unhealthy)
105 (Very Unhealthy)
75 (Unhealthy)
98 (Very Unhealthy)
51 (Unhealthy for Sensitive Groups)
co
702 (Good)
738 (Good)
752 (Good)
811 (Good)
1 (Good)
1 (Good)
1 (Good)
788 (Good)
668 (Good)
474 (Good)
734 (Good)
536 (Good)
643 (Good)
846 (Good)
890 (Good)
1 (Good)
1 (Good)
1 (Good)
1 (Good)
996 (Good)
no2
29 (Good)
47 (Moderate)
47 (Moderate)
30 (Good)
56 (Moderate)
56 (Moderate)
54 (Moderate)
51 (Moderate)
48 (Moderate)
34 (Good)
28 (Good)
32 (Good)
37 (Good)
43 (Moderate)
48 (Moderate)
50 (Moderate)
58 (Moderate)
57 (Moderate)
61 (Moderate)
61 (Moderate)
o3
148 (Unhealthy for Sensitive Groups)
131 (Unhealthy for Sensitive Groups)
114 (Moderate)
91 (Moderate)
75 (Moderate)
51 (Good)
76 (Moderate)
124 (Unhealthy for Sensitive Groups)
185 (Very Unhealthy)
152 (Unhealthy)
209 (Very Unhealthy)
231 (Very Unhealthy)
186 (Very Unhealthy)
148 (Unhealthy for Sensitive Groups)
127 (Unhealthy for Sensitive Groups)
101 (Moderate)
58 (Good)
57 (Good)
99 (Moderate)
111 (Moderate)
pm10
71 (Unhealthy for Sensitive Groups)
99 (Unhealthy)
105 (Unhealthy)
76 (Unhealthy for Sensitive Groups)
143 (Very Unhealthy)
129 (Very Unhealthy)
132 (Very Unhealthy)
120 (Very Unhealthy)
93 (Unhealthy)
56 (Unhealthy for Sensitive Groups)
65 (Unhealthy for Sensitive Groups)
80 (Unhealthy)
104 (Unhealthy)
120 (Very Unhealthy)
128 (Very Unhealthy)
151 (Very bad Hazardous)
167 (Very bad Hazardous)
136 (Very Unhealthy)
169 (Very bad Hazardous)
119 (Very Unhealthy)
so2
15 (Good)
17 (Good)
15 (Good)
11 (Good)
26 (Good)
19 (Good)
19 (Good)
15 (Good)
13 (Good)
8.6 (Good)
8.9 (Good)
17 (Good)
22 (Good)
22 (Good)
29 (Good)
27 (Good)
30 (Good)
27 (Good)
29 (Good)
24 (Good)
data source »
东风化工厂
Friday, May 27, 2022, 12:00 PM
PM10 53 (Unhealthy for Sensitive Groups)
particulate matter (PM10) suspended dust
O3 0.02 (Good)
ozone (O3)
PM2,5 6.6 (Good)
particulate matter (PM2.5) dust
SO2 18 (Good)
sulfur dioxide (SO2)
NO2 3 (Good)
nitrogen dioxide (NO2)
CO 1.3 (Good)
carbon monoxide (CO)
东风化工厂
index
2022-05-27
pm10
51
o3
0.02
pm25
21
so2
9.6
no2
0.38
co
0.64
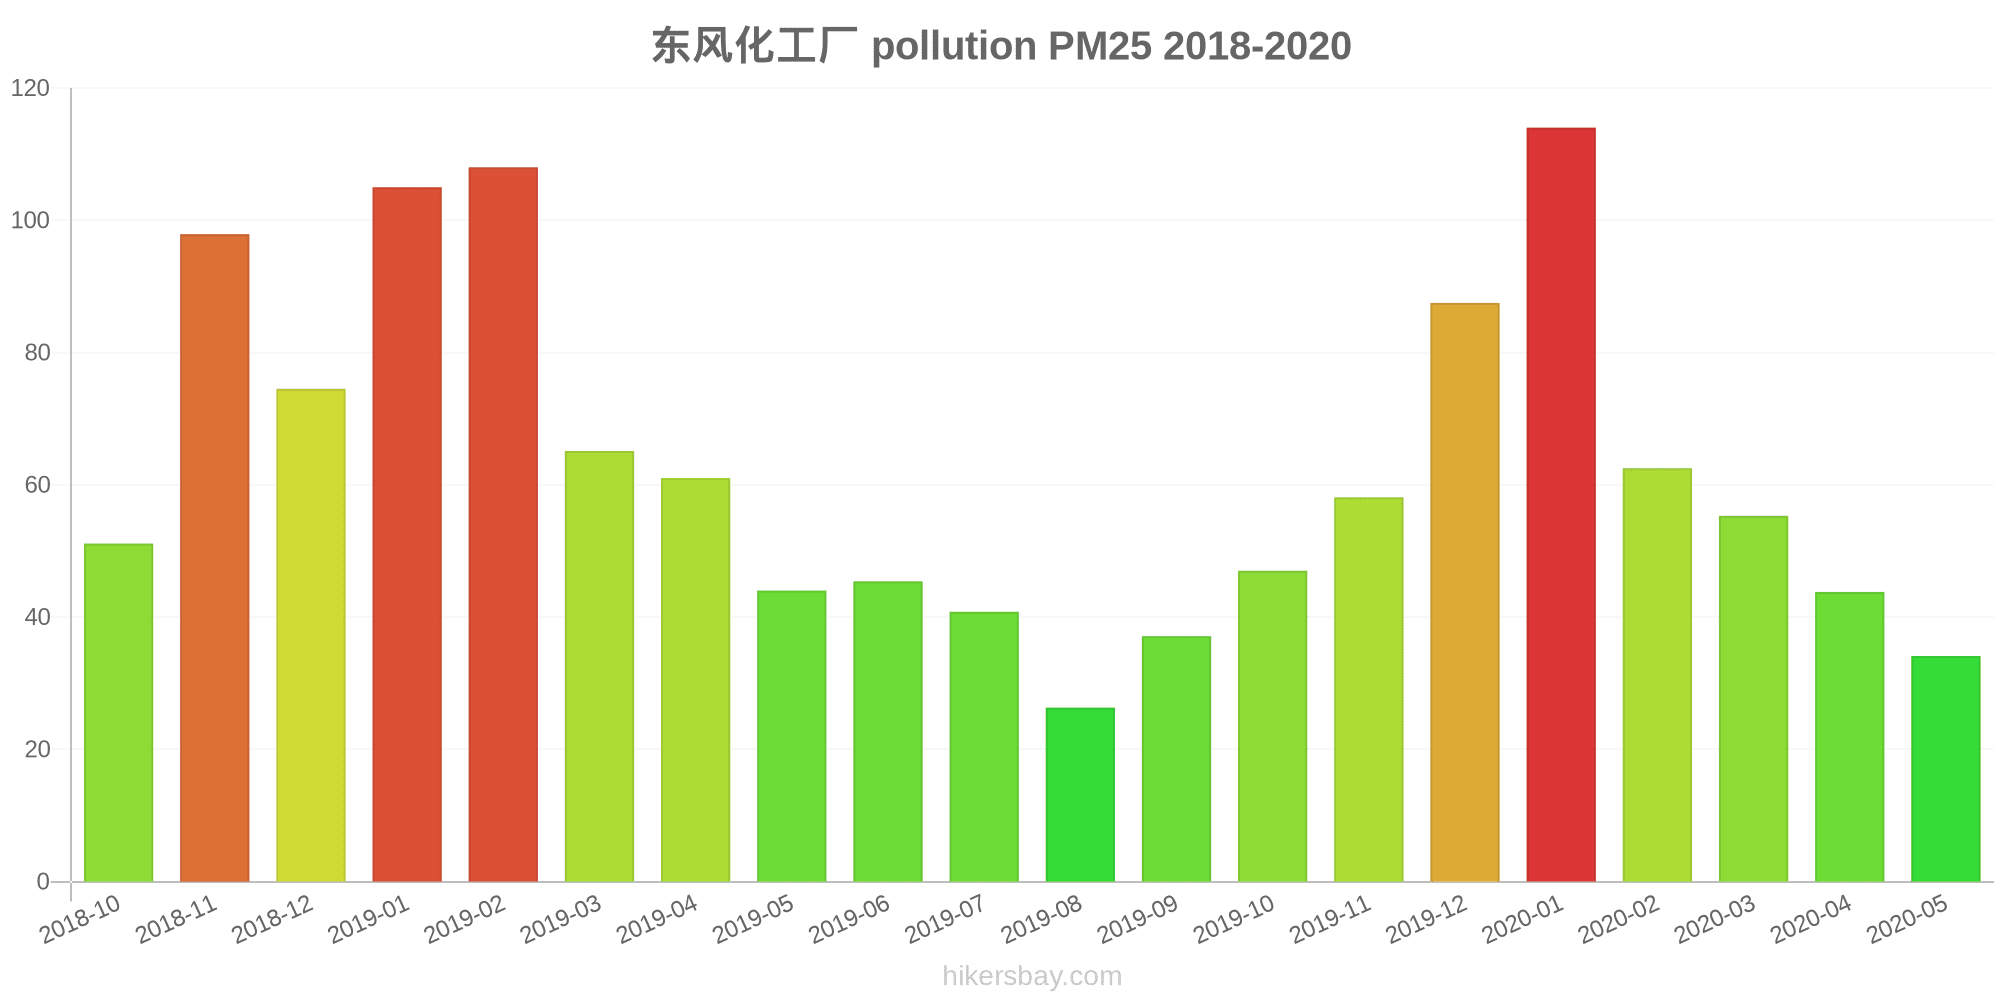
东风化工厂
2018-10 2020-05

index
2020-05
2020-04
2020-03
2020-02
2020-01
2019-12
2019-11
2019-10
2019-09
2019-08
2019-07
2019-06
2019-05
2019-04
2019-03
2019-02
2019-01
2018-12
2018-11
2018-10
pm25
34
44
55
63
114
88
58
47
37
26
41
45
44
61
65
108
105
75
98
51
co
702
738
752
811
1
1
1
788
668
474
734
536
643
846
890
1
1
1
1
996
no2
29
47
47
30
56
56
54
51
48
34
28
32
37
43
48
50
58
57
61
61
o3
148
131
114
91
75
51
76
124
185
152
209
231
186
148
127
101
58
57
99
111
pm10
71
99
105
76
143
129
132
120
93
56
65
80
104
120
128
151
167
136
169
119
so2
15
17
15
11
26
19
19
15
13
8.6
8.9
17
22
22
29
27
30
27
29
24
* Pollution data source:
https://openaq.org
(ChinaAQIData)
The data is licensed under CC-By 4.0
PM10 53 (Unhealthy for Sensitive Groups)
O3 0 (Good)
PM2,5 7 (Good)
SO2 18 (Good)
NO2 3 (Good)
CO 1 (Good)
Data on air pollution from recent days in Weijia
| index | 2022-05-27 |
|---|---|
| pm10 | 51 Unhealthy for Sensitive Groups |
| o3 | 0 Good |
| pm25 | 21 Moderate |
| so2 | 10 Good |
| no2 | 0 Good |
| co | 1 Good |
| index | 2020-05 | 2020-04 | 2020-03 | 2020-02 | 2020-01 | 2019-12 | 2019-11 | 2019-10 | 2019-09 | 2019-08 | 2019-07 | 2019-06 | 2019-05 | 2019-04 | 2019-03 | 2019-02 | 2019-01 | 2018-12 | 2018-11 | 2018-10 |
|---|---|---|---|---|---|---|---|---|---|---|---|---|---|---|---|---|---|---|---|---|
| pm25 | 34 (Moderate) | 44 (Unhealthy for Sensitive Groups) | 55 (Unhealthy) | 63 (Unhealthy) | 114 (Very bad Hazardous) | 88 (Very Unhealthy) | 58 (Unhealthy) | 47 (Unhealthy for Sensitive Groups) | 37 (Unhealthy for Sensitive Groups) | 26 (Moderate) | 41 (Unhealthy for Sensitive Groups) | 45 (Unhealthy for Sensitive Groups) | 44 (Unhealthy for Sensitive Groups) | 61 (Unhealthy) | 65 (Unhealthy) | 108 (Very Unhealthy) | 105 (Very Unhealthy) | 75 (Unhealthy) | 98 (Very Unhealthy) | 51 (Unhealthy for Sensitive Groups) |
| co | 702 (Good) | 738 (Good) | 752 (Good) | 811 (Good) | 1 (Good) | 1 (Good) | 1 (Good) | 788 (Good) | 668 (Good) | 474 (Good) | 734 (Good) | 536 (Good) | 643 (Good) | 846 (Good) | 890 (Good) | 1 (Good) | 1 (Good) | 1 (Good) | 1 (Good) | 996 (Good) |
| no2 | 29 (Good) | 47 (Moderate) | 47 (Moderate) | 30 (Good) | 56 (Moderate) | 56 (Moderate) | 54 (Moderate) | 51 (Moderate) | 48 (Moderate) | 34 (Good) | 28 (Good) | 32 (Good) | 37 (Good) | 43 (Moderate) | 48 (Moderate) | 50 (Moderate) | 58 (Moderate) | 57 (Moderate) | 61 (Moderate) | 61 (Moderate) |
| o3 | 148 (Unhealthy for Sensitive Groups) | 131 (Unhealthy for Sensitive Groups) | 114 (Moderate) | 91 (Moderate) | 75 (Moderate) | 51 (Good) | 76 (Moderate) | 124 (Unhealthy for Sensitive Groups) | 185 (Very Unhealthy) | 152 (Unhealthy) | 209 (Very Unhealthy) | 231 (Very Unhealthy) | 186 (Very Unhealthy) | 148 (Unhealthy for Sensitive Groups) | 127 (Unhealthy for Sensitive Groups) | 101 (Moderate) | 58 (Good) | 57 (Good) | 99 (Moderate) | 111 (Moderate) |
| pm10 | 71 (Unhealthy for Sensitive Groups) | 99 (Unhealthy) | 105 (Unhealthy) | 76 (Unhealthy for Sensitive Groups) | 143 (Very Unhealthy) | 129 (Very Unhealthy) | 132 (Very Unhealthy) | 120 (Very Unhealthy) | 93 (Unhealthy) | 56 (Unhealthy for Sensitive Groups) | 65 (Unhealthy for Sensitive Groups) | 80 (Unhealthy) | 104 (Unhealthy) | 120 (Very Unhealthy) | 128 (Very Unhealthy) | 151 (Very bad Hazardous) | 167 (Very bad Hazardous) | 136 (Very Unhealthy) | 169 (Very bad Hazardous) | 119 (Very Unhealthy) |
| so2 | 15 (Good) | 17 (Good) | 15 (Good) | 11 (Good) | 26 (Good) | 19 (Good) | 19 (Good) | 15 (Good) | 13 (Good) | 8.6 (Good) | 8.9 (Good) | 17 (Good) | 22 (Good) | 22 (Good) | 29 (Good) | 27 (Good) | 30 (Good) | 27 (Good) | 29 (Good) | 24 (Good) |
PM10 53 (Unhealthy for Sensitive Groups)
particulate matter (PM10) suspended dustO3 0.02 (Good)
ozone (O3)PM2,5 6.6 (Good)
particulate matter (PM2.5) dustSO2 18 (Good)
sulfur dioxide (SO2)NO2 3 (Good)
nitrogen dioxide (NO2)CO 1.3 (Good)
carbon monoxide (CO)东风化工厂
| index | 2022-05-27 |
|---|---|
| pm10 | 51 |
| o3 | 0.02 |
| pm25 | 21 |
| so2 | 9.6 |
| no2 | 0.38 |
| co | 0.64 |
东风化工厂
| index | 2020-05 | 2020-04 | 2020-03 | 2020-02 | 2020-01 | 2019-12 | 2019-11 | 2019-10 | 2019-09 | 2019-08 | 2019-07 | 2019-06 | 2019-05 | 2019-04 | 2019-03 | 2019-02 | 2019-01 | 2018-12 | 2018-11 | 2018-10 |
|---|---|---|---|---|---|---|---|---|---|---|---|---|---|---|---|---|---|---|---|---|
| pm25 | 34 | 44 | 55 | 63 | 114 | 88 | 58 | 47 | 37 | 26 | 41 | 45 | 44 | 61 | 65 | 108 | 105 | 75 | 98 | 51 |
| co | 702 | 738 | 752 | 811 | 1 | 1 | 1 | 788 | 668 | 474 | 734 | 536 | 643 | 846 | 890 | 1 | 1 | 1 | 1 | 996 |
| no2 | 29 | 47 | 47 | 30 | 56 | 56 | 54 | 51 | 48 | 34 | 28 | 32 | 37 | 43 | 48 | 50 | 58 | 57 | 61 | 61 |
| o3 | 148 | 131 | 114 | 91 | 75 | 51 | 76 | 124 | 185 | 152 | 209 | 231 | 186 | 148 | 127 | 101 | 58 | 57 | 99 | 111 |
| pm10 | 71 | 99 | 105 | 76 | 143 | 129 | 132 | 120 | 93 | 56 | 65 | 80 | 104 | 120 | 128 | 151 | 167 | 136 | 169 | 119 |
| so2 | 15 | 17 | 15 | 11 | 26 | 19 | 19 | 15 | 13 | 8.6 | 8.9 | 17 | 22 | 22 | 29 | 27 | 30 | 27 | 29 | 24 |